0840
R2* Mapping of Extreme Hepatic Iron Overload Using Free-Breathing UTE Sequence1Department of Radiology, The First Affiliated Hospital of Guangxi Medical University, Nanning, China, 2GE Healthcare, MR Research China, Beijing, China
Synopsis
Keywords: Liver, Quantitative Imaging, free-breathing liver R2∗ mapping;hepatic iron overload
Motivation: Existing liver iron quantification methods are inadequate for extreme iron deposition, hindering effective guidance for iron chelation therapy.
Goal(s): Evaluate the practicality of a free-breathing, single-echo UTE sequence with varying echo times for multiple acquisitions in assessing severe hepatic iron overload.
Approach: A 3.0T UTE sequence with rigid-based motion correction was used to assess hepatic R2* in nine thalassemia patients, and compared with LIC from Ferriscan and R2* from a 1.5T GRE sequence.
Results: UTE-R2* correlated well with GRE-R2* and Ferriscan-LIC, and could differ hepatic iron content in patients whose Ferriscan-LIC or GRE-R2* reach to upper limit.
Impact: An imaging strategy utilizing a free-breathing, single-echo UTE sequence with variable echo times for multiple acquisitions, combined with rigid-based motion correction, could be employed to evaluate extreme hepatic iron deposition.
Introduction
Iron deposition is a pervasive condition that affects multiple systems throughout the body, potentially endangering the patient's life1. Iron chelation therapy is essential for patients with iron deposition, and the dosage of the chelating agent must be precisely adjusted based on the tissue iron concentration. Noninvasive MRI relaxometry, utilizing the R2* parameter, is now routinely employed in clinical settings to monitor the iron content. Previous research2 has shown that the multi-echo UTE sequence provides a more precise measurement of R2* values in cases of high hepatic iron overload than the multi-echo GRE sequence (ME-GRE). However, for patients with extremely severe iron deposition, whose liver R2* values are greater than 2500 Hz in 3.0T, the signal of the second echo images attenuated severely due to a longer TE than 1ms, and making R2* measurements unreliable. Thus, this study aims to explore the feasibility of utilizing a free-breathing single-echo UTE sequence for multiple acquisitions, with each acquisition using a different echo time, and employing rigid-based motion correction technique, to evaluate liver R2* in patients with extreme hepatic iron deposition.Materials and Methods
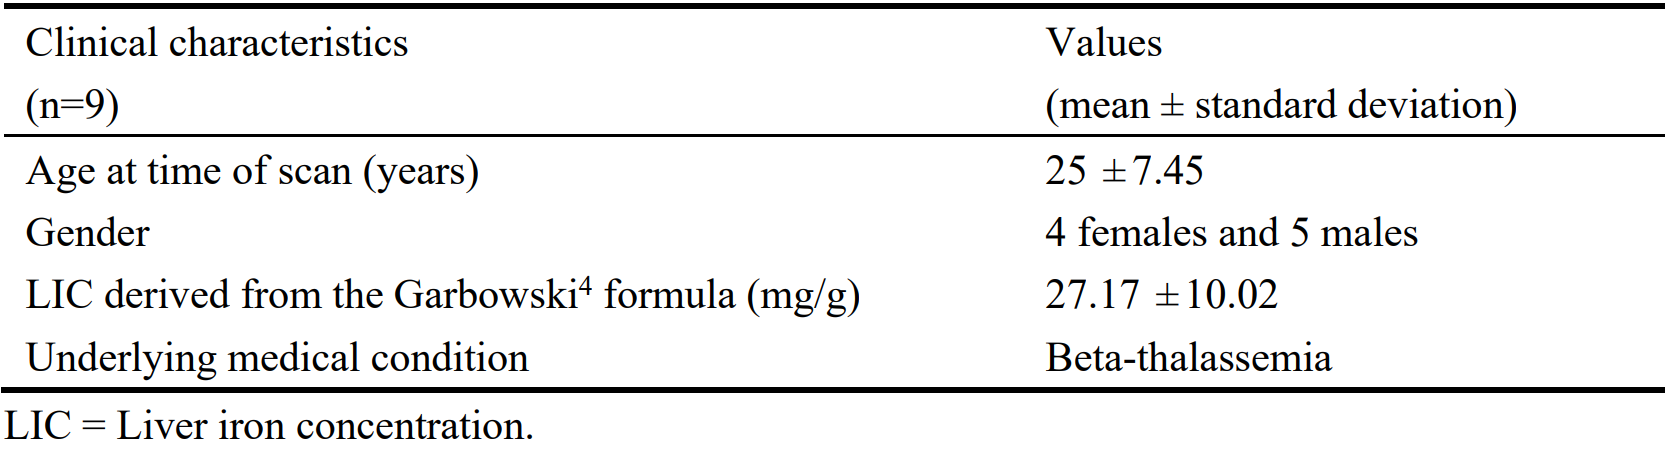
This study recruited nine patients with transfusion-dependent thalassemia from the First Affiliated Hospital of Guangxi Medical University (Table 1). Seven of these patients had their liver iron concentration (LIC) assessed through FDA-cleared Ferriscan examination (Ferriscan-LIC). The study was approved by the ethics committee, and all patients provided informed consent prior to participation.For each patient, images of 1.5T 3D ME-GRE sequence and 3.0T 3D UTE sequence scans were acquired to measure the liver R2* values. The key parameters for the 1.5T ME-GRE sequence were as follows: breath-hold scan, TE=1.33-13.55ms, TR=200.00ms, slice thickness=10mm, and an in-plane resolution of 3.1×3.1mm. The 3.0T UTE sequence was scanned 6 times, each with a different echo time: 0.036ms, 0.2ms, 0.4ms, 0.6ms, 0.8ms, and 1.00ms. A respiratory-triggered approach was used for the free-breathing scan. The main parameters for the 3D UTE sequence were: an in-plane resolution of 3.1×3.1mm; 3mm slice thickness; total Scan time of 8min52s.
R2* images from 1.5T ME-GRE sequence were automatically reconstructed by the scanner (GRE-R2*). R2* images from 3.0T UTE sequence were reconstructed offline as follows: (1) Given that UTE images at various echo times were captured within a comparable respiratory phase, due to the implementation of a respiratory-triggered method, a rigid coregistration algorithm from the Elastix software3 was utilized to conduct motion correction on the UTE images. (2) The signal intensity of each voxel in UTE images was fitted to a monoexponential decay model using a least-squares fit method to generate R2* maps (UTE-R2*). The ROIs in liver were delineated by an experienced radiologist. The Pearson correlation analysis method was used to analyze the correlation between liver UTE-R2* and GRE-R2*, as well as the correlation between UTE-R2* and Ferriscan-LIC.
Results
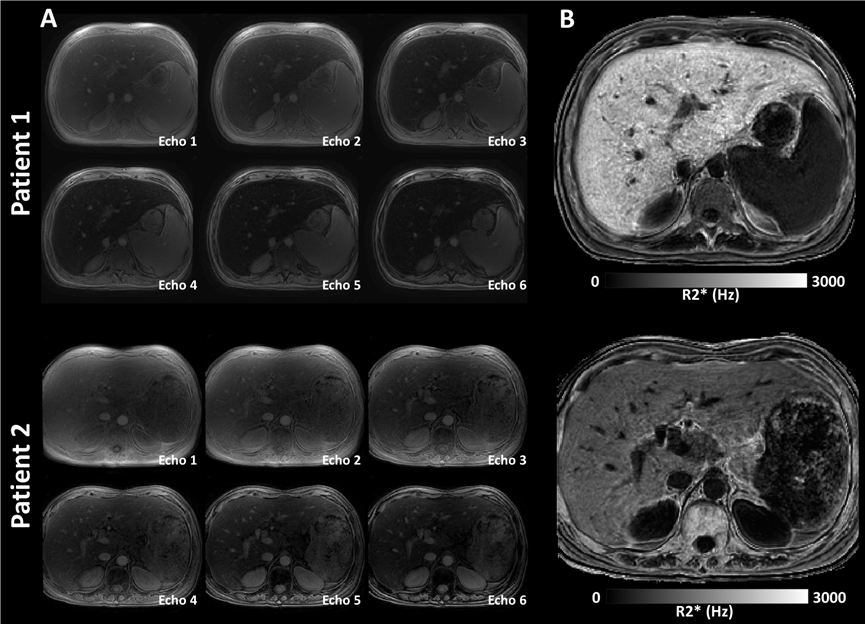
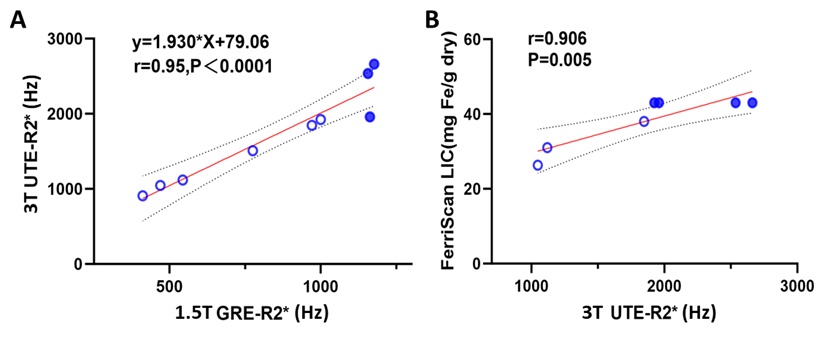
Fig. 1 displays the UTE images of two patients at different echoes, as well as the corresponding R2* images. The UTE images of different echo time achieved proper alignment after the rigid motion correction. Fig. 2 showed a significant correlation between the UTE-R2* and the GRE-R2*(r=0.95,P<0.0001); additionally, there was a significant correlation between the UTE-R2* and the Ferriscan-LIC (r=0.91,P<0.005). It should be noticed that UTE-R2* was capable of differentiating varying hepatic iron content in patients whose GRE-R2* or Ferriscan-LIC have reached their upper measurement limits (solid blue circles in Fig. 2).Discussion
In the present study, our results showed a significant correlation between UTE-R2* and both GRE-R2* and Ferriscan-LIC for patients with moderate to severe hepatic iron deposition. Furthermore, for patients with extreme hepatic iron overload, where GRE-R2* and Ferriscan-LIC have reached their measurement limits, UTE-R2* still distinguishes different liver R2*. This suggests that a single-echo UTE sequence, employing multiple acquisitions with varying echo times, is a viable method for assessing R2* in extreme hepatic iron deposition. Additionally, since the lowest TE limit for a single-echo UTE sequence is 0.036ms, an imaging strategy with arbitrary echo intervals can be designed to evaluate varying degrees of hepatic iron deposition. Additionally, the respiratory-triggered acquisition approach, combined with rigid-based motion correction techniques, facilitates the acquisition of well-aligned multi-echo UTE hepatic images, potentially improving the clinical utility of this method.Conclusions
The free-breathing single-echo UTE sequence, designed for multiple acquisitions with each acquisition utilizing a different echo time, can reliably assess extremely high hepatic iron loads and offers a broader range of liver iron deposition assessment compared to Ferriscan.Acknowledgements
No acknowledgement found.References
1. Wood, John C. “Cardiac iron across different transfusion-dependent diseases.” Blood reviews vol. 22 Suppl 2, Suppl 2 (2008): S14-21. doi:10.1016/S0268-960X (08)70004-3
2. Kee, Youngwook et al. “Free-breathing R2∗ mapping of hepatic iron overload in children using 3D multi-echo UTE cones MRI.” Magnetic resonance in medicine vol. 85,5 (2021): 2608-2621. doi:10.1002/mrm.28610
3. Klein, Stefan et al. “elastix: a toolbox for intensity-based medical image registration.” IEEE transactions on medical imaging vol. 29,1 (2010): 196-205. doi:10.1109/TMI.2009.2035616
4. Henninger, Benjamin et al. “Practical guide to quantification of hepatic iron with MRI.” European radiology vol. 30,1 (2020): 383-393. doi:10.1007/s00330-019-06380-9
Figures