0839
Influence of hepatic steatosis on T1 values of the liver: Comparison of T1 mappings at different echo times1Department of Radiology, Yamaguchi University Graduate School of Medicine, Ube, Japan
Synopsis
Keywords: Liver, Liver, T1 mapping, hepatic steatosis
Motivation: In evaluating T1 values in patients with hepatic steatosis, it is necessary to investigate the effect of fat because MOLLI is sensitive to fat.
Goal(s): To elucidate the clinical importance of MOLLI T1 mapping of the liver using TE=1.8 (AIOP) sequence in daily practice.
Approach: In 122 patients with suspected liver diseases, MOLLI T1 mapping with TE=1.8 (AIOP) was compared with that with TE=1.3 (OP) and TE=2.4 (IP).
Results: The positive correlation with high correlation coefficient between T1 value of the liver in AIOP sequence and FIB-4 score was observed in patients with hepatic steatosis (PDFF ≥10%).
Impact: T1 mapping using AIOP sequence will be critical for assessing liver fibrosis in patients with hepatic steatosis since T1 mapping obtained by OP and IP sequences have risk of over- and under-estimation of T1 measurements.
Introduction
T1 values of the liver on MR imaging has been shown to be useful for the noninvasive assessment of hepatic fibrosis. Previous studies have indicated that T1 mapping has potential to be a valuable tool for differentiating healthy subjects from patients with liver cirrhosis 1,2. Although fibrosis increases the T1 values in the liver, fat tissue also leads to increased T1 values of the liver on T1 mapping obtained via the Look-Locker opposed-phase-based sequence 3. Therefore, in order to use T1 values in the evaluation of patients with hepatic lipidosis, it is necessary to investigate the effect of fat.A modified Look-Locker inversion recovery (MOLLI) sequence requires only one short breath hold per slice and also has a high technical success rate. Therefore, MOLLI T1 mapping can be easily incorporated into standard abdominal MRI protocols to provide quantitative T1 assessment. However, care must be taken when selecting imaging parameters because MOLLI is sensitive to fat. A recent study reported that MOLLI T1 mapping using TE=1.8 ms at 3T MRI could reduce T1 bias and obtained stable T1 values when fat fraction was less than 30% 4. However, this study included only normal volunteers. Therefore, the purpose of this study was to elucidate the clinical importance of MOLLI T1 mapping of the liver using TE=1.8 sequence in daily practice.
Methods
This retrospective study included 122 patients (mean age 69.3±12.4 years, 34 women) with suspected liver diseases. All patients underwent abdominal MR imaging including T1 mapping and proton density fat fraction (PDFF) on 3T MRI system (Vantage Centurian, Canon Medical Systems) with a 16-channel body coil.A modified Look-Locker inversion recovery (MOLLI) method was used to obtain T1 mapping with TE=1.3 (opposed-phase: OP), 2.4 (in-phase: IP), and 1.8 (average of IP and OP: AIOP) ms for comparison. PDFF map was obtained by six-point Dixon imaging to calculate the adiposity (%) of the liver. Three regions of interest (ROIs) were placed in the liver on each T1 and PDFF map image to measure the T1 value and PDFF. The fibrosis-4 (FIB-4) score was used as a screening tool to detect significant liver fibrosis.
Quantitative analyses among T1 values of the liver obtained by IP, OP and AIOP sequences were performed using Friedman test followed by Bonferroni-adjusted Dunn test for post hoc analysis. The correlations between the T1 value and PDFF or FIB-4 score were evaluated using Spearman's rank correlation coefficient analysis.
Results
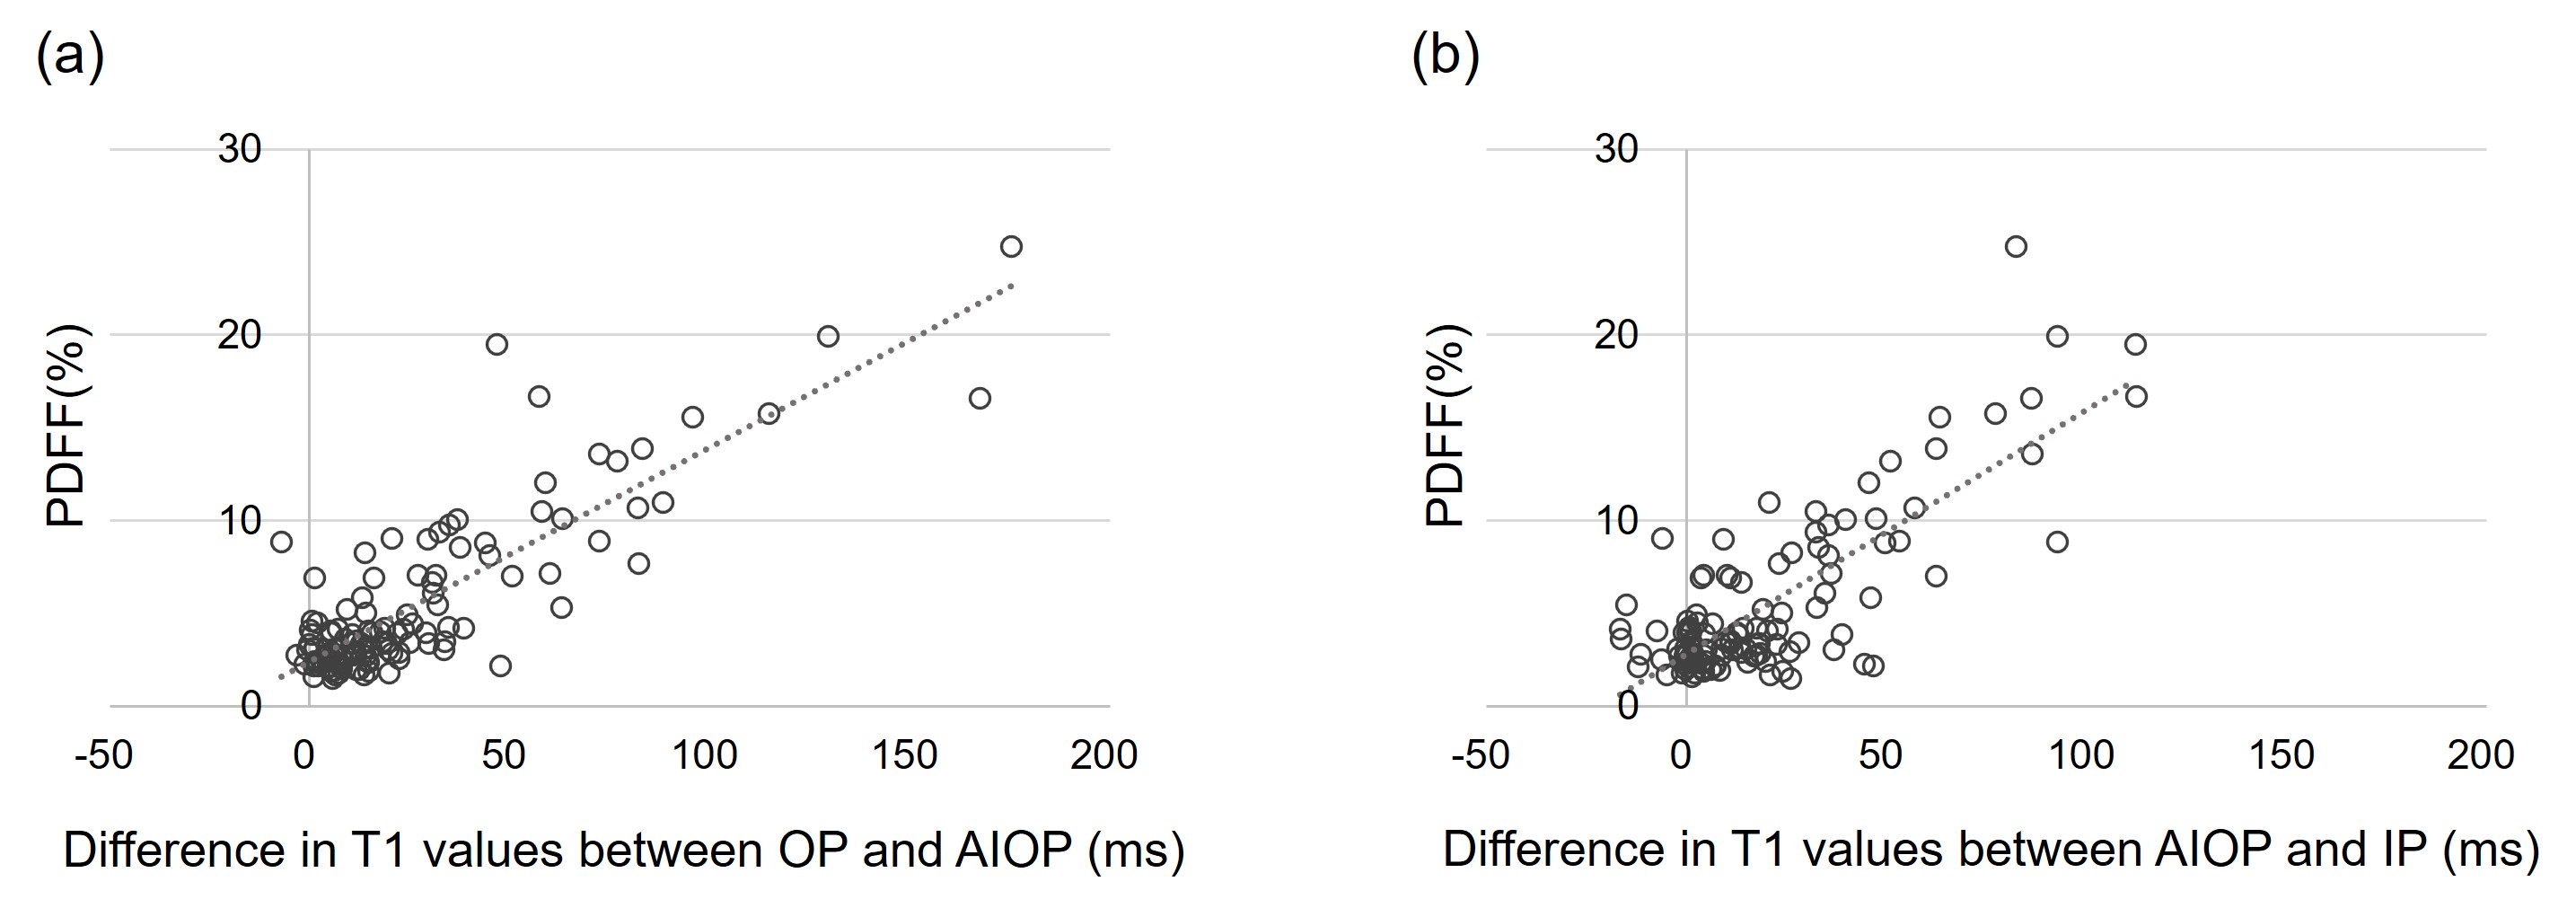
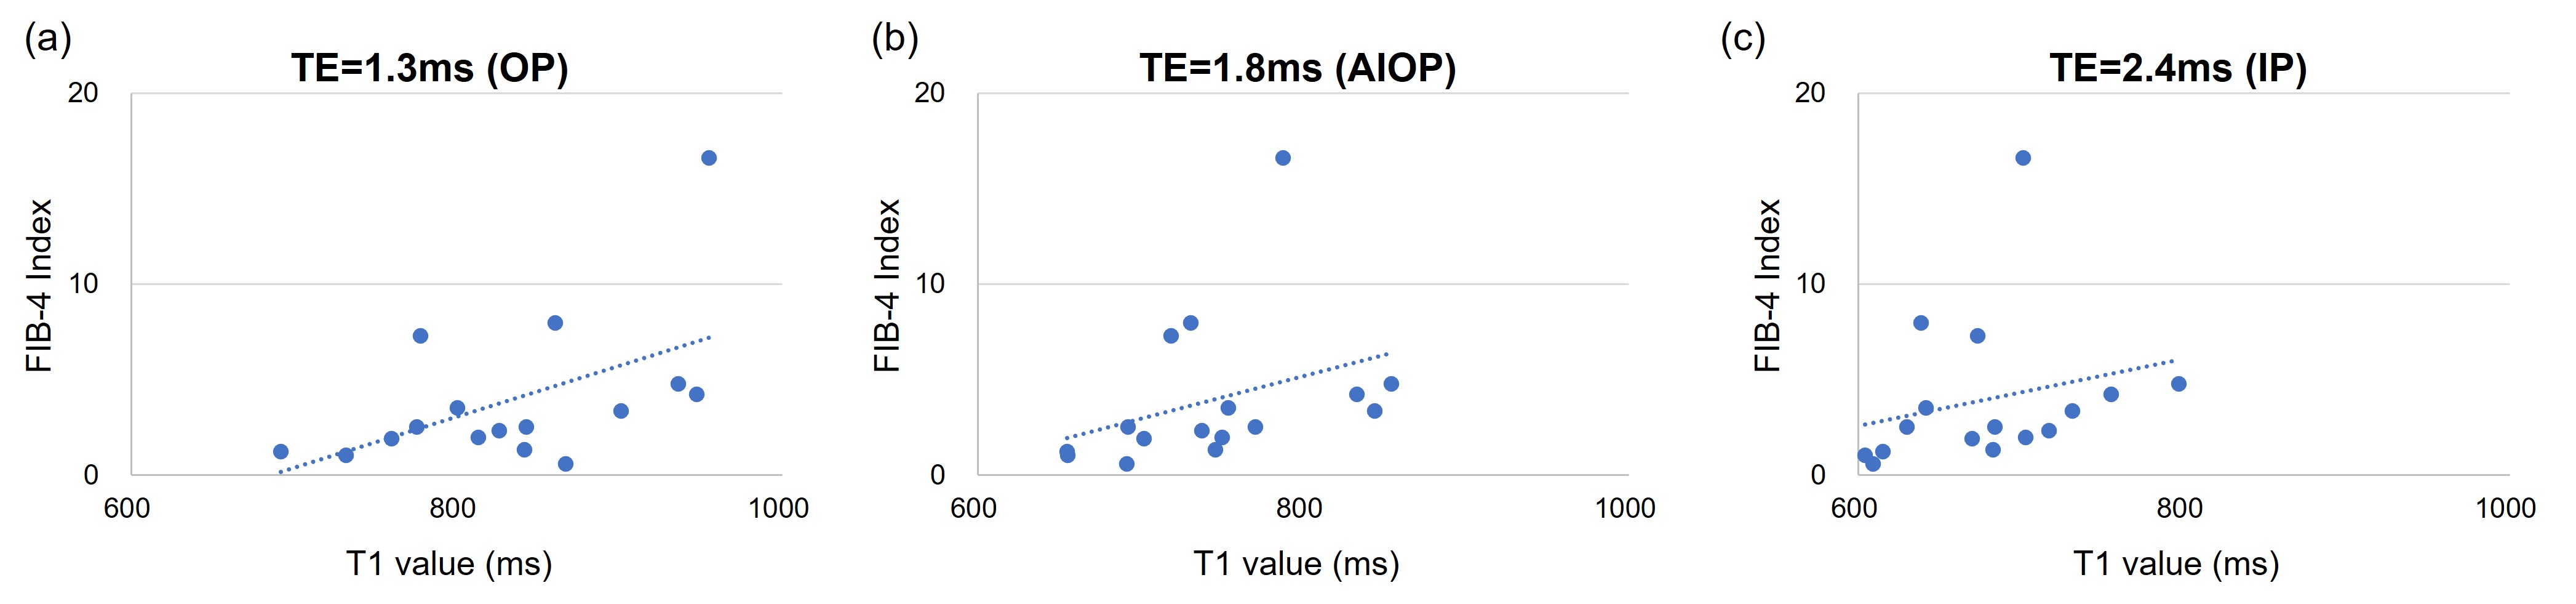
The mean T1 values of the liver on the OP images (747.8±97.9 ms) were significantly higher than those on the AIOP images (721.9±88.7 ms) (p<0.001), while the mean T1 values on the IP images (702.4±84.1 ms) were significantly lower than those on the AIOP images (p<0.001). The difference between T1 values of the liver on AIOP images and that on OP images showed a significant positive correlation with PDFF (r=0.660; p<0.001). The difference between T1 values of the liver on AIOP images and that on IP images also showed a significant positive correlation with PDFF (r=0.544; p<0.001). In 16 cases with PDFF ≥10%, there was a positive correlation between T1 value of the liver and FIB-4 score, with a particularly high correlation coefficient in AIOP (r=0.621, p=0.010), followed by OP (r=0.530, p=0.035) and IP (r=0.492, p=0.053) sequences. Meanwhile, in 106 cases with PDFF less than 10%, there was a weak positive correlation between T1 value of the liver and FIB-4 score (OP, r=0.174, p=0.075; AIOP, r=0.212, p=0.029; IP, r=0.215, p=0.027).Discussion
This study showed the positive correlation with high correlation coefficient between T1 value of the liver in AIOP sequence and FIB-4 score in patients with hepatic steatosis (PDFF ≥10%), possibly due to liver fibrosis stimulated by hepatic steatosis including non-alcoholic steatohepatitis. This result suggested that AIOP T1 mapping will be critical for assessing liver fibrosis in patients with hepatic steatosis since T1 mapping obtained by OP and IP sequences have risk of over- and under-estimation of T1 measurements.Conclusions
In patients with hepatic steatosis, measured T1 values were over- and under-estimated in T1 mapping obtained by OP and IP sequences, possibly affecting the evaluation of hepatic fibrosis. Conversely, T1 values of the liver obtained from MOLLI T1 mapping using TE=1.8, the average of IP and OP (AIOP), were less affected by fat deposition than T1 values obtained from OP- or IP-based sequence, and showed positive correlation with FIB-4 score in patients with PDFF ≥10%. Therefore, in the measurement of T1 values in patients with liver steatosis, it is essential to use AIOP T1 mapping protocol for evaluating hepatic fibrosis.Acknowledgements
No acknowledgement found.References
1. Cassinotto C, Feldis M, Vergniol J, et al. MR relaxometry in chronic liver diseases: Comparison of T1 mapping, T2 mapping, and diffusion-weighted imaging for assessing cirrhosis diagnosis and severity. European journal of radiology 2015;84(8):1459-1465.
2. Heye T, Yang SR, Bock M, et al. MR relaxometry of the liver: significant elevation of T1 relaxation time in patients with liver cirrhosis. European radiology 2012;22(6):1224-1232.
3. Higashi M, Tanabe M, Yamane M, et al. Impact of fat on the apparent T1 value of the liver: assessment by water-only derived T1 mapping. European radiology 2023;33(10):6844-6851.
4. Liu CY, Noda C, Ambale-Venkatesh B, Kassai Y, Bluemke D, Lima JAC. Evaluation of liver T1 using MOLLI gradient echo readout under the influence of fat. Magnetic resonance imaging 2022;85:57-63.
Figures