0838
Simultaneous Water-Specific T1 and Fat Fraction Mapping of the Liver using Look-Locker Dixon MRI1Philips, Cincinnati, OH, United States, 2Radiology, Cincinnati Children's Hospital Medical Center, Cincinnati, OH, United States
Synopsis
Keywords: Liver, Quantitative Imaging
Motivation: Hepatic tissue architecture and water-fat content change concurrently with liver disease progression. Simultaneous measurement of water-specific T1 (T1-W) and proton density fat fraction (PDFF) can serve as a quantitative metric for assessment of liver disease.
Goal(s): To develop and validate a Look-Locker multi-echo Dixon (LLmDIXON) technique to simultaneously measure T1-W and PDFF in a single breath-hold.
Approach: Simultaneous T1-W and PDFF measurements were obtained using LLmDIXON and reference sequences in a phantom (0-40 % PDFF) and four volunteers (4.0-18.2% PDFF).
Results: The LLmDixon-based T1-W and PDFF values agreed with simulations and reference sequences in a phantom, and provided comparable PDFF values in volunteers.
Impact: LLmDixon provides simultaneous measurement of water-specific T1 and PDFF in a single 15s breath hold. This technique has the potential to characterize liver disease, where both cellular architecture and fat content can concurrently change as disease progresses.
Introduction
Liver T1 has been shown to correlate with fibrosis and inflammation, and is considered a potential biomarker in assessment of liver disease1,2. However, fat confounds T1 measurements, especially with fast gradient echo based T1 mapping techniques (e.g. MOLLI) introducing significant T1 bias depending on the fat fraction (FF%)3–5. Given that both tissue architecture and water-fat content both change concurrently with liver disease progression, there is a need to minimize the influence of fat to measure water-specific liver T1 (T1-W), especially in patients with elevated liver FF%.In this study, a Look-Locker (LL) inversion recovery sampling scheme was combined with a 6-echo Dixon technique (LLmDIXON) to enable separation of fat and water components prior to T1 fitting. A single breath-hold LLmDIXON technique was validated in a phantom, compared with simulations, and demonstrated in volunteers.
Methods
The LLmDixon technique was implemented on a 1.5T Philips Ingenia scanner. A fat-fraction phantom (Model 100, Calimetrix) and four volunteers were scanned with consent and IRB approval.Twelve 2D 6-echo Dixon acquisitions (mDixon Quant®) were spaced equally across 3000ms following an inversion pulse, providing water (W), fat (F), in-phase (IP), out-of-phase (OP), and fat fraction (FF%) images at each inversion time for T1 mapping. Other sequence parameters were: flip angle=5°, TE/ ΔTE/TR=1.3ms/1ms/7.7ms, TFE factor=11, resolution=3x3x15mm. In volunteers, images were acquired through the mid-liver with FOV=420x325mm, SENSE=2 during a 15 second breath hold.
Separate LL-TFE acquisitions with IP/OP TEs of 2.2/4.4ms were used to estimate T1-IP/T1-OP, and T1-W was estimated using a spin-echo inversion recovery with fat saturation (FS-SE). Numerical simulations of LL-TFE IP and OP were performed in MATLAB to model the impact of FF% on the measured T1. A commercial mDixon Quant acquisition was used to validate FF% in phantom and volunteers.
Results
LLmDIXON images (IP, OP, water, fat, PDFF) of the phantom and corresponding T1 maps in the phantom are shown in Figure 1. Figure 2A shows the plots of T1s calculated using LLmDIXON and corresponding T1 values using LL-TFE-IP, LL-TFE-OP, and FS-SE. There was a very strong correlation (r>0.9) with less than 5% bias between LLmDixon and corresponding values. Figure 2B shows the difference between T1 values with respect to FS-SE. Both LL-TFE and LLmDixon showed increasing error with PDFF (T1-IP underestimation of 0.6%/PDFF%, T1-OP overestimation of 1.4%/PDFF %) while LLmDIXON had negligible error of 0.1%/PDFF %. There was statistically significant (p<0.05) but clinically negligible (<1%) difference between the mDixon Quant FF% and the last inversion time LLmDixon FF% (Figure 2C).The four study participants ranged from 32-48 years (1 female), with PDFF ranging from 4.0-18.2%. Figure 3 shows LLmDixon maps in two volunteers with FF% of 5.0% and 18.2%. In the subject with FF=5.0%, T1-IP, T1-OP, and T1-W were similar, while these T1 values varied considerably in the subject with FF=18.2%.
Figure 4 shows LLmDixon T1 values across all subjects, which exhibited a similar trend to the phantom (Fig. 2). There was a statistically significant (p<0.05) but clinically negligible difference (bias of -1.1 %) between LLmDixon FF% and mDixon Quant FF% in volunteers, with a proportional bias of -0.1%/FF% to mDixon Quant (Figure 4C).
Discussion
The LLmDixon technique provides inherently registered IP, OP, W, F images, corresponding T1 maps, and PDFF maps in a single 15 second breath-hold.In the phantom, LLmDixon T1-IP and T1-OP values were comparable to standard TFE with IP/OP TEs, which agreed with numerical simulations. LLmDixon T1-W values were also comparable to FS-SE T1 values. LLmDixon T1 maps in volunteers demonstrated similar trends with increasing FF%, and showed the significant error that can occur with fast gradient echo T1 mapping techniques. The small number of volunteers is a limitation of this study, though they exhibited a moderate range of PDFF encountered in patients.
LLmDixon inversion times were selected to avoid the low SNR at the null point of the liver. However, there is still potential for Dixon water-fat separation to fail with this technique, leading to T1 fitting error. There was also a bias between LLmDixon and mDixon Quant FF% despite FF% being measured from the last inversion time to allow adequate recovery. Further optimization of the LL sampling times may improve both T1 and FF% estimation with this technique.
Conclusion
A single breath-hold (15s) LLmDIXON acquisition provides T1-W and PDFF maps for the assessment of liver disease in terms of water-fat content and cellular architectural changes. The values obtained in phantom agreed with reference techniques. LLmDixon could potentially enable in-depth evaluation of the effects of fat, inflammation, and fibrosis on liver T1.Acknowledgements
No acknowledgement found.References
1. Schaapman, J. J., Tushuizen, M. E., Coenraad, M. J. & Lamb, H. J. Multiparametric MRI in Patients With Nonalcoholic Fatty Liver Disease. J. Magn. Reson. Imaging 53, 1623–1631 (2021).
2. Banerjee, R. et al. Multiparametric magnetic resonance for the non-invasive diagnosis of liver disease. J. Hepatol. 60, 69–77 (2014).
3. Mozes, F. E., Tunnicliffe, E. M., Pavlides, M. & Robson, M. D. Influence of fat on liver T 1 measurements using modified Look–Locker inversion recovery (MOLLI) methods at 3T. J. Magn. Reson. Imaging 44, 105–111 (2016).
4. Kellman, P. et al. Characterization of myocardial T1-mapping bias caused by intramyocardial fat in inversion recovery and saturation recovery techniques. J. Cardiovasc. Magn. Reson. 17, 33 (2015).
5. Ahn, J.-H. et al. Effect of hepatic steatosis on native T1 mapping of 3T magnetic resonance imaging in the assessment of T1 values for patients with non-alcoholic fatty liver disease. Magn. Reson. Imaging 80, 1–8 (2021).
Figures
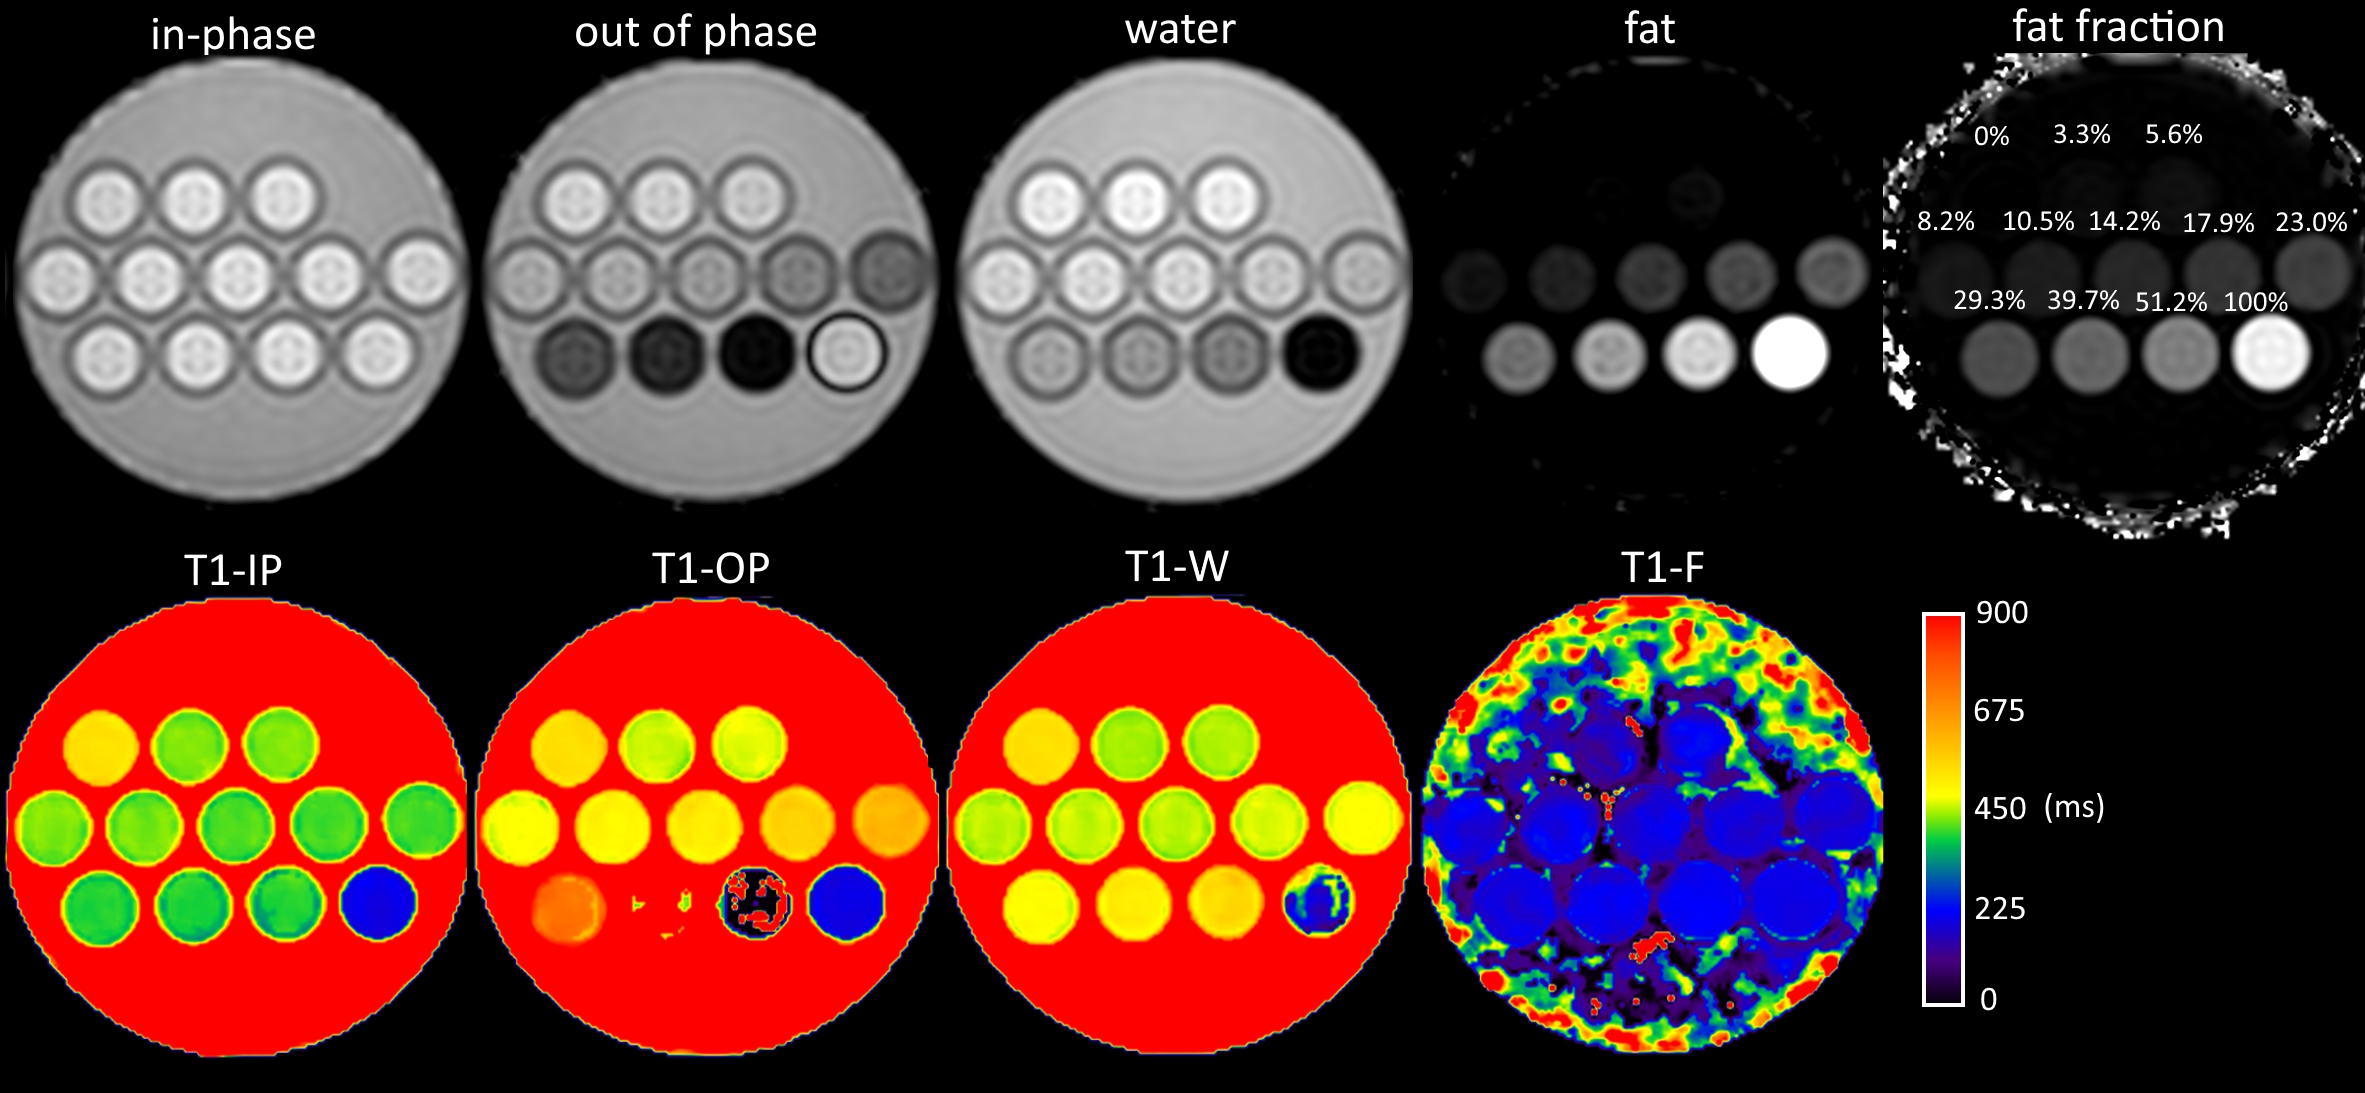
The top row shows calculated LLmDixon images from the last inversion time (TI = 3000 ms) in the PDFF phantom, with calibrated fat fraction values from the phantom manufacturer overlaid on the fat fraction map. The T1 maps resulting from curve fitting each calculated image series are shown in the bottom row. As PDFF increases in the second and third rows of phantom vials, T1-IP and T1-OP deviate further from T1-W in opposite directions, in agreement with simulation3,4 (see Figure 2A).
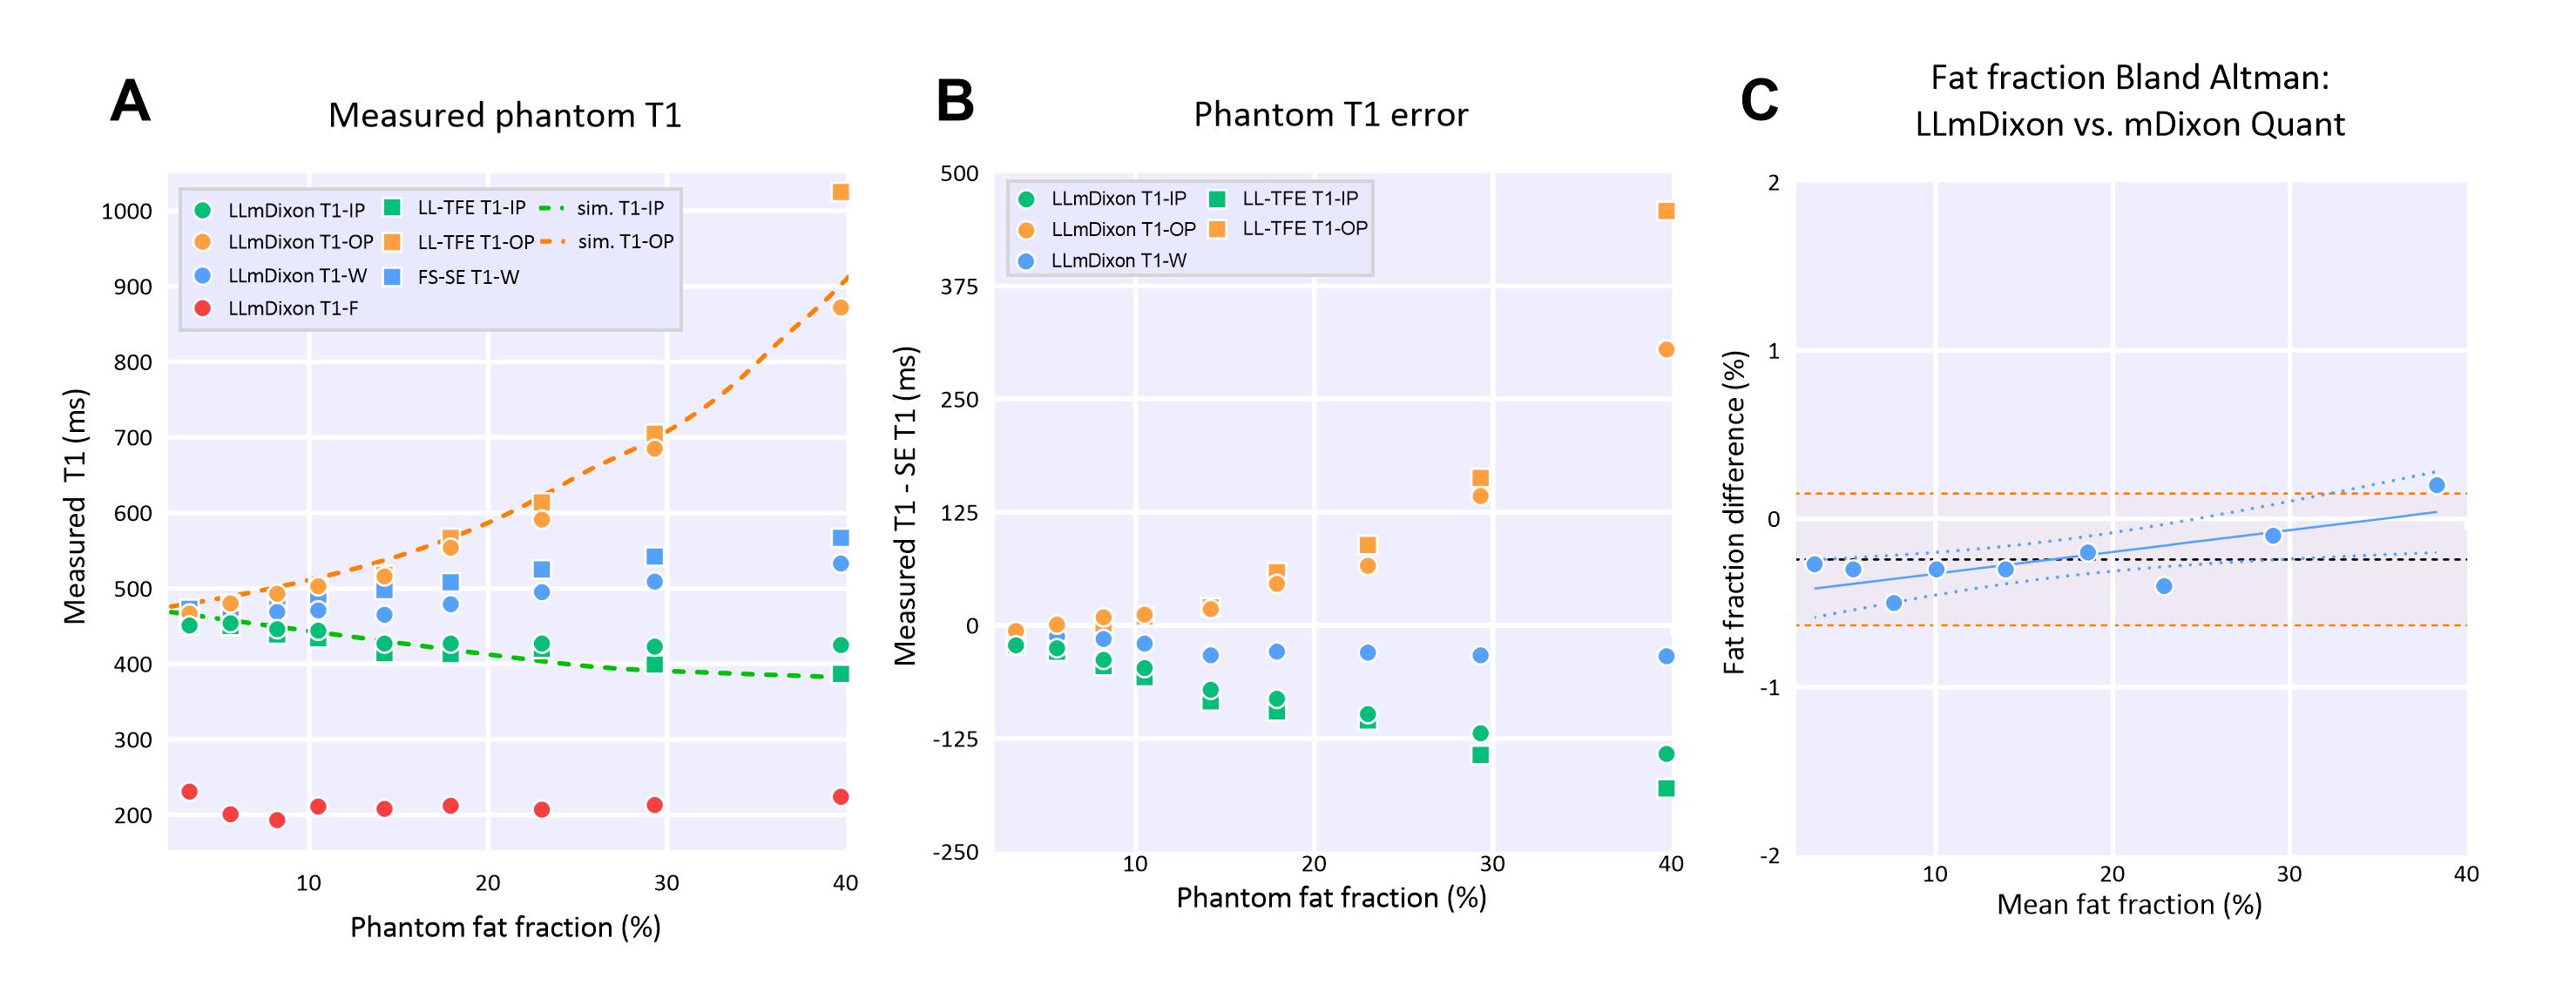
T1 measurements in the phantom (A), with T1-IP decreasing and T1-OP increasing with FF%, in agreement with simulations (dotted lines). (B) shows the difference between measured T1s and FS-SE (T1-W), with both LLmDixon and LL-TFE showing similar degrees of error, while LLmDixon provides similar T1-W values as FS-SE. (C) shows Bland-altman analysis of FF% measured by LLmDixon (last phase, TI = 3000 ms) and mDixon Quant in the phantom. There was a mean bias of -0.24% (95% limits of agreement: [-0.63, 0.15], orange lines), with proportional bias of 0.01%/FF% (blue line).
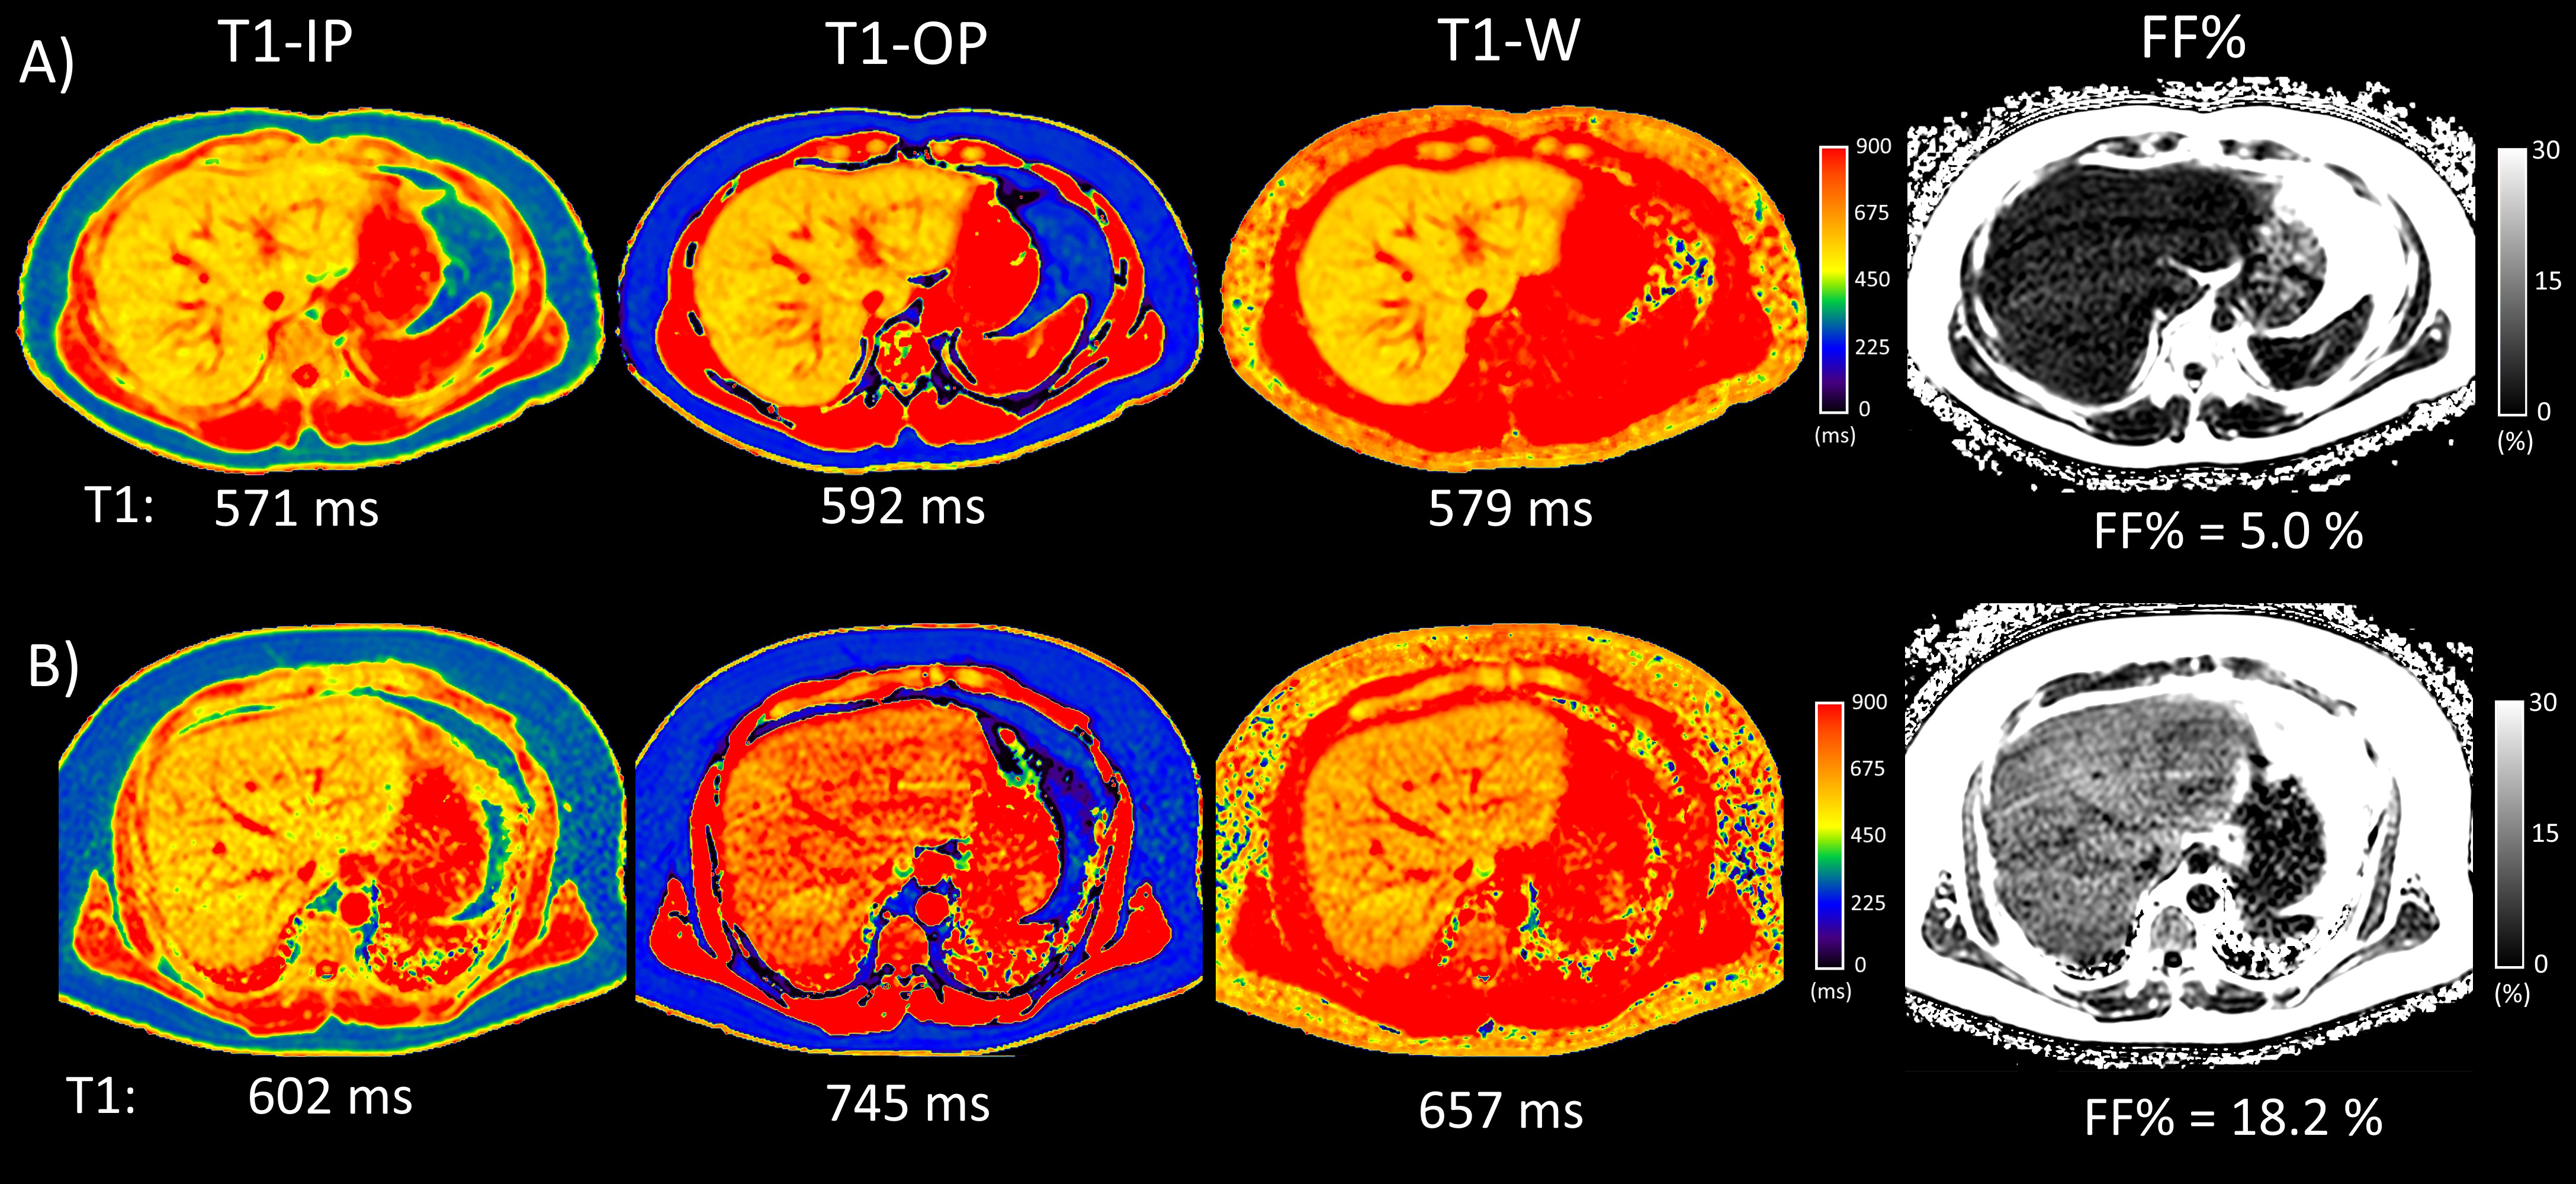
LLmDixon T1 and FF% maps in two volunteers with different average FF% values. (A) shows a subject with FF% = 5.0%, with T1-IP/T1-OP/T1-W providing similar values of 571/592/579 ms. (B) shows a subject with elevated FF% of 18.2%, with T1-IP/T1-OP/T1-W resulting in drastically different T1s of 602/745/657 ms.
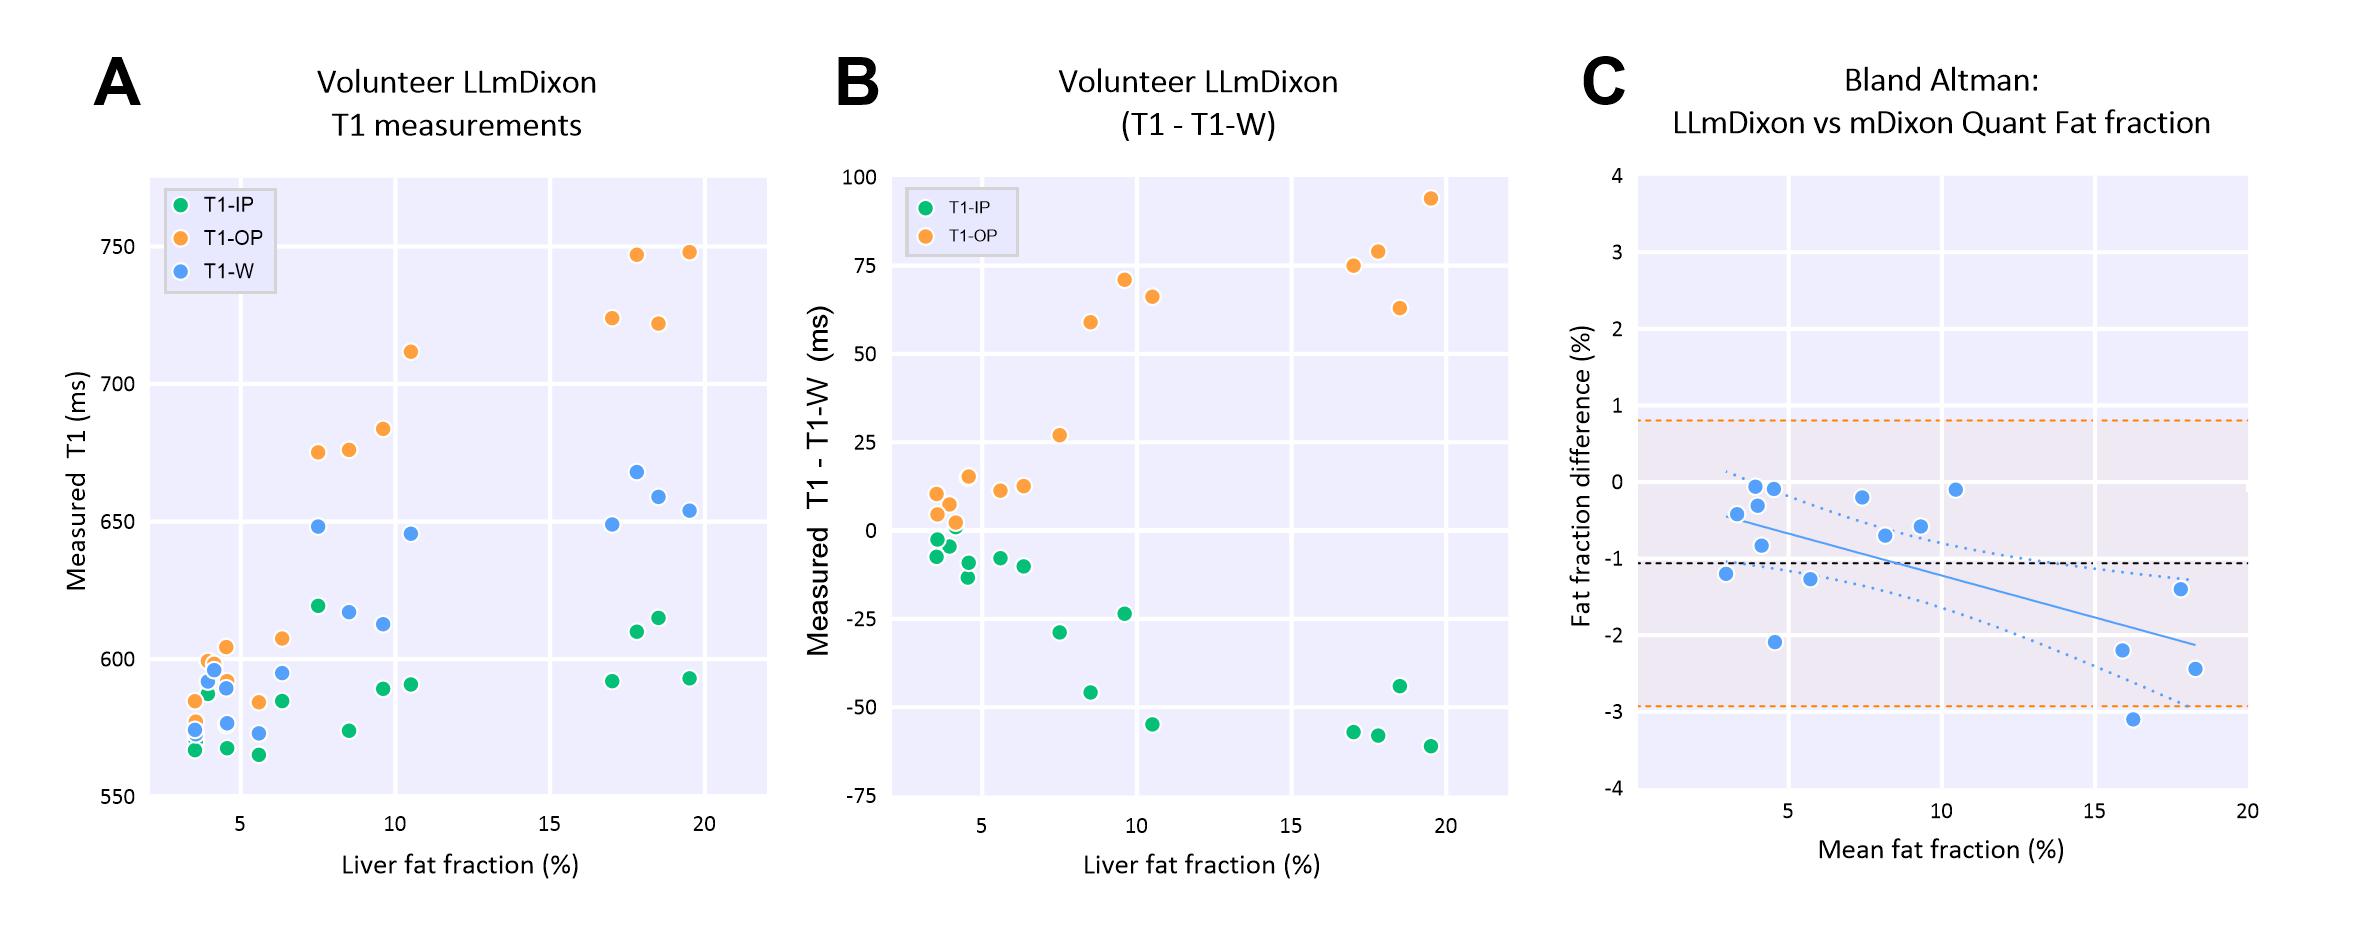
Measured LLmDixon T1 values for all volunteers (A), with 4 regions of interests drawn across the liver per subject. (B) shows the difference between T1-IP/T1-OP with respect to T1-W measured with LLmDixon. (C) shows Bland-altman plot of FF% measured by LLmDixon (last phase, TI = 3000 ms) and a standard mDixon Quant acquisition in the volunteers.