0837
Liver T1 Mapping in a Large Cohort of Healthy Subjects: Normal Ranges and Correlation with Age and Sex1Fondazione G. Monasterio CNR-Regione Toscana, Pisa, Italy, 2University of Ferrara, Ferrara, Italy, 3University of Padua, Padova, Italy
Synopsis
Keywords: Liver, Tissue Characterization, normal values
Motivation: To fully exploit the clinical potential of T1 mapping in liver disease detection, normal values should be established.
Goal(s): We defined normal ranges for native hepatic T1 values using a 1.5T General Electric scanner.
Approach: MOLLI sequences were acquired in 100 healthy volunteers and native T1 values were quantified in the visible hepatic segments.
Results: Segmental and global liver T1 values exhibited a good intra- and inter-observer reproducibility. A significant difference in the segmental T1 values was detected. Segmental and global T1 values were not associated with age and were comparable between males and females.
Impact: Liver T1 mapping is feasible and reproducible and the provided normal ranges may help to establish diagnosis and progression of various liver diseases.
Introduction
In light of the diagnostic value of T1 mapping in cardiac magnetic resonance (CMR) and the non-invasive nature of this techniques 1-3, interest has expanded to other organs besides the heart. T1 mapping has been successfully employed for the detection and grading of steatosis and fibrosis in non-alcoholic fatty liver disease and cirrhosis in clinical studies 4-6. To fully exploit the clinical potential of T1 mapping in liver disease detection, it is paramount to establish a range of normal values and to detect the potential influencing factors.Aims
We established normal ranges for native T1 values in the human liver using a 1.5T General Electric scanner. Moreover, the variations of T1 values across liver segments and the association with age and sex were assessed.Methods
A retrospective analysis of CMR images from a large cohort of healthy volunteers was performed. One-hundred healthy volunteers aged 20-70years (mean age:44.7±14.2years; 50% females) were included in this study. Modified Look-Locker inversion recovery sequences (basal, medium and apical short-axis views of the left ventricle) were acquired 7. The left lobe of the liver was mostly included in the field of view of acquisition. On the generated pixelwise T1 maps, polygonal regions of interest (ROI) were drawn in the visible and detectable functionally independent segments of the liver, according to the Couinaud segmentation 8.Results
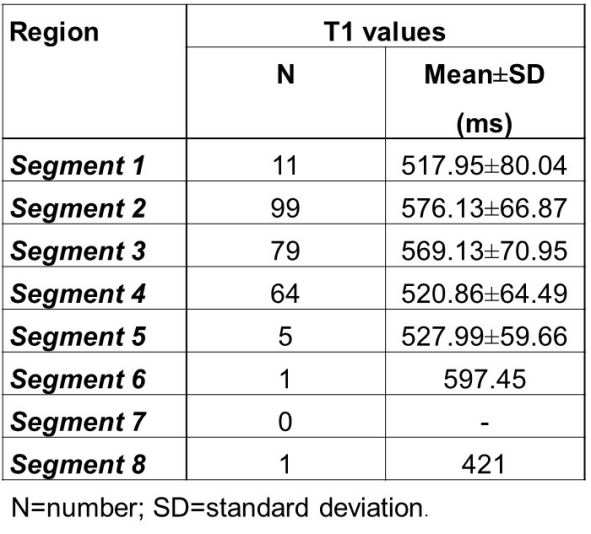
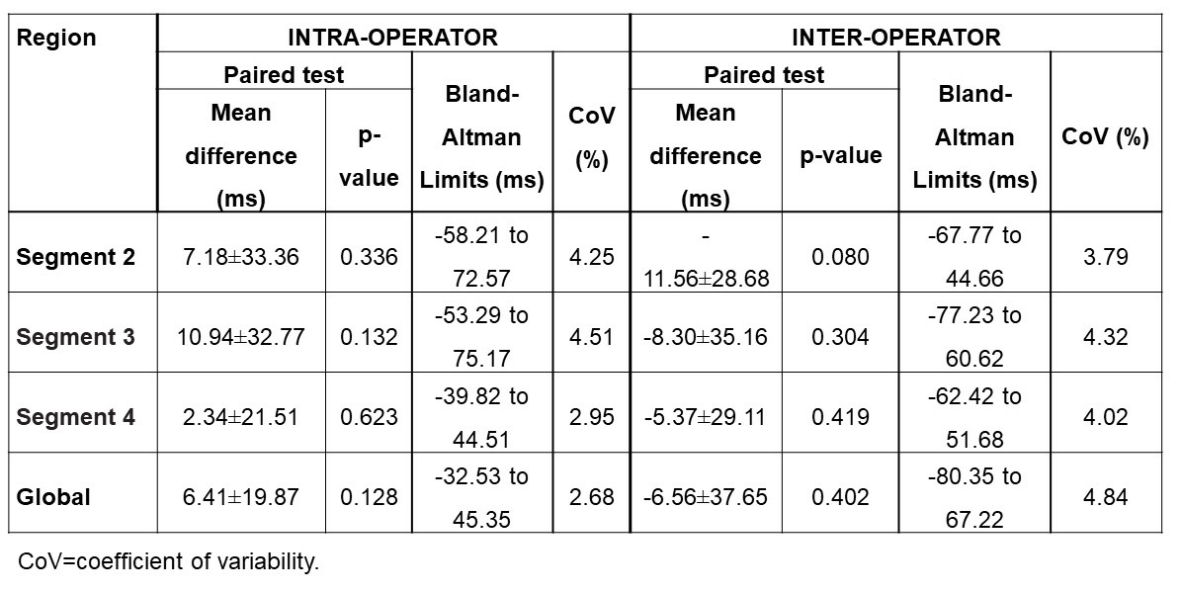
The caudate lobe (segment 1) was measurable in a small minority of cases. In the right liver, segments 5 (anteroinferior), 6 (posteroinferior), and 8 (anterosuperior) were measurable in 1–5% of the healthy subjects, while segment 7 (posterosuperior) was not visible in any subject. In all participants there was at least one segment in the left hepatic lobe with good diagnostic image quality (Table 1). Therefore, segments 2 (left lateral superior), 3 (left lateral inferior), and 4 (left medial) were considered.The global liver T1 value was calculated as the mean of T1 values from the three regions. Intra- and inter-observer variability for hepatic T1 values were low (Table 2), with coefficient of variability always <5%. The Bland-Altman analysis showed no systematic differences between assessments.
For 48 healthy subjects it was possible to simultaneously measure native T1 values in segments 2, 3, and 4. A significant difference in the segmental T1 values was detected (p<0.0001). Specifically, the mean T1 value over segment 4 was significantly lower than the mean T1 values over segment 2 (522.20±55.76ms vs. 562.60±62.19ms; p<0.0001) and segment 3 (522.20±55.76ms vs. 553.08±61.77ms; p<0.0001). A significant correlation was found between T1 values in segments 2 and 3 (R=0.780; p<0.0001), segments 2 and 4 (R=0.637; p<0.0001), and segments 3 and 4 (R=0.712; p<0.0001).
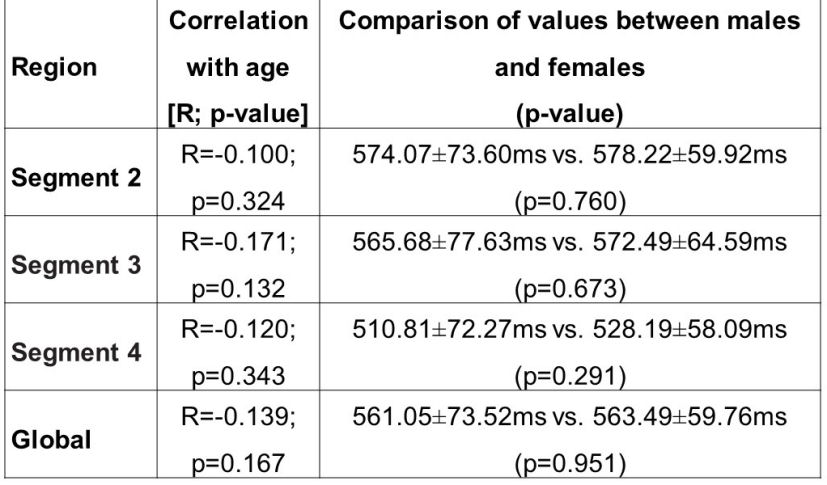
Segmental and global T1 values were not associated with age and were comparable between males and females (Table 3).
The lower and upper limits of normal T1 were, respectively, 442ms and 710ms for segment 2, 446ms and 716ms for segment 3, and 446 and 716ms for segment 4. The lower and upper limits of normal for global T1 values were, respectively, 442ms and 705ms.
Conclusions
Our study provides valuable information on the normal range of liver T1 relaxation times in healthy adults, which may serve as a basis for future studies involving patients with different conditions/diseases altering T1 values.Acknowledgements
We thank all subjects for their cooperationReferences
1. Messroghli DR, Moon JC, Ferreira VM, et al. Clinical recommendations for cardiovascular magnetic resonance mapping of T1, T2, T2* and extracellular volume: A consensus statement by the Society for Cardiovascular Magnetic Resonance (SCMR) endorsed by the European Association for Cardiovascular Imaging (EACVI). J Cardiovasc Magn Reson. 2017;19(1):75.
2. O’Brien AT, Gil KE, Varghese J, Simonetti OP, Zareba KM. T2 mapping in myocardial disease: a comprehensive review. J Cardiovasc Magn Reson. 2022;24(1):33.
3. Tonet E, Baggiano A, Pavasini R, et al. Current evidence on the diagnostic and prognostic role of native T1 mapping in heart diseases. Trends Cardiovasc Med. 2021;31(7):448-454.
4. Banerjee R, Pavlides M, Tunnicliffe EM, et al. Multiparametric magnetic resonance for the non-invasive diagnosis of liver disease. J Hepatol. 2014;60(1):69-77.
5. Erden A, Kuru Oz D, Peker E, et al. MRI quantification techniques in fatty liver: the diagnostic performance of hepatic T1, T2, and stiffness measurements in relation to the proton density fat fraction. Diagn Interv Radiol. 2021;27(1):7-14.
6. Pavlides M, Banerjee R, Tunnicliffe EM, et al. Multiparametric magnetic resonance imaging for the assessment of non-alcoholic fatty liver disease severity. Liver Int. 2017;37(7):1065-1073.
7. Meloni A, Martini N, Positano V, et al. Myocardial T1 Values at 1.5 T: Normal Values for General Electric Scanners and Sex-Related Differences. J Magn Reson Imaging. 2021;54(5):1486-1500.
8. Couinaud C. [Liver lobes and segments: notes on the anatomical architecture and surgery of the liver ]. Presse Med (1893). 1954;62(33):709-712.
Figures