0836
Age dependency of abdominal fat depot volumes and proton density fat fractions in people with obesity1Department of Diagnostic and Interventional Radiology, Technical University of Munich, Munich, Germany, 2Institute of Nutritional Medicine, Technical University of Munich, Munich, Germany, 3TUM School of Computation, Information, and Technology, Technical University of Munich, Munich, Germany, 4Department of Computing, Imperial College London, London, United Kingdom, 5Else Kroener Fresenius Center for Nutritional Medicine, Technical University of Munich, Munich, Germany, 6Department of Nutritional, Food and Consumer Sciences, Fulda University of Applied Sciences, Fulda, Germany, 7Munich Institute of Biomedical Engineering, Technical University of Munich, Garching, Germany, 8Munich Data Science Institute, Technical University of Munich, Garching, Germany
Synopsis
Keywords: Endocrine, Aging, Obesity
Motivation: As cardiometabolic risk in obesity is associated with specific body composition types, we aim at deciphering age-related body composition changes in people with obesity.
Goal(s): To assess age-specific abdominal organ volume and proton density fat fraction (PDFF) in people with obesity and predict chronological age.
Approach: An nnU-Net-based automatic pipeline was used to segment abdominal organs. Machine-learning-based methods were applied to predict chronological age based on the organs' volumes and PDFF in chemical-shift encoding-based MRI.
Results: The best predictors for chronological age were increased visceral adipose tissue volume and elevated ectopic fat deposition in the paraspinal muscle, measured via proton density fat fraction.
Impact: Age-specific differences in volumes and PDFF of abdominopelvic fat depots, and ectopic fat in liver and two muscles were found in people with obesity using automated segmentation on quantitative chemical-shift encoding-based MRI scans.
Introduction
The prevalence of obesity is rising1. Specific body fat deposition patterns in obesity predispose to cardiometabolic disease2–5. While a heterogeneous distribution of abdominal fat was reported between sexes6,7, a general increase in abdominal adiposity with age was reported8,9. Abdominal organ aging effects beyond adipose tissue volume allowed a recent deep learning algorithm to predict age based on liver and pancreas MRI with a mean average error (MAE) of 2.94 years10. Such algorithms could potentially help defining biological age and assess age-dependent vulnerability to cardiometabolic disease.Chemical shift encoding-based MRI (CSE-MRI) provides water- and fat-separated images, and quantitative proton density fat fraction (PDFF) maps11, allowing for both organ volume and ectopic fat quantification. Previously, an nnU-Net-based automated segmentation method based on water-fat images extracted labels of visceral adipose tissue (VAT), subcutaneous adipose tissue (SAT), liver, psoas muscle, and erector spinae muscle. The current work aims at assessing age-dependent abdominal organ volumes and PDFF in people with obesity.
Methods
Patients A total of 127 people with obesity12 underwent MR scanning (ClinicalTrials.gov Identifier: NCT04023942). MRI measurements were performed on a 3T scanner (Ingenia Elition X, Philips Healthcare). A six-echo 3D multi-echo gradient echo sequence with bipolar gradient readouts covering the abdominal-pelvic region was used. (4 stacks, 10.3 sec per stack and breath-hold, TR/TE1/ΔTE = 7ms /1.14 ms / 0.8 ms, flip angle = 3°, acquisition voxel size = 3x3x6 mm3, FOV = 400mmx543.4mmx144mm (APxRLxFH), bandwidth = 2367.4 Hz/pixel, CS-SENSE factor = 3.5). Chemical shift encoding-based water-fat separation was performed on the scanner using a model employing a multi-peak fat spectrum and a single T2* decay, which rendered water- and fat-separated images, as well as PDFF- and T2* maps. An automatic abdominal organ segmentation routine based on the nnU-Net was employed13.Statistical analysis
Statistical analysis was conducted in Python (version 3.8). The study cohort was split into two age groups, using the median age as a distinction limit. T-test was applied in case of normal distribution, the Mann-Whitney U test was applied otherwise (tested via Shapiro-Wilk). Linear Regression using ordinary least squares was applied to study the dependence of VAT volume on age for male and females, separately, and using body mass index (BMI) as independent additional variable.
To predict age based on baseline abdominal organ size and mean PDFF per organ, regression analysis was performed with following independent variables: sex, BMI at baseline, height, organ volumes and organ mean PDFF. The dataset of 127 participants was homogeneously split by sex and age into 86 train and 41 test sets. Four regression models were implemented using the sklearn library: Support Vector Regression, automatic relevance detection (ARD) Regression, stochastic gradient decent (SGD) Regression and Linear Regression.
Results
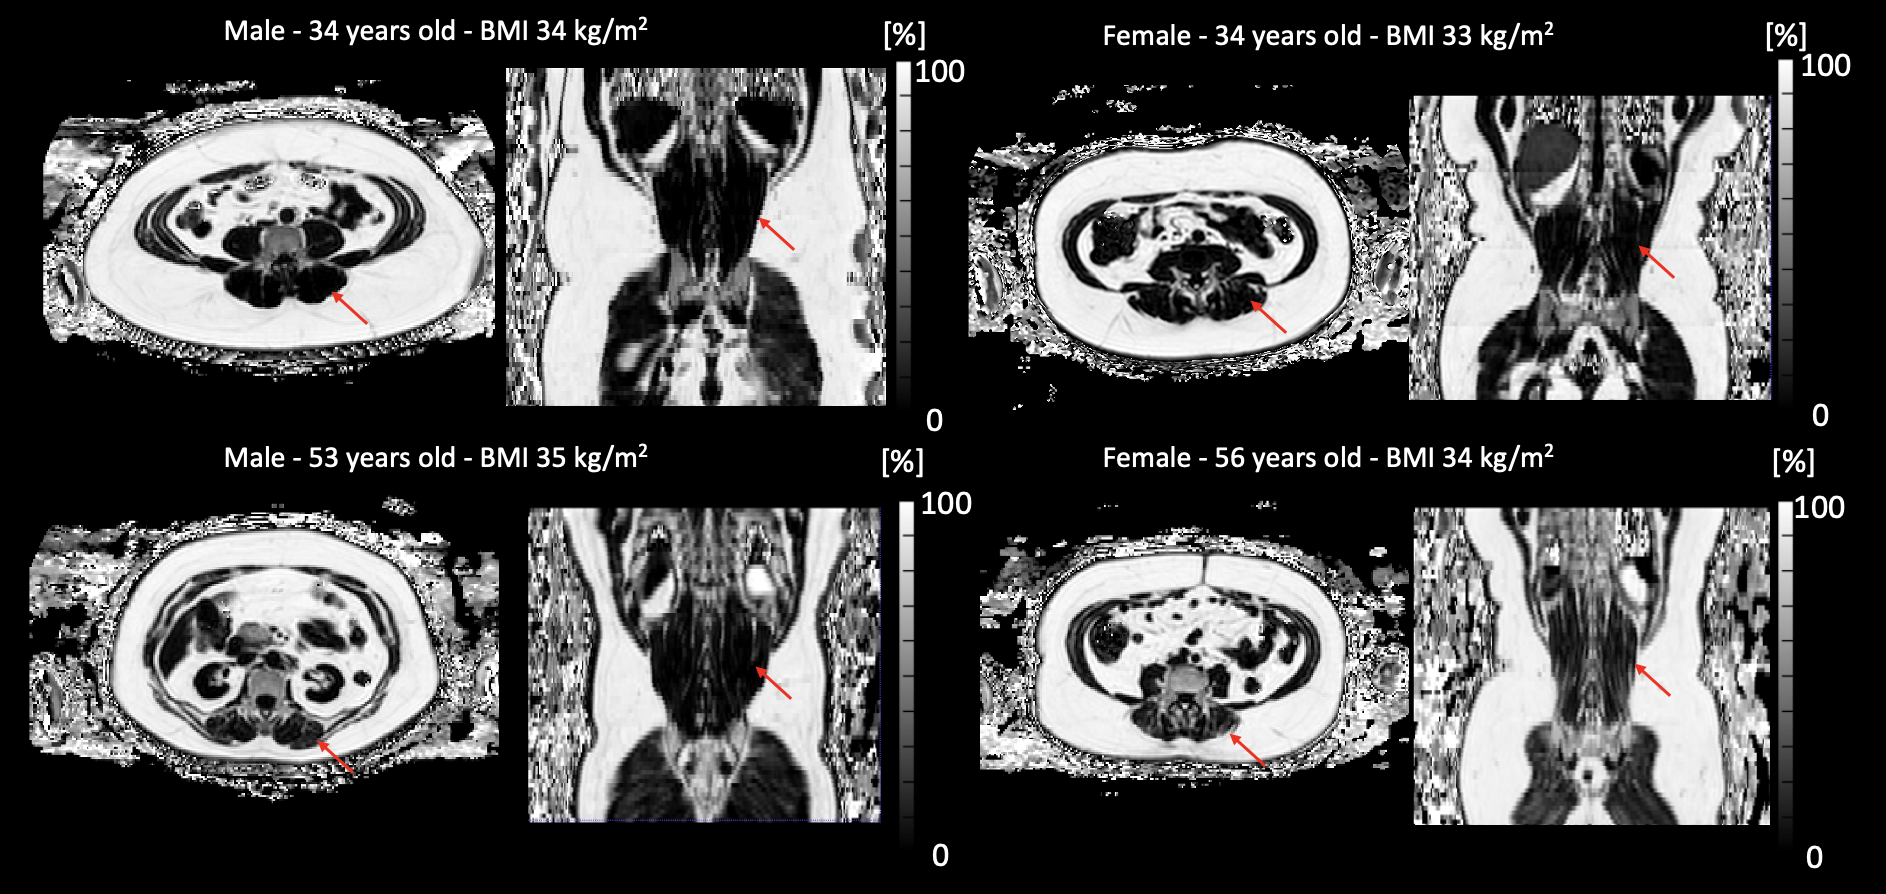
Representative results from the study showing segmentations obtained from the nnU-Net13 are displaced in Fig.1 and representative PDFF maps are displayed in Fig.2.Abdominal fat depot aging and age prediction
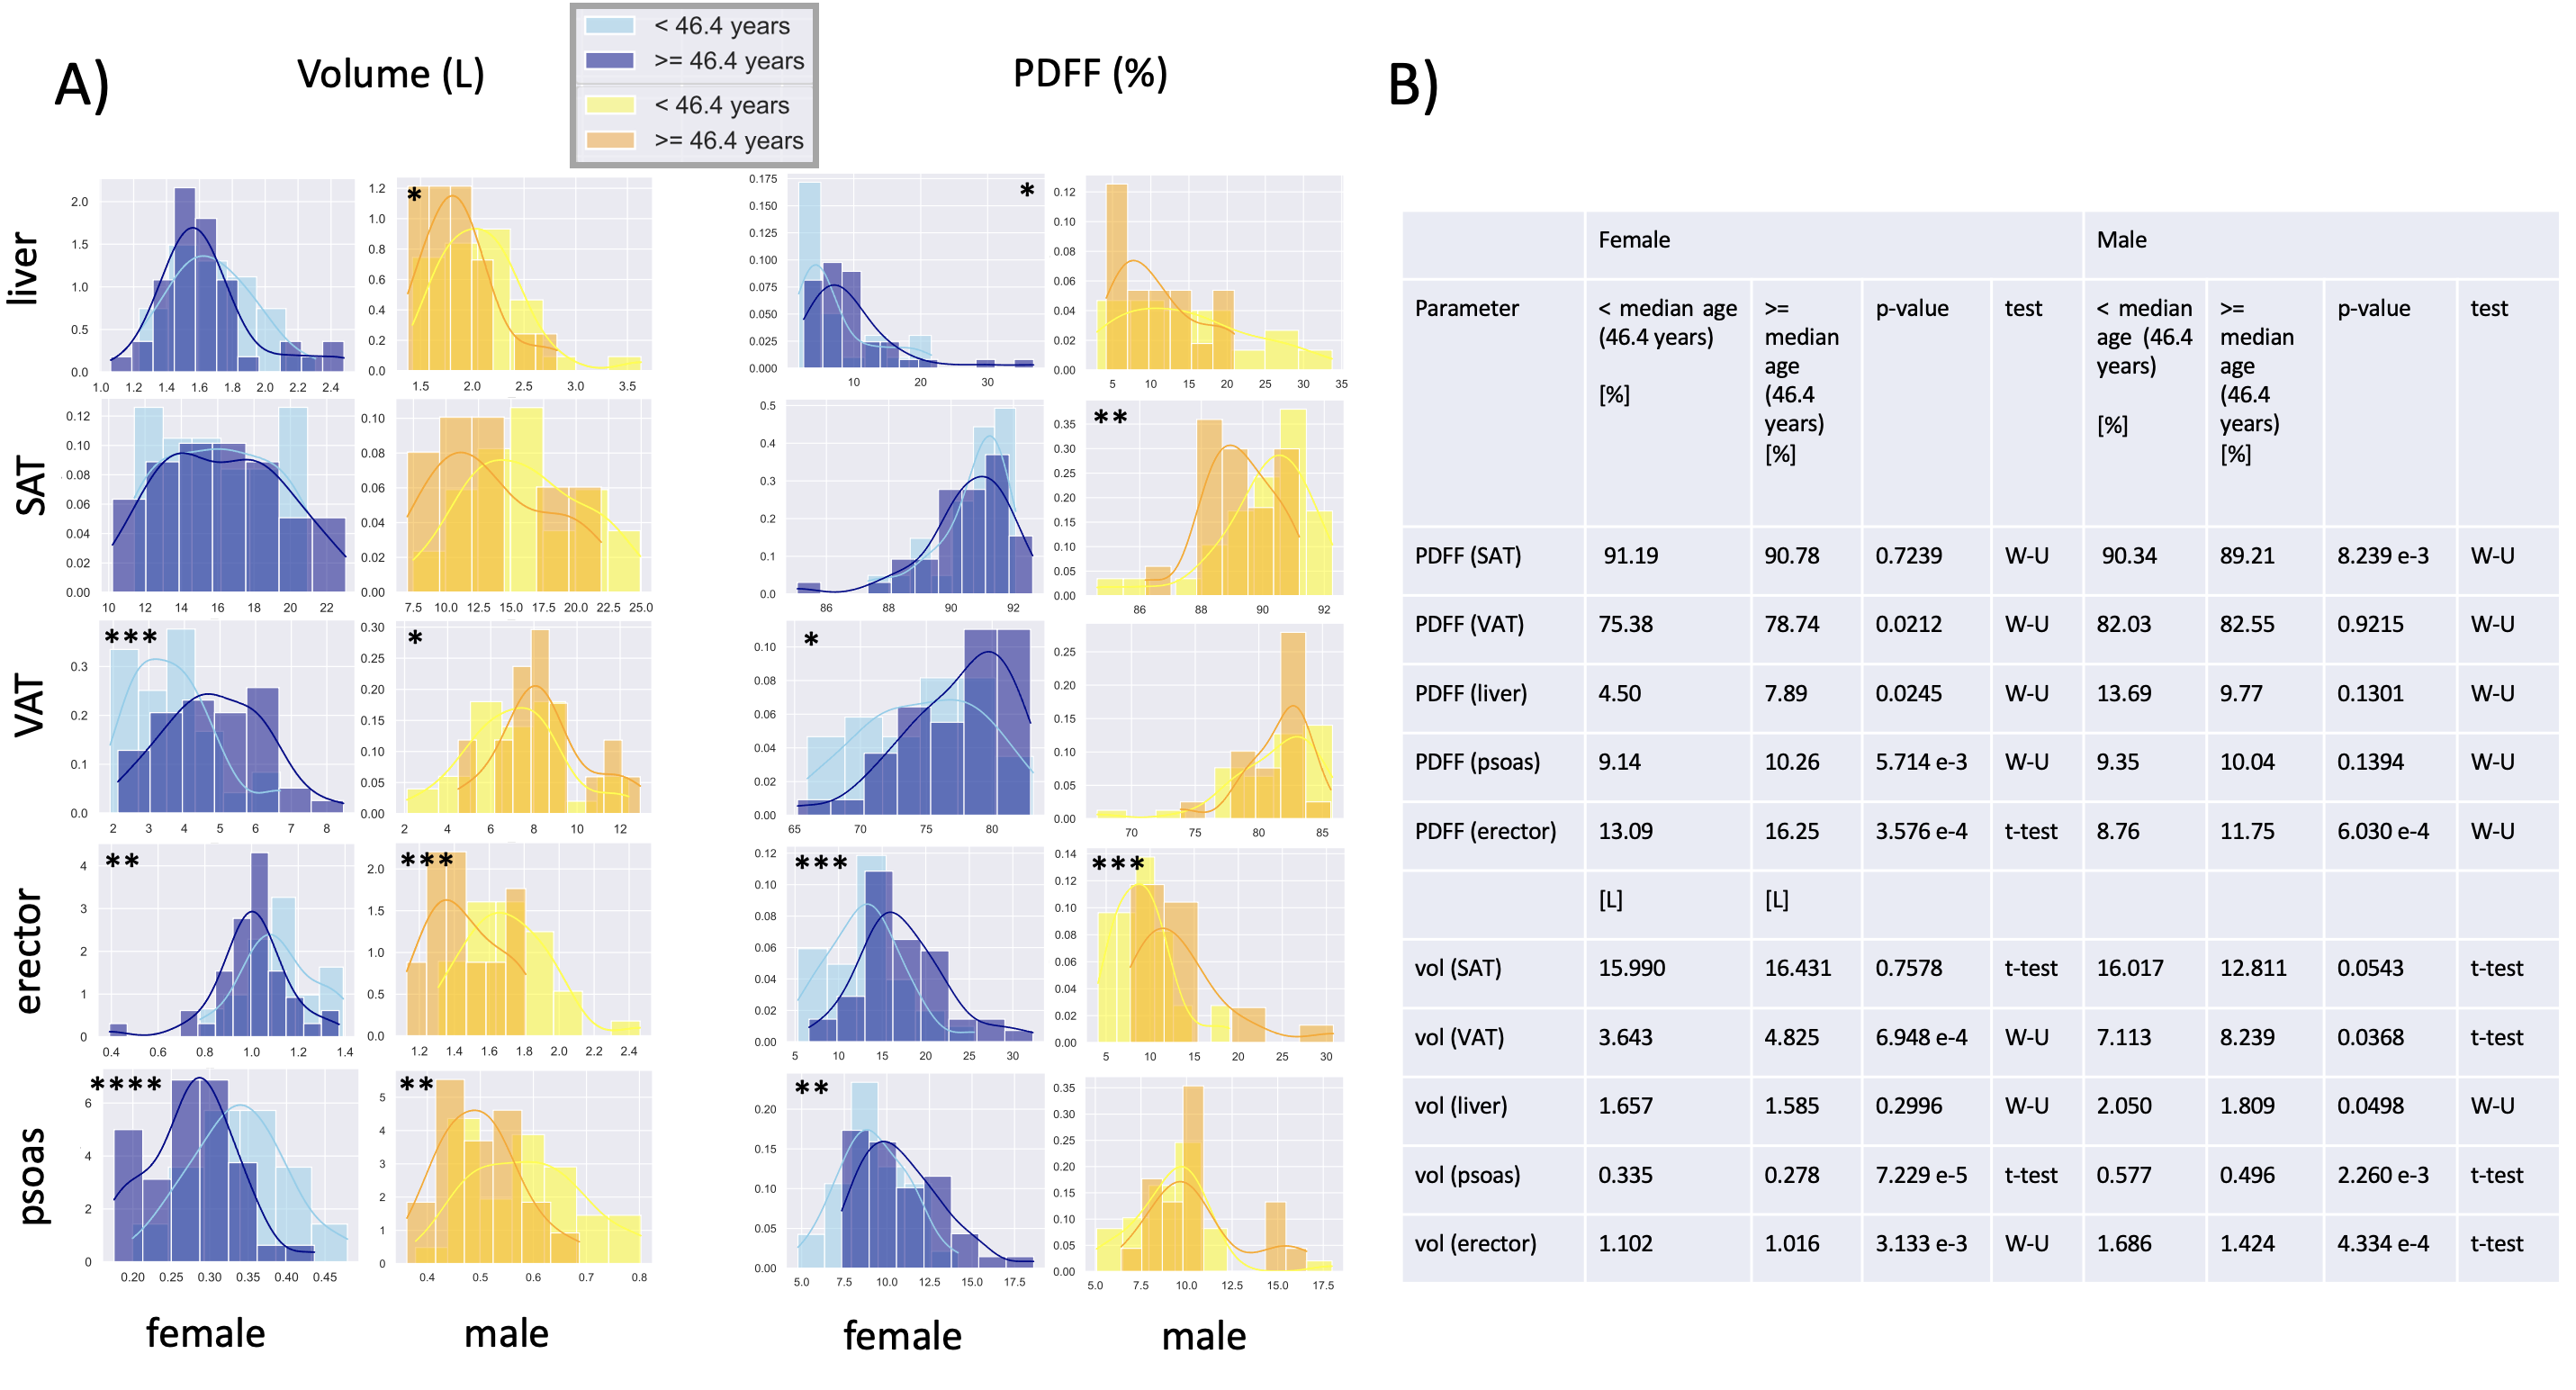
The histograms of the respective organ volume and organ mean PDFF are shown in Fig.3, separated by sex and two age groups. VAT volume was higher at an older age in both sexes, whereas organ volumes of the erector and the psoas muscle were lower at older age. The erector spinae mean PDFF showed a an increased fat accumulation at older age for both sexes. While there was a higher mean PDFF with age observed for females in liver, VAT and psoas muscle, there was interestingly a lower mean PDFF in SAT observed in males with increasing age. A decrease in liver volume with age14 could only be observed in males. An increase of PDFF inside the psoas with age was found in females only. The Multiple Linear Regression analysis revealed a significant increase of VAT volume with age for both sexes, independently of BMI (Results for age correlation are: males: R2=0.497, p-value = 8.77 e-06; females: R2=0.380, p-value = 3.32 e-05).
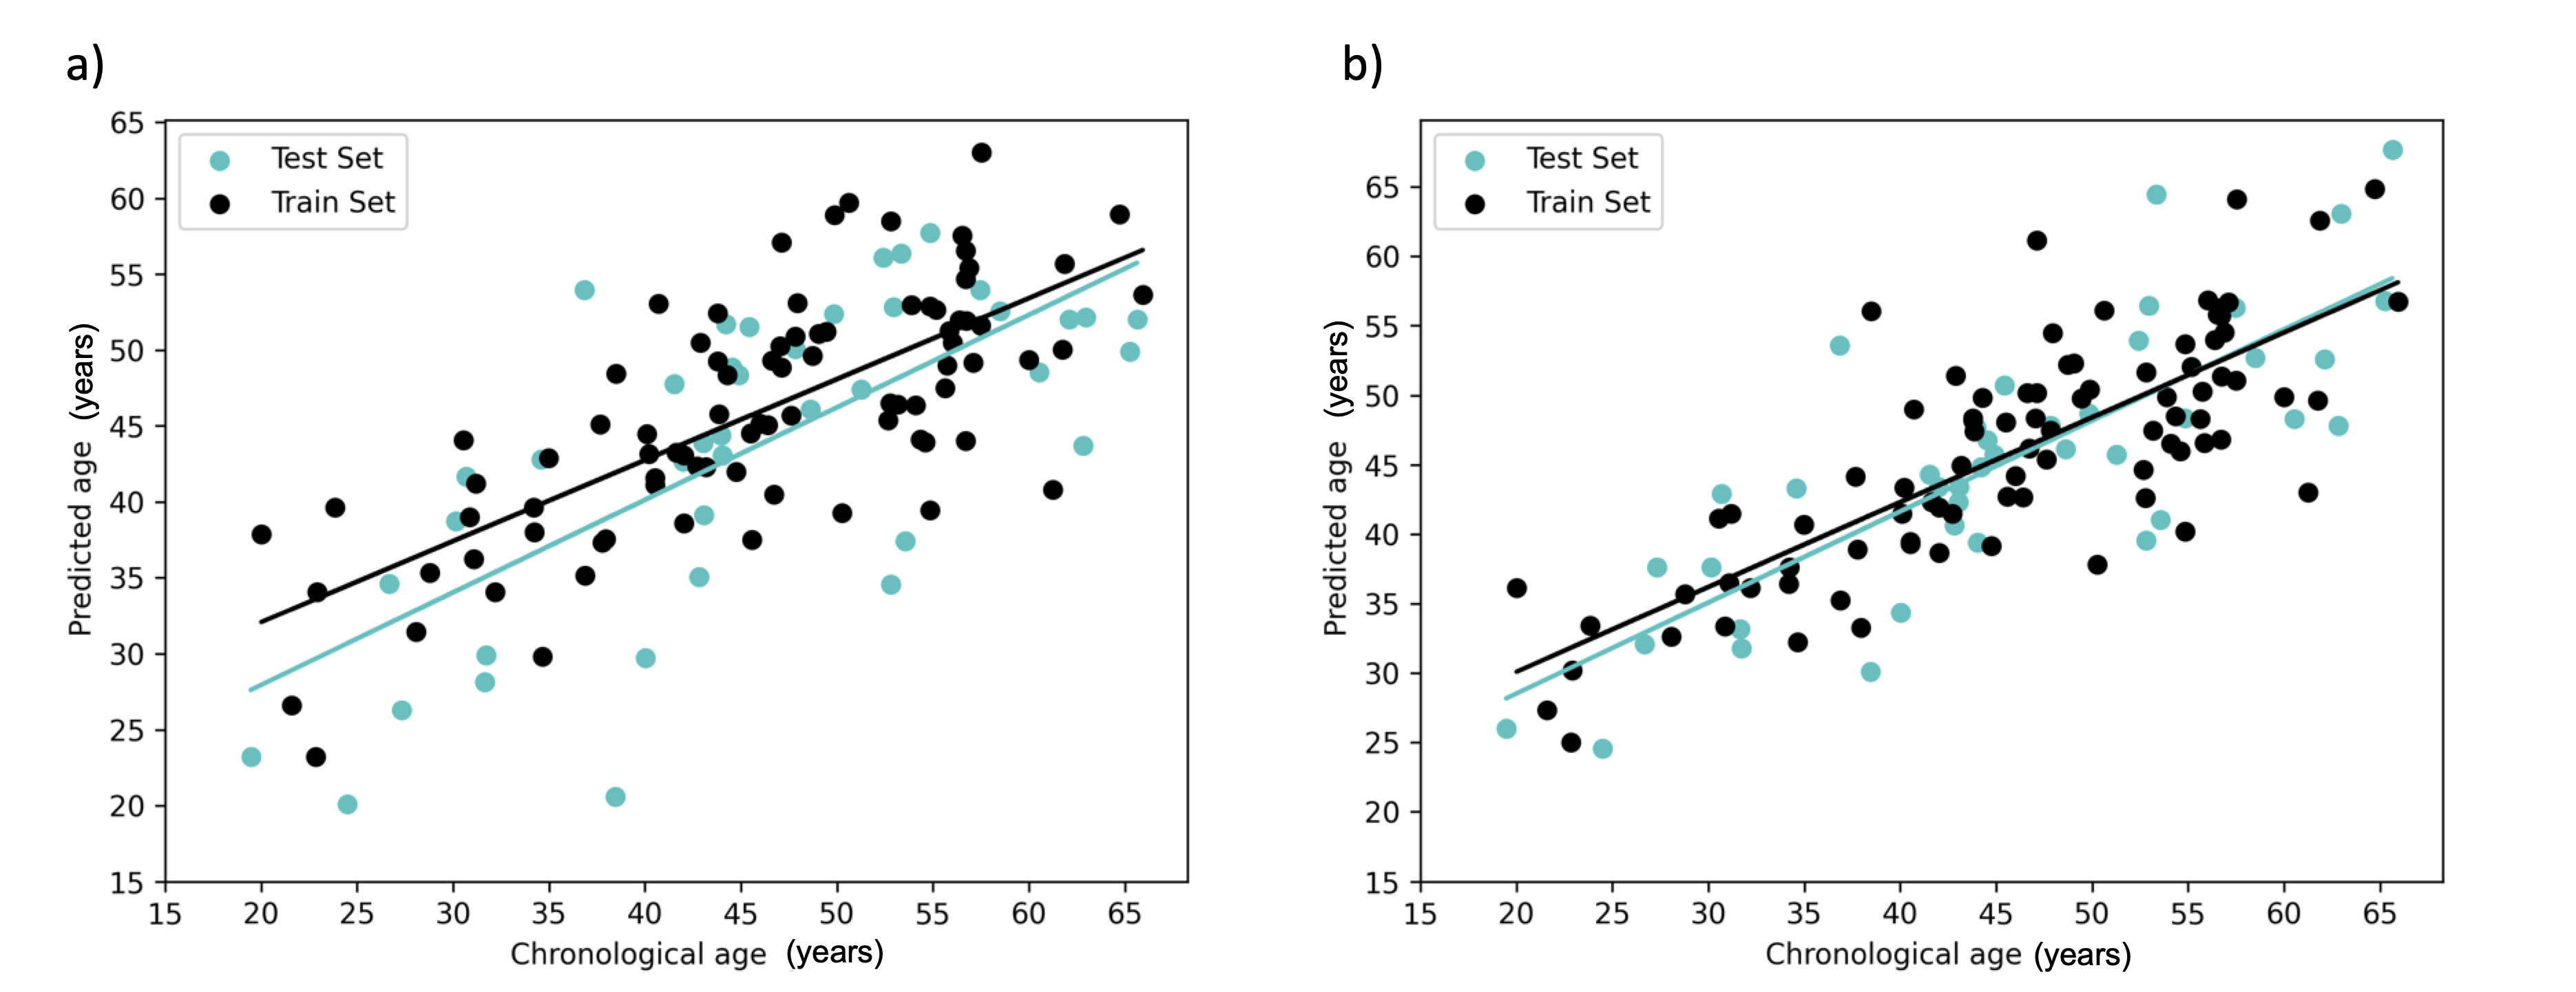
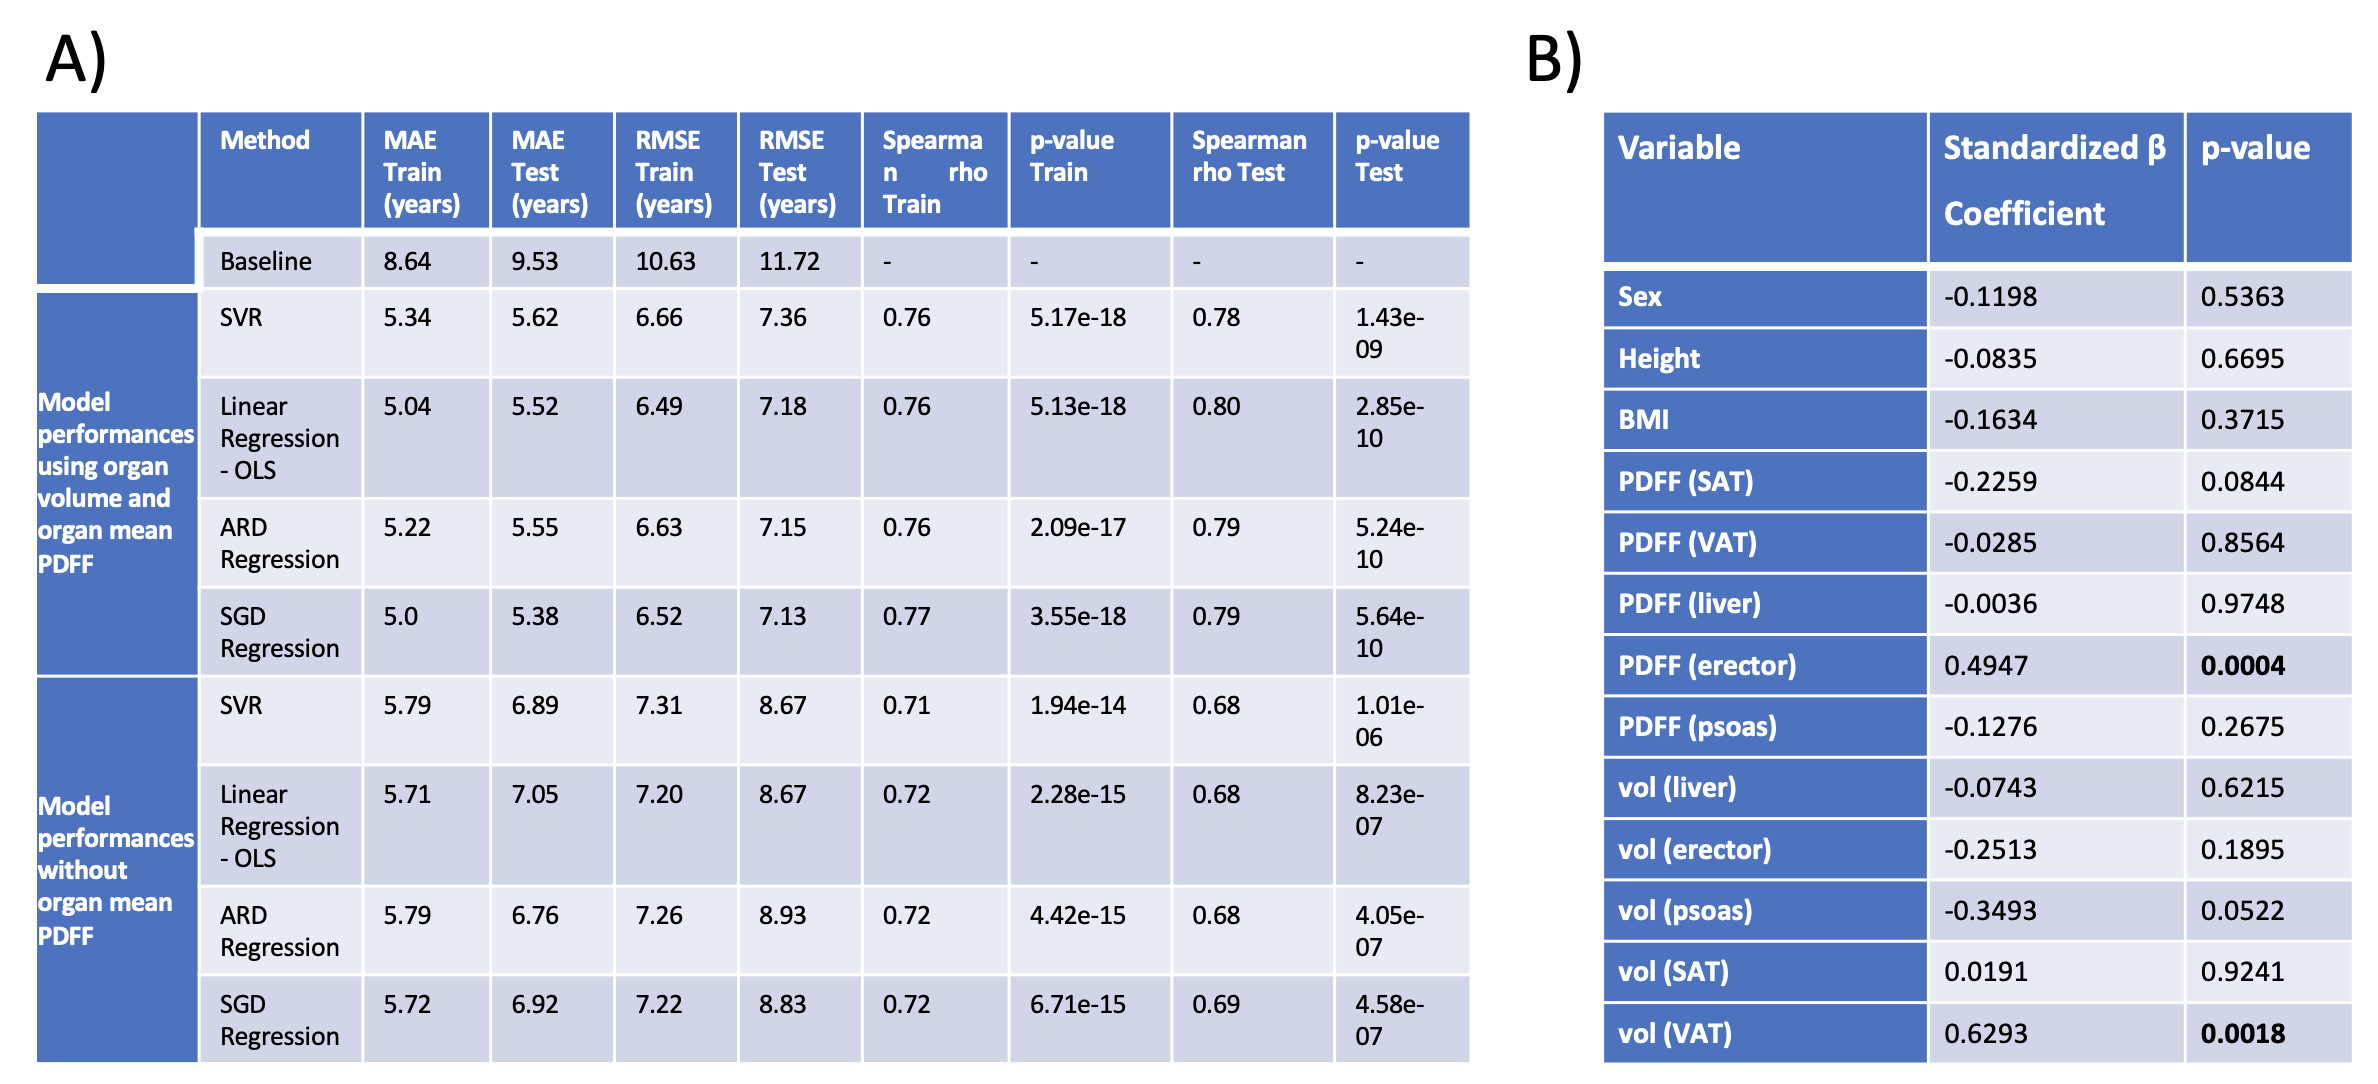
The performance metrics for predicting age using different regression methods are summarized in Fig.5. When accounting for both organ volume and mean PDFF, SGD yielded the best MAE in the test set with 5.38 years. Age prediction performance deteriorated significantly when excluding the mean PDFF values (Fig.4). The largest impact on age prediction, measured in terms of a high absolute standardized β coefficient, as well as a low p-value, were VAT volume and mean PDFF of the erector spinae muscles (Fig.5).
Conclusion
Adding PDFF information improved age prediction significantly. Our proposed age prediction algorithm based on extracted MR features achieved a MAE of 5.38 years. The performance could potentially be improved by increasing the number of data sets.Acknowledgements
This study was funded by the German Federal Ministry of Education and Research (BMBF, grant number: 01EA1709) within the framework of the Junior Research Group for Personalized Nutrition & eHealth (PeNut) of the enable Competence Cluster of Nutrition Research. In addition, the analysis was part of the project IMaGENE funded by BMBF (grant number: 16DKWN075). Further, the present work was supported by the German Research Foundation (project number 450799851 and project number 455422993/FOR 5298-iMAGO-P1).References
[1] Ward, Z. J. et al. Projected U.S. State-Level Prevalence of Adult Obesity and Severe Obesity. N. Engl. J. Med. 381, 2440–2450 (2019).
[2]
Linge,
J. et al. Body Composition
Profiling in the UK Biobank Imaging Study. Obesity
26, 1785–1795 (2018).
[3] Agrawal, S. et al. BMI-adjusted adipose tissue volumes exhibit depot-specific and divergent associations with cardiometabolic diseases. Nat. Commun. 14, 266 (2023).
[4] Shungin, D. et al. New genetic loci link adipose and insulin biology to body fat distribution. Nature 518, 187–196 (2015).
[5] Wagner, R. et al. Pathophysiology-based subphenotyping of individuals at elevated risk for type 2 diabetes. Nat. Med. 27, 49–57 (2021).
[6] Palmer, B. F. & Clegg, D. J. The sexual dimorphism of obesity. Mol. Cell. Endocrinol. 402, 113–119 (2015).
[7] Zeng, Q. et al. CT-derived abdominal adiposity: Distributions and better predictive ability than BMI in a nationwide study of 59,429 adults in China. Metabolism 115, 154456 (2021).
[8] Banack, H. R. et al. Longitudinal patterns of abdominal visceral and subcutaneous adipose tissue, total body composition, and anthropometric measures in postmenopausal women: Results from the Women’s Health Initiative. Int. J. Obes. 47, 288–296 (2023).
[9] Whitaker, K. M. et al. Sex differences in the rate of abdominal adipose accrual during adulthood: the Fels Longitudinal Study. Int. J. Obes. 40, 1278–1285 (2016).
[10] Le Goallec, A. et al. Using deep learning to predict abdominal age from liver and pancreas magnetic resonance images. Nat. Commun. 13, 1979 (2022).
[11] Reeder, S. B., Hu, H. H. & Sirlin, C. B. Proton density fat-fraction: a standardized MR-based biomarker of tissue fat concentration. J. Magn. Reson. Imaging 36, 1011–1014 (2012).
[12] Reik, A. & Holzapfel, C. Randomized Controlled Lifestyle Intervention (LION) Study for Weight Loss and Maintenance in Adults With Obesity-Design and Methods. Front Nutr 7, 586985 (2020).
[13] Wu, M., Somasundaram, A. et al. Assessing Sex Differences in Abdominal Fat Depots of People with Obesity under Weight Loss using Automated Segmentation. ISMRM conference proceedings 2023 #0956
[14]
Kim,
I. H., Kisseleva, T. & Brenner, D. A. Aging and liver disease. Curr.
Opin. Gastroenterol. 31, 184–191 (2015).
Figures
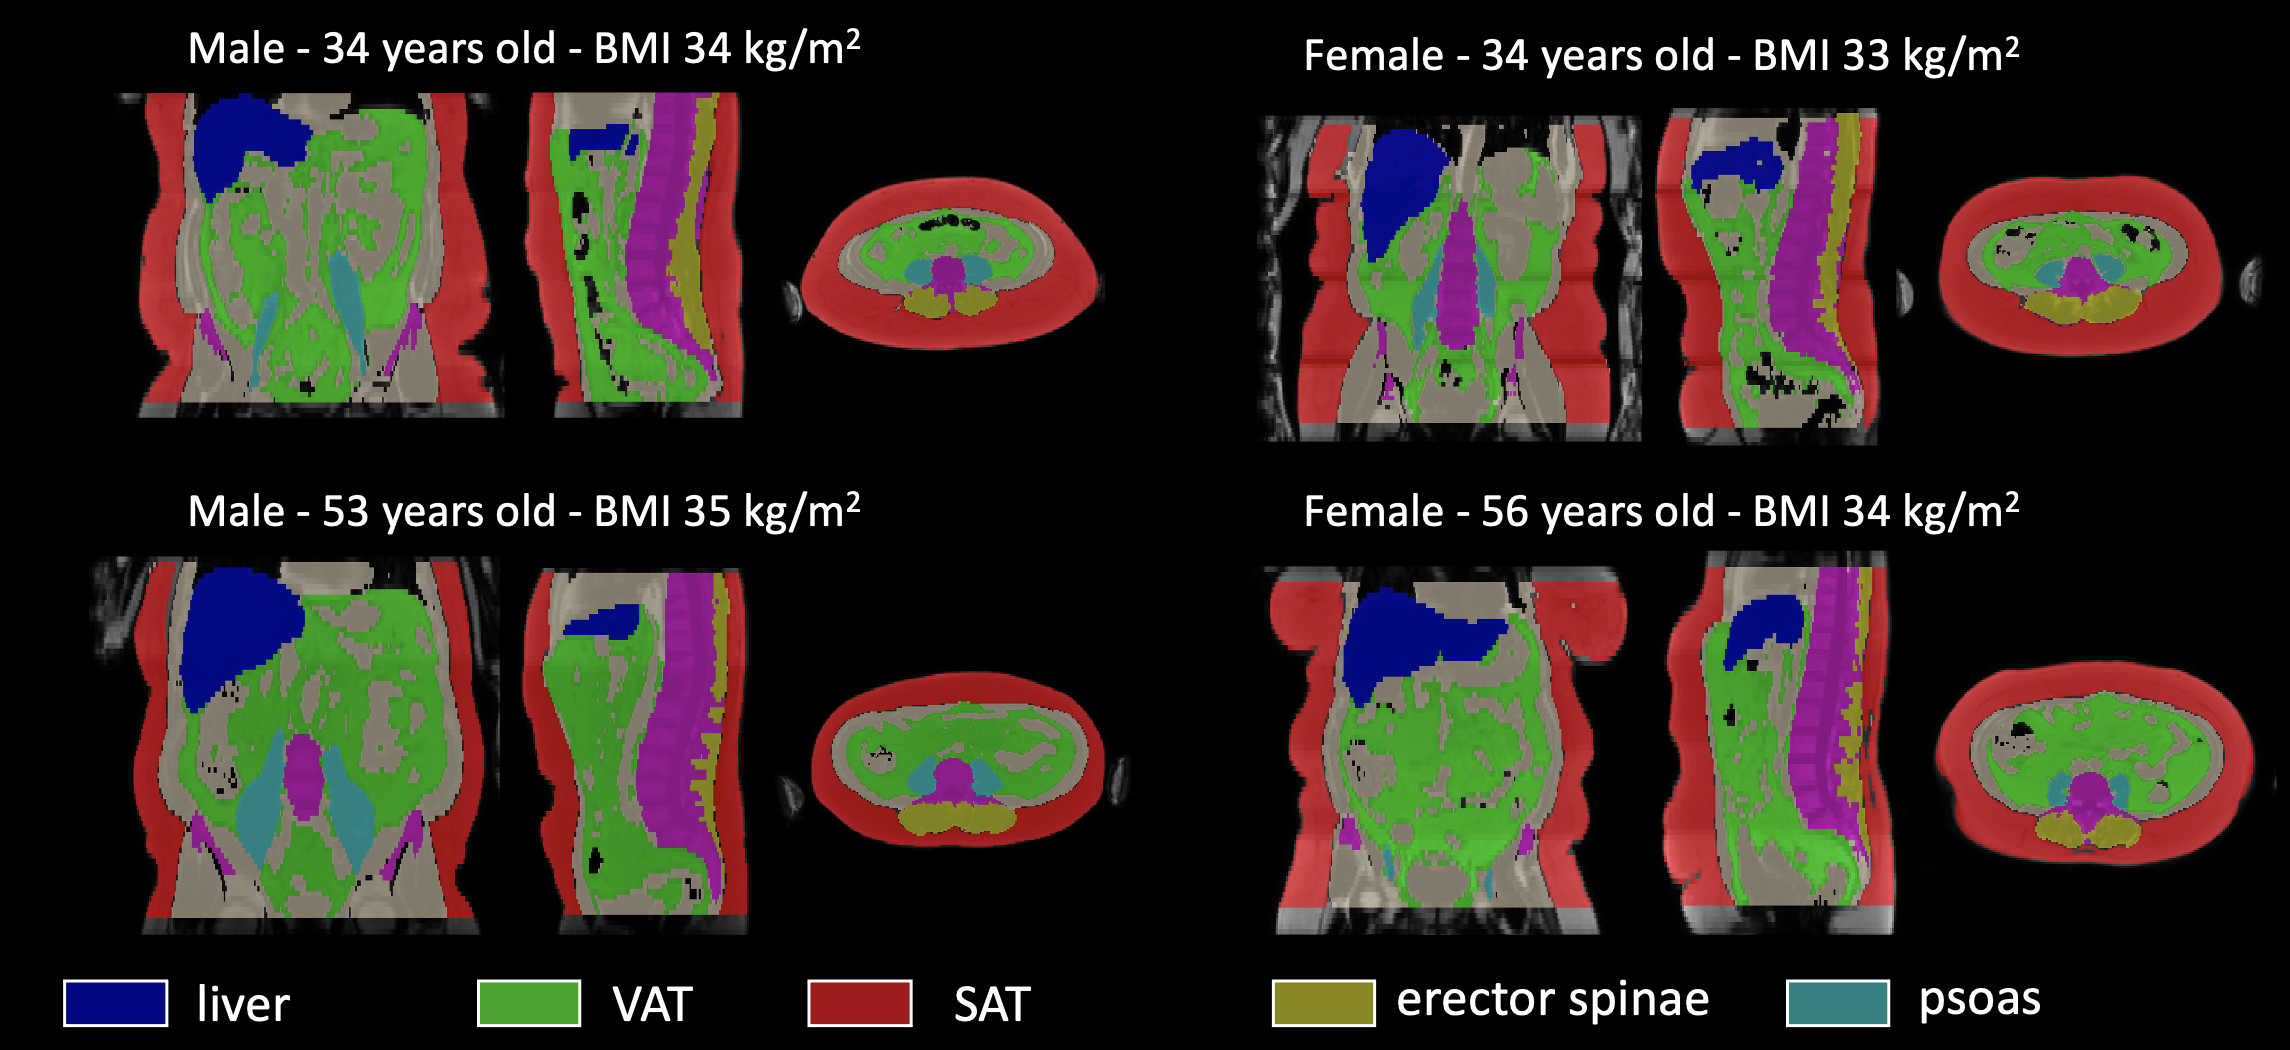
Figure 1 Representative coronal, sagittal, and axial plane of abdominal organ segmentations for female and male participants with similar BMI and two different age groups. The increased volume of VAT with age can be appreciated especially in the coronal view.
VAT: visceral adipose tissue, SAT: subcutaneous adipose tissue.