0835
Linearity and Bias of Proton Density Fat Fraction Across the Full Dynamic Range (0-100%): a Multiplatform, Multivendor Phantom Study at Two Sites.1Radiology, University of Colorado and Children's Hospital Colorado , Anschutz Medical Campus, Aurora, CO, United States, 2Radiology and Medical Physics, University of Wisconsin-Madison, Madison, WI, United States
Synopsis
Keywords: Liver, Fat, proton density fat fraction, quantitative, reproducibility, repeatability
Motivation: Performance assessment of PDFF in phantoms and in vivo, including linearity and bias, and reproducibility and repeatability, have largely focused between the range of 0-50%.
Goal(s): We analyzed PDFF performance in a two-site phantom study across the full 0-100% PDFF range.
Approach: We used commercially available quantitative 3D chemical-shift-encoded water-fat MRI pulse sequences across three vendors at 1.5T and 3T.
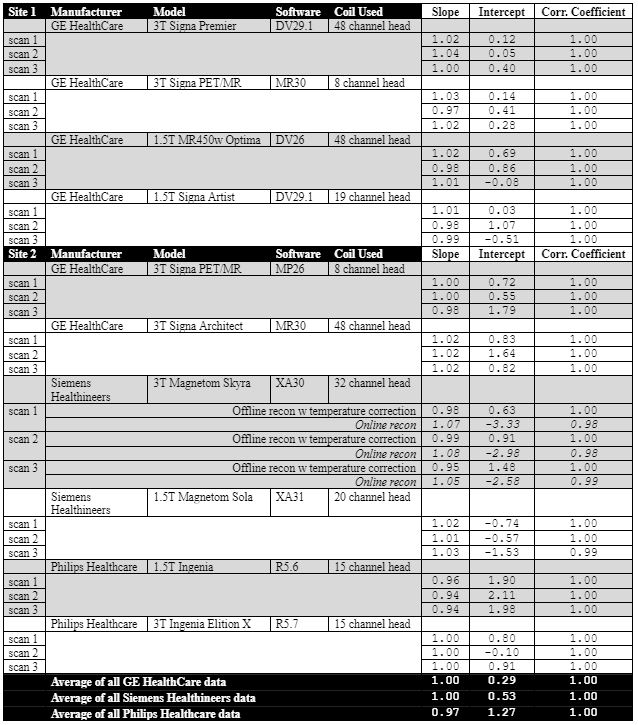
Results: Results demonstrate strong linearity and minimal bias {pooled slope and intercept for 1.5T=0.99 (95% CI: 0.981-0.997), 0.61 (0.17, 1.04); for 3T=1.00 (0.995, 1.005), 0.69 (0.39, 0.97)} of PDFF across 10 MRI systems. Pooled reproducibility coefficient (RDC) across 30 phantom exams was 3.92%.
Impact: PDFF across the 0-100% range can be reliably estimated with minimal bias and strong linearity using current commercial offerings from MRI vendors at 1.5T and 3T, with intra-scanner repeatability coefficient<2% (in PDFF%) and inter-scanner, inter-site, and inter-vendor RDC<4% (in PDFF%).
Introduction and Background
Proton Density Fat Fraction (PDFF) is a widely available and well-accepted quantitative MRI biomarker of tissue fat content, gaining initial popularity for liver applications, and more recently in other tissues and organs [1-3]. Extensive work has been performed to assess the linearity, bias, repeatability, and reproducibility of PDFF over the past decade [4,5], with many studies focusing on the physiologically relevant PDFF range of 0-50% for liver. The Quantitative Imaging Biomarkers Alliance (QIBA) recently released a profile on PDFF to promote standardized usage of MRI-based PDFF for liver applications [6]. The purpose of this work is to extend the analysis of PDFF performance across the 0-100% PDFF range for applications such as skeletal muscle, bone marrow, and adipose tissue where higher PDFF values are encountered [1-3].Materials and Methods
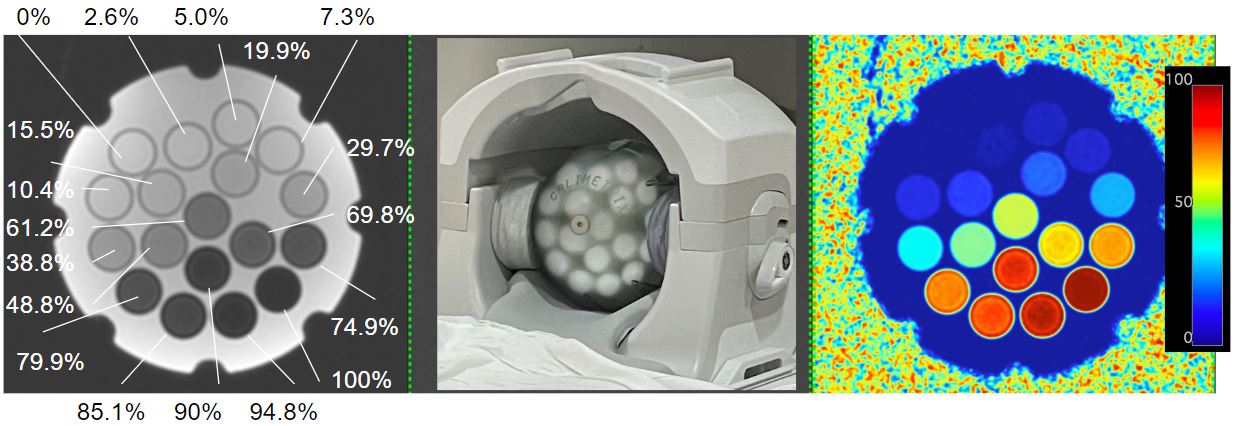
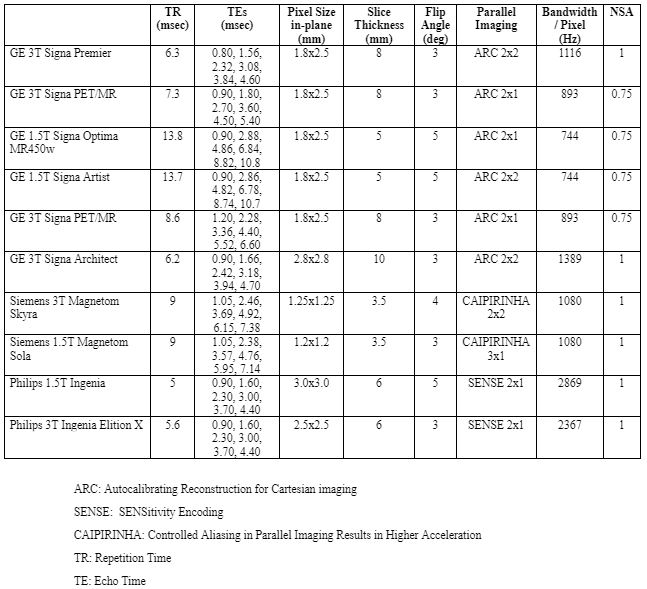
Design: This study was conducted at two facilities between July-September 2023. Figure 1 lists the MRI system involved in this work. A commercially available PDFF phantom (Comprehensive PDFF Phantom, Model 825, Calimetrix, Madison, WI) was used. The phantom houses 18 water-fat vials. Vial diameter and length: 2.4cm and 5cm. The volume of the emulsion ingredients (except 0% and 100% PDFF vials) defined the reference PDFF values in each vial, which were verified by standard Calimetrix quality control procedures. The vials are positioned within a fill solution inside a spherical housing (diameter: 19.1cm) to minimize B0 inhomogeneity. Figure 2 shows a photograph of the phantom and its placement inside a head coil. Calimetrix-verified reference PDFF values capturing the entire 0-100% range are labeled for each vial.Data: Figure 3 summarizes imaging parameters from each MRI system. At each site, data were acquired using commercially available quantitative 3D chemical-shift-encoded water-fat protocols with no modifications to default parameter settings (i.e., LiverLab, Siemens Healthineers; mDIXON Quant, Philips Healthcare; IDEAL IQ, GE HealthCare). For each system, data were acquired three times. The first two exams occurred on the same day and aimed to test same-day intra-scanner repeatability. After the first exam, the phantom was removed, the coil was unplugged and replugged, the phantom was repositioned, and the second exam was initiated. The time between the first two exams was a few minutes. The third exam was performed on the relevant MRI system 3-7 days after the initial two exams. This exam was aimed to test different-day intra-scanner repeatability. The "phantom" option was selected for all exams. Between sites, the phantom was shipped via overnight courier in a foam-padded case. At each site prior to data acquisition, the phantom was allowed to equilibrate to room temperature in the MRI suite before imaging (range observed: 17-24oC). A single analyst placed circular regions of interest (ROIs) within each vial on the vendor online-reconstructed PDFF maps. ROIs were placed on the mid-axial slice across the imaging stack encompassing each vial. The mean PDFF value was recorded for each ROI.
Offline Reconstruction+Temperature Correction: For one system (see Figures), measured PDFF values from vendor online-reconstructed PDFF maps were observed to deviate significantly from reference PDFF values across the 50-70% PDFF range in comparison to other systems. As an additional step, source magnitude echo images were saved and offline reconstruction was performed for this system, with correction for temperature-related off-resonance shifts (i.e., an additional shift of 0.1ppm between water-fat peaks) [7-9].
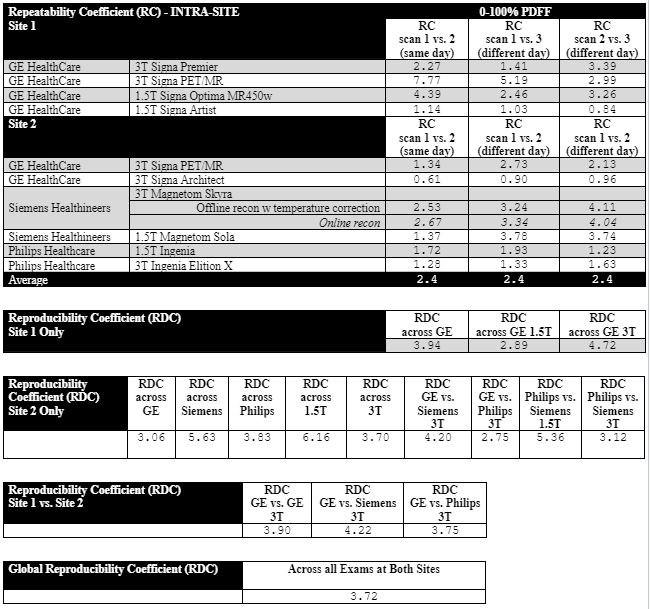
Statistics: Linearity and bias were assessed over the range of 0–100% PDFF for each system. Same-day intra-scanner repeatability and different-day intra-scanner repeatability were assessed with repeatability coefficients. Reproducibility coefficients were computed to assess performance between sites, vendors, and magnet field strengths. Both ROI measurements from online reconstruction and offline reconstruction with temperature correction were used for analysis.
Results
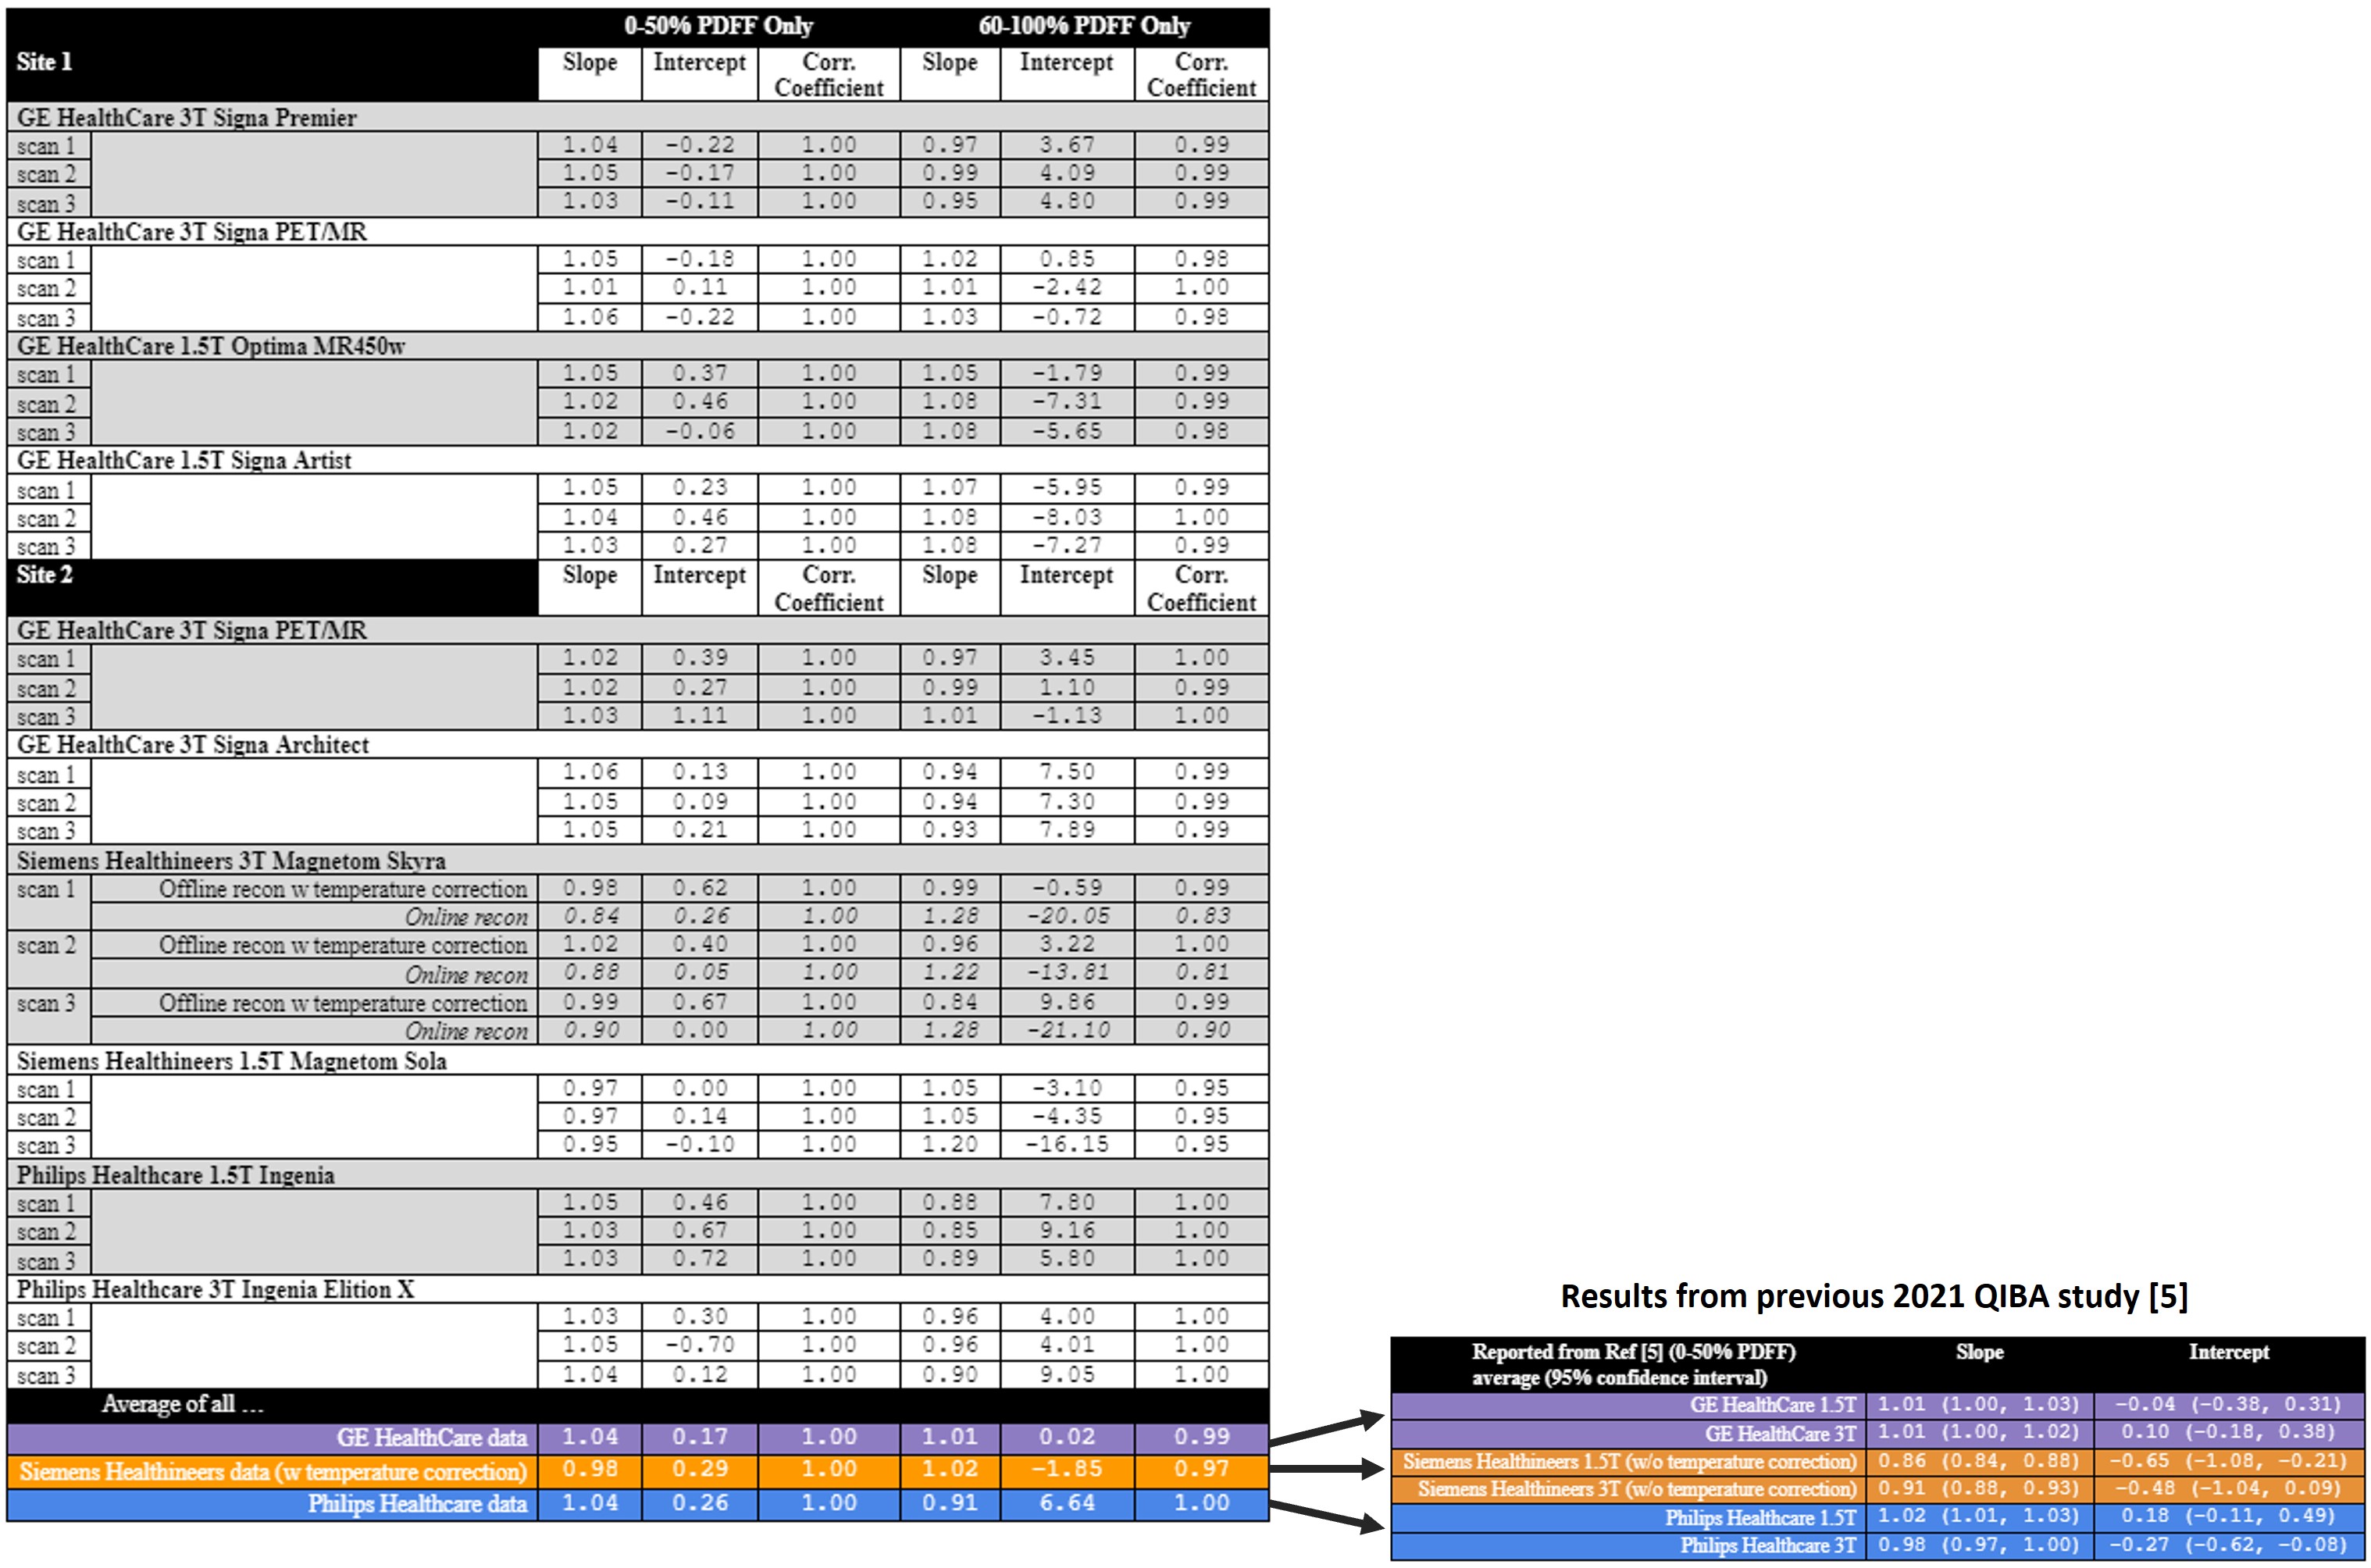
Figure 1 summarizes linear regression statistics for the entire 0-100% PDFF range. Figure 4 breaks down the regression from 0-50% PDFF and 60-100% PDFF. Data from one system at Site 2 are shown twice: online reconstruction (italicized) and offline reconstruction with temperature correction. For comparison, linear regression statistics from [5] are shown at the end of Figure 4 for the 0-50% PDFF range, and these values are similar to the current study’s results. Figure 5 summarizes repeatability and reproducibility coefficients across the study. The global reproducibility coefficient across all acquisitions was 3.72%.Conclusion
The accuracy of PDFF across the 0-100% range can be reliably estimated with high precision, using current commercial “off-the-shelf” offerings from MRI vendors utilizing multi-echo chemical-shift-encoded spoiled gradient-recalled echo acquisitions with no parameter modifications. The presented results at 1.5T and 3T satisfy performance metrics recommended by the QIBA profile [6], and yield data comparable to previous QIBA works [5] that utilized phantom-optimized protocols between 0-50% PDFF.Acknowledgements
Authors from the University of Colorado wish to thank Victoria Bress and Tori Rodriguez for administrative assistance with the project. This study was partially supported by the 2022-2023 Faculty Development Pilot Grant of the Department of Radiology, University of Colorado, Anschutz Medical Campus.
References
[1] Frantz D, Weidlich D, Freitag F, et al. Association of proton density fat fraction in adipose tissue with imaging-based and anthropometric obesity markers in adults. Int J Obes (Lond). 2018;42(2):175-182.
[2] Schmeel FC, Vomweg T, Traber F, et al. Proton density fat fraction MRI of vertebral bone marrow: accuracy, repeatability, and reproducibility among readers, field strengths, and imaging platforms. J Magn Reson Imaging 2019;50:1762-1772.
[3] Schlaffke L, Rehmann R, Rohm M, et al. Multi‐center evaluation of stability and reproducibility of quantitative MRI measures in healthy calf muscles. NMR in Biomed 2019;32:e4119.
[4] Fowler, KJ, Venkatesh SK, Obuchowski N, et al. Repeatability of MRI biomarkers in nonalcoholic fatty liver disease: The NIMBLE Consortium. Radiology 2023; 309(1):e231092.
[5] Hu HH, Yokoo T, Bashir M, et al. Linearity and bias of proton density fat fraction as a quantitative imaging biomarker: A multicenter, multiplatform, multivendor phantom study. Radiology. 2021; 298(3):640-651.
[6] https://qibawiki.rsna.org/index.php/Profiles
[7] Hernando D, Sharma SD, Kramer H, Reeder SB. On the confounding effect of temperature on chemical shift-encoded fat quantification. Magn Reson Med. 2014;72(2):464-470.
[8] Hernando D, Sharma SD, Ghasabeh MA, et al. Multisite, multivendor validation of the accuracy and reproducibility of proton-density fat-fraction quantification at 1.5T and 3T using a fat-water phantom. Magn Reson Med. 2017;77(4):1516-1524.
[9] Navaratna R, Zhao R, Colgan TJ, et al. Temperature-corrected proton density fat fraction estimation using chemical shift-encoded MRI in phantoms. Magn Reson Med. 2021;86(1):68-81.
Figures