0831
Differential myelination maturation across cortical regions and white matter tracts during infancy1Department of Radiology, Children's Hospital of Philadelphia, Philadelphia, PA, United States, 2Department of Bioengineering, University of Pennsylvania, Philadelphia, PA, United States, 3Department of Radiology, University of Pennsylvania, Philadelphia, PA, United States
Synopsis
Keywords: Normal Development, Screening, Myelination, Infant Brain, Early Development, Structural MRI
Motivation: While myelination is known to progress rapidly in the infant brain, the specific myelination progression in finer cortical regions and white matter (WM) tracts remain elusive. The precise effects of environmental impacts on infant brain myelination maturation require further investigation.
Goal(s): Our goal was to delineate differential myelination maturation trajectories across cortical and WM regions during infancy and explore their associations with environmental factors.
Approach: T1-weighted and T2-weighted images were used to map myelin content and analyzed with generalized additive models.
Results: Differential myelination processes were found across cortical and white matter regions, with significant correlations to socioeconomic status and parental stress.
Impact: This research advances understanding of complicated yet organized patterns in the early developing brain, informing pediatric care strategies. It enables targeted interventions for at-risk groups based on environmental impacts, potentially improving long-term cognitive outcomes. Further studies could investigate intervention efficacy.
Introduction
Myelin is essential for efficient neural communication1,2 and its maturation3 is crucial during the first two years of life, a period of the most dynamic brain development4-6. Although it's known that myelination occurs in stages, with primary regions developing before associative regions7,8, the specific infant brain myelination progression in finer cortical regions and white matter (WM) tracts is unclear. Additionally, while factors like parental stress (PSS) and socioeconomic status (SES) are believed to impact brain structure development in childhood9,10, their specific relationships with myelination in infants remain unexplored. Here, we measured the longitudinal trajectories of the myelination across cortex regions and WM tracts from 1-24 months using structural MRI images and further examined its correlation with environmental influences through behavioral analysis.Methods
Data acquisition: In this study, 293 infants aged 1-24 months were recruited. Among them, 93 infants underwent complete T1-weighted and T2-weighted scans with a 3.0T Siemens Prisma MRI scanner. We acquired T1-weighted images with MPRAGE (TR/TE = 2400/2.24 ms, 0.8 mm isotropic) and T2-weighted images with SPACE (TR/TE = 3200/564 ms, 0.8 mm isotropic), both with a field of view (FOV) of 166.4 × 240 × 2563 and an acquisition matrix of 208 x 300 x 320.Data processing: All infants' T1-weighted and T2-weighted MRI scans are processed through a pipeline involving brain extraction, linear alignment of T1 to T2 images with FSL's FLIRT11, and registration to a 10-month template with antsRegistrationSyN using cross-correlation as optimization metric12. Following preprocessing and visual inspection, two images were discarded for poor quality. We produced T1/T2 myelin maps by dividing the aligned T1 by T2 images, which mathematically cancels the signal intensity bias13.
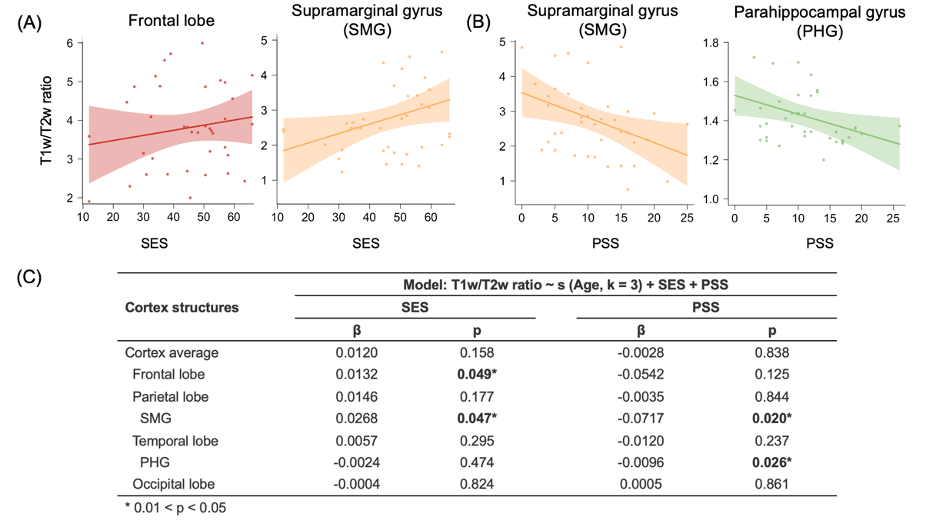
Measurements of myelin maturation and their associations with SES and PSS: The 1-year-old Penn-CHOP atlas was utilized to identify 45 regions of interest (ROIs) in the infant's brain, covering 4 lobes (19 cortical regions) and 5 WM tract groups (26 WM tracts)14,15. Hemispheric averages were calculated for each ROI, and data extraction was carried out using MATLAB. We used R's generalized additive models (GAMs)16 to model myelination maturation across all regions, with each model formulated as T1w/T2w ratio ~ s (Age, k = 3). Parents of 51 infants provided SES, which is calculated using education and occupation, and PSS data, which reflects stress levels over the past month via questionnaires. GAMs was applied to analyze the impact of SES and PSS on myelination, with the model: T1w/T2w ratio ~ s (Age, k = 3) + SES + PSS.
Results
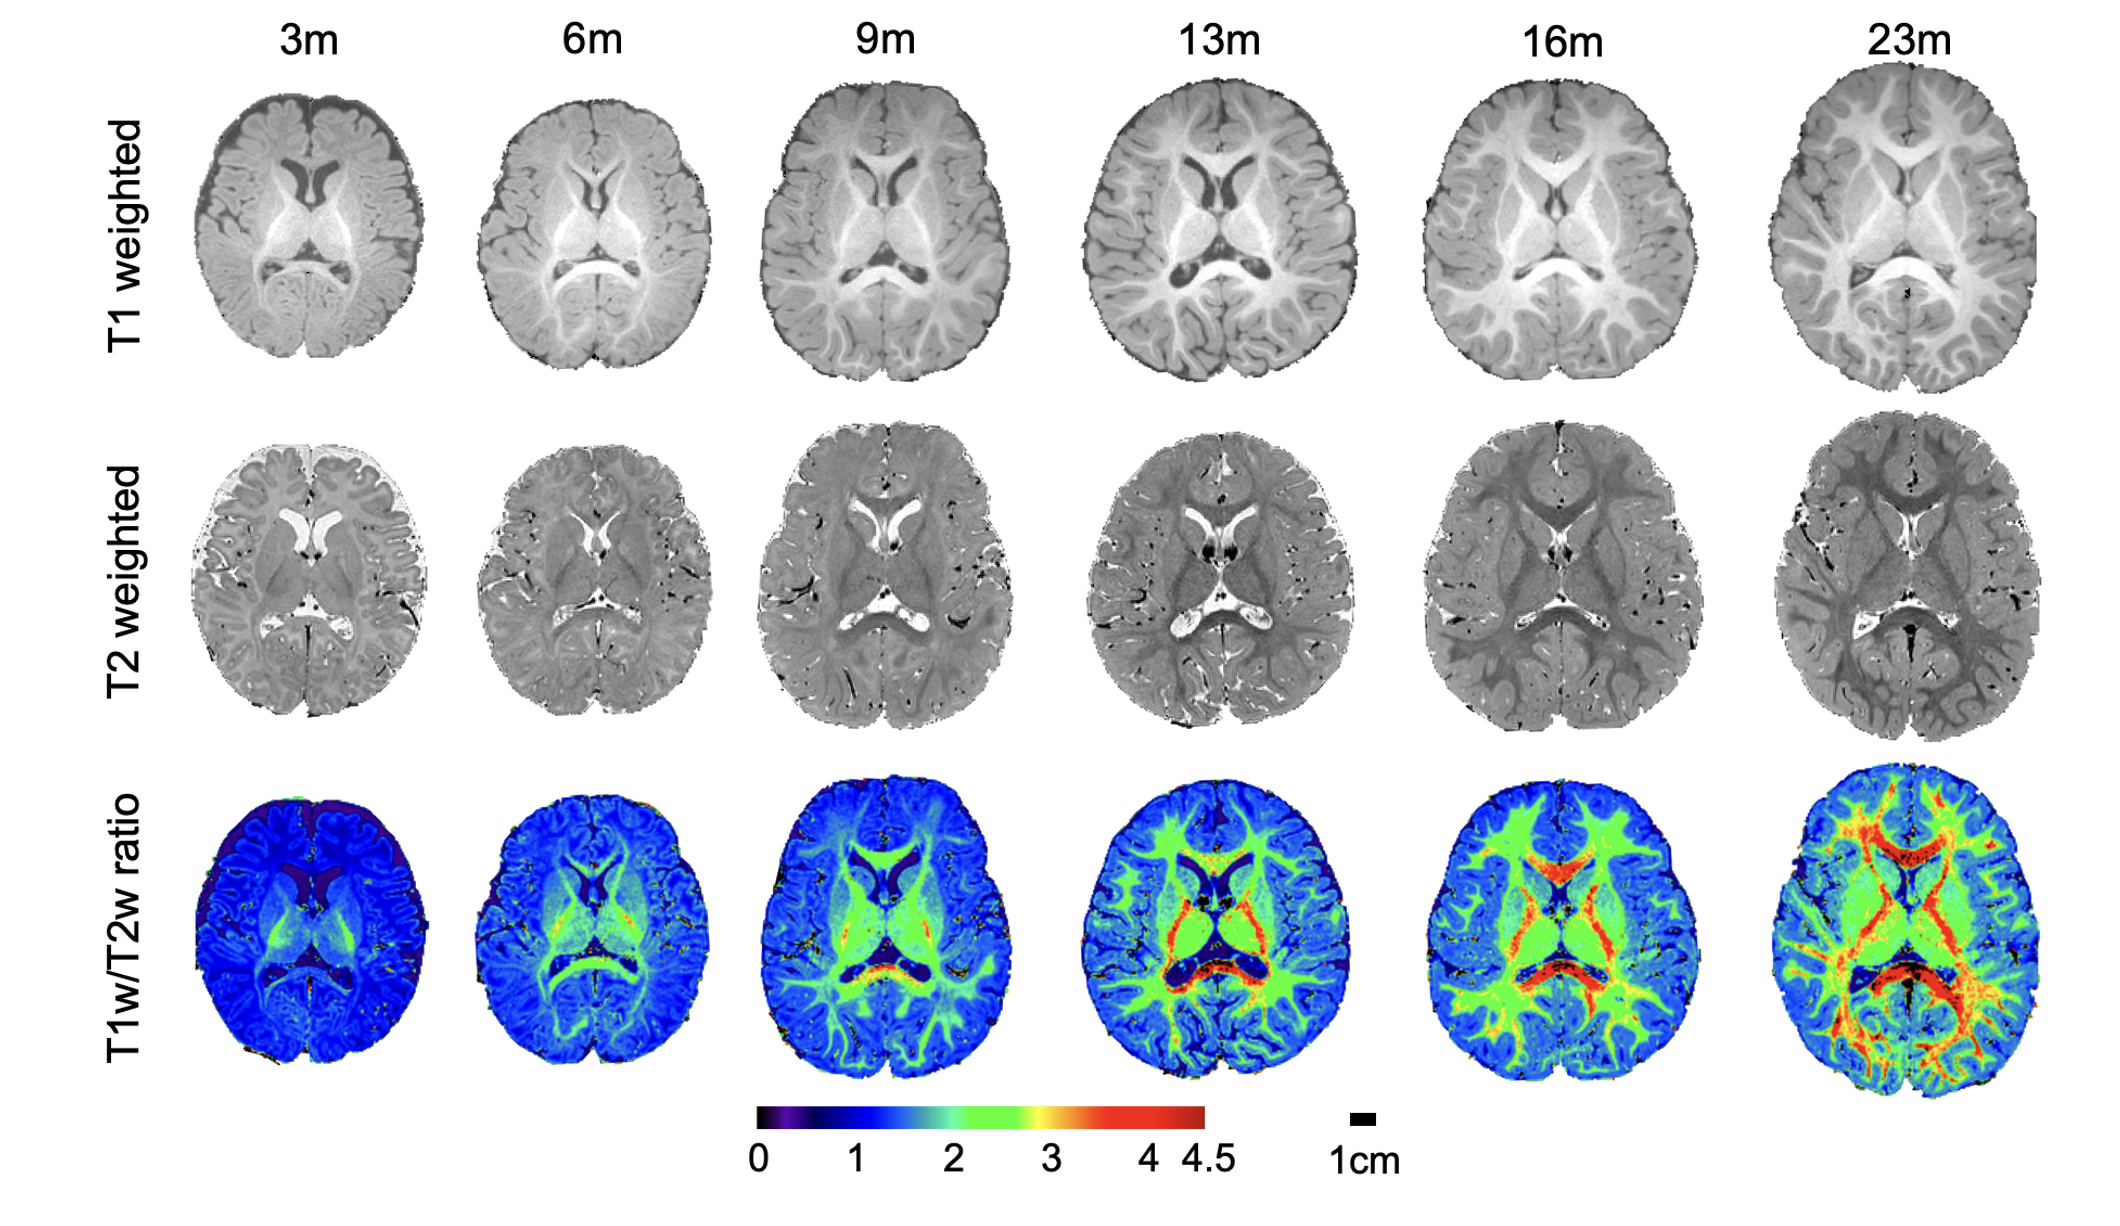
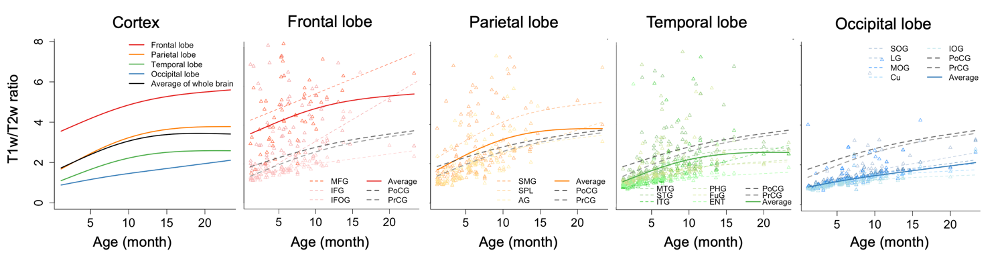
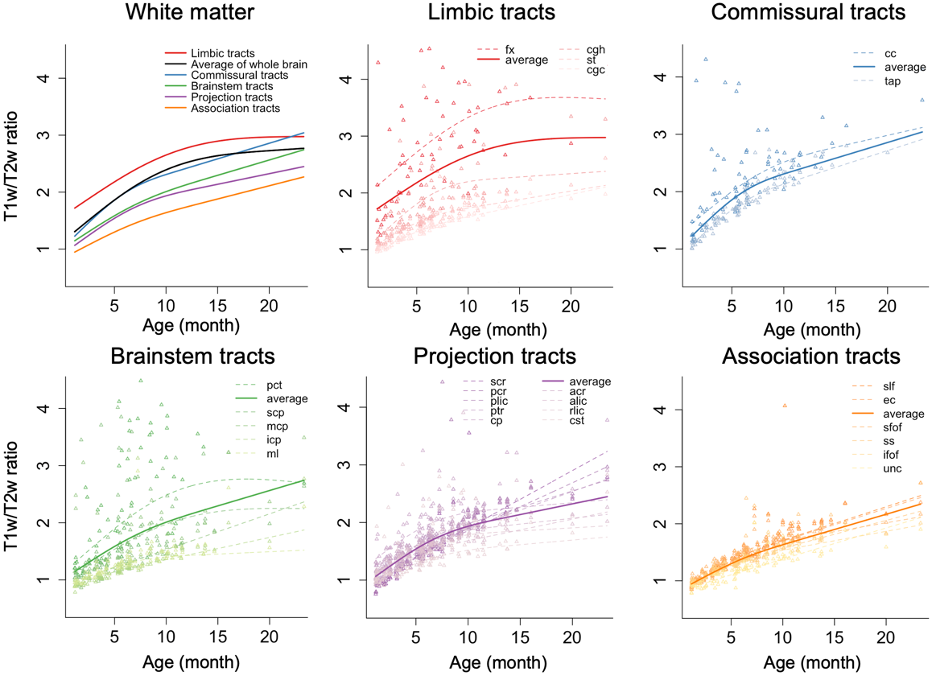
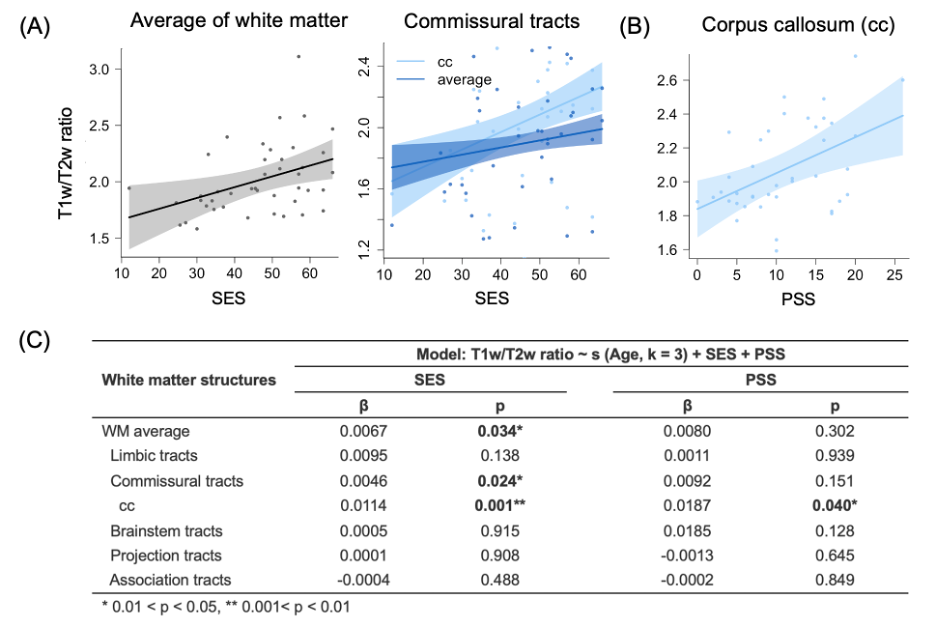
Fig. 1 illustrates the structural images of the developing brain at milestone ages during human infancy. The increase in myelin content across the developmental period is readily appreciated in the T1w/T2w ratio maps. Heterogeneous myelin distribution across the cortex and white matter regions can also be demonstrated. Fig. 2 details the significant and differential cortical myelination changes in all cortical regions for 1-24 months. Notably, the maturation obeys a particular pattern, with the frontal lobe exhibiting the highest ratio followed by the parietal, temporal, and occipital lobes, respectively. Within the occipital lobe, ROIs show a consistent rise in T1w/T2w ratios, suggesting a uniform pattern of myelination across the visual processing regions. Trajectories of the precentral and postcentral gyri serve as valuable benchmarks to better recognize different maturation levels. Fig. 3 delineates the progression of WM myelination, indicating significant age-related increases in major WM tract groups over months. The maturation of WM follows the sequence of limbic, commissural, brainstem, projection, and association tract groups. Moreover, WM tract groups exhibit accelerated maturation rates within the initial ten-month period, with the commissural tracts maturing most rapidly within the first five months. Furthermore, we explored the associations between myelination maturation and environmental factors. For cortex structures, the average of the frontal lobe and SMG correlate positively with SES (Fig. 4A), while PHG and SMG correlate negatively with PSS (Fig. 4B). For WM structures, the average of whole WM, cc, and the average of commissural tract group exhibit significant positive relationships with SES. Concomitantly, cc is also positively associated with the increasing PSS, as shown in Fig. 5A and B.Conclusion
We presented comprehensive and differential trajectories of myelination maturation in 1-24 months infants. Distinctive patterns were shown across cortical and WM regions. Frontal lobe myelination is the highest, followed by parietal, temporal, and occipital lobes. WM matures in a limbic-to-association-tract gradient, with a notable acceleration in the first 10 months. Additionally, the examined relationships between myelination and socioeconomic and stress status provide invaluable insight into the significant impact of environmental effects on infants’ brain development.Acknowledgements
This study is funded by NIH R01MH092535, R01MH125333, R01EB031284, R01MH129981, R21MH123930 and P50HD105354.References
- Fields, R. D. White matter in learning, cognition and psychiatric disorders. Trends in Neurosciences 31, 361–370 (2008).
- Grotheer, M. et al. White matter myelination during early infancy is linked to spatial gradients and myelin content at birth. Nat Commun 13, 997 (2022).
- Huang, H. et al. White and gray matter development in human fetal, newborn and pediatric brains. NeuroImage 33, 27–38 (2006).
- Ouyang, M., Dubois, J., Yu, Q., Mukherjee, P. & Huang, H. Delineation of early brain development from fetuses to infants with diffusion MRI and beyond. NeuroImage 185, 836–850 (2019).
- Huang, H. Imaging the Infant Brain. in Oxford Research Encyclopedia of Psychology (Oxford University Press, 2022). doi:10.1093/acrefore/9780190236557.013.820.
- Ouyang, M. et al. Atypical age‐dependent effects of autism on white matter microstructure in children of 2–7 years. Human Brain Mapping 37, 819–832 (2016).
- Ouyang, M. et al. Differential cortical microstructural maturation in the preterm human brain with diffusion kurtosis and tensor imaging. Proc. Natl. Acad. Sci. U.S.A. 116, 4681–4688 (2019).
- Rowitch, D. H. & Kriegstein, A. R. Developmental genetics of vertebrate glial–cell specification. Nature 468, 214–222 (2010).
- Jednoróg, K. et al. The Influence of Socioeconomic Status on Children’s Brain Structure. PLoS ONE 7, e42486 (2012).
- Talge, N. M., Neal, C., Glover, V., & the Early Stress, Translational Research and Prevention Science Network: Fetal and Neonatal Experience on Child and Adolescent Mental Health. Antenatal maternal stress and long‐term effects on child neurodevelopment: how and why? Child Psychology Psychiatry 48, 245–261 (2007).
- Jenkinson, M., Bannister, P., Brady, M. & Smith, S. Improved Optimization for the Robust and Accurate Linear Registration and Motion Correction of Brain Images. NeuroImage 17, 825–841 (2002).
- Avants, B., Epstein, C., Grossman, M. & Gee, J. Symmetric diffeomorphic image registration with cross-correlation: Evaluating automated labeling of elderly and neurodegenerative brain. Medical Image Analysis 12, 26–41 (2008).
- Glasser, M. F. & Van Essen, D. C. Mapping Human Cortical Areas In Vivo Based on Myelin Content as Revealed by T1- and T2-Weighted MRI. J. Neurosci. 31, 11597–11616 (2011).
- Yu, Q. et al. Differential White Matter Maturation from Birth to 8 Years of Age. Cerebral Cortex 30, 2674–2690 (2020).
- Feng, L. et al. Age-specific gray and white matter DTI atlas for human brain at 33, 36 and 39 postmenstrual weeks. NeuroImage 185, 685–698 (2019).
- Hastie, T. & Tibshirani, R. Generalized Additive Models.
- Hollingshead, August de Belmont. Two Factor Index of Social Position. (1957).
- Cohen S, Kamarck T, Mermelstein R. A global measure of perceived stress. J Health Soc Behav. (1983).
Figures