0820
Prenatal fat-water MRI-based body composition reference charts and sexual dimorphism1Department of Radiology, Tel Aviv Sourasky Medical Center, Tel Aviv, Israel, 2Faculty of Medicine, Tel Aviv University, Tel Aviv, Israel, 3Sagol Brain Institute, Tel Aviv Soursaky Medical Center, Tel Aviv, Israel, 4The Hebrew University of Jerusalem, Jerusalem, Israel, 5Sagol school of neuroscience, Tel Aviv University, Tel Aviv, Israel, 6Department of Obstetrics and Gynecology, Lis Hospital for Women, Tel Aviv Sourasky Medical Center, Tel Aviv, Israel, 7Department of Pediatrics, Dana Dwek Children's Hospital, Tel Aviv Sourasky Medical Center, Tel Aviv, Israel, 8School of Computer Science and Engineering, The Hebrew University of Jerusalem, Jerusalem, Israel, 9Neonatal Intensive Care Unit, Dana Dwek Children's Hospital, Tel Aviv Sourasky Medical Center, Tel Aviv, Israel, 10Edmond and Lily Safra Center for Brain Sciences, The Hebrew University of Jerusalem, Jerusalem, Israel, 11Sagol Brain Institute, Tel Aviv Sourasky Medical Center, Tel Aviv, Israel, 12Sagol School of Neuroscience, Tel Aviv University, Tel Aviv, Israel
Synopsis
Keywords: Fetal, Fetus
Motivation: Preterm infants’ nutritional management should aim to replicate the intrauterine body composition. However, intrauterine body composition reference charts are lacking.
Goal(s): We aimed to construct MRI-based intrauterine body mass (BM), fat mass (FM), percent FM (%FM), fat-free mass (FFM), and percent FFM (%FFM) body composition reference charts.
Approach: Fetal body composition was computed from T2-weighted and fat-water images. Body and subcutaneous fat volumes were automatically segmented using neural networks, and BM, FM, %FM, FFM, and %FFM were calculated.
Results: Data of 176 participants with apparently normal singleton fetuses were included. All parameters significantly changed throughout gestation, and differences between sexes were seen.
Impact: MRI-based intrauterine BM, FM and FFM body composition reference charts may be used as reference for appropriate prenatal growth and may assist in nutritional management of preterm infants.
Introduction
Preterm infants face nutritional challenges due to difficulties meeting dietary requirements in a period of rapid intrauterine growth. Malnutrition is presumed to cause subsequent important short- and long-term health impacts including neurologic deficits and higher rates of cardio-metabolic disease.1–3 It is recommended to target the nutritional management of preterm infants to replicate the body composition of an in-utero fetus.4 However, previous growth charts were composed using postnatal preterm infants, which don’t reflect the prenatal environment, and reference charts using intrauterine data are lacking.5,6 Furthermore, sexual dimorphism in body composition is seen across the entire lifespan, including preterm and term newborns.7,8 However, to our knowledge, it was not explored in utero.Methods
Subjects: Retrospective study of participants with apparently normal singleton pregnancies referred to MRI for various clinical indications as outpatients. Fetuses with genetic or structural abnormalities, sonographic estimated fetal weight of <10th or >90th centile, or with poor imaging quality were excluded. A fetal radiologist with >20 years of experience reviewed all the cases to ensure normal imaging without structural abnormalities. Fetal sex was determined based on prenatal sonographic or genetic data whenever available. Pregnancies were dated according to the first-trimester crown-rump length.MRI acquisition: Images were acquired on one of two 3-T MRI scanners (Magnetom Vida or Prisma, Siemens Healthineers). Following fetal neuroimaging, True Fast Imaging with Steady State Free Precession (TruFISP) and T1-weighted two-point Dixon covering the entire fetal body were acquired.
Image postprocessing: Two in-house developed neural networks were used to segment the entire fetal body and subcutaneous fat tissue.9,10 Subtle manual corrections of the fat segmentations were performed as needed by radiologists using ITK-SNAP (V. 3.8).11
Anthropometric analysis: Fetal body mass (BM), fat mass (FM), percent FM (%FM), fat-free mass (FFM) and percent FFM (%FFM) were computed based on the segmentation volumes and previous knowledge: BM=fetal volume (cm3)*1.07+0.9512; FM=subcutaneous fat volume (cm3)*% fat signal fraction (Fat signal intensity [SI)/(Fat SI+Water SI))*adipose tissue density (0.9 g/cm3); %FM=FM/BM; FFM=BM-FM; %FFM=FFM/BM.
Statistical analysis: Statistical analysis was done using SPSS (V.28, IBM Corp., Armonk, NY, USA). Continuous variables were tested for normal distribution using histograms and Q-Q plots. Quantile regression was used to evaluate the association between BM, FM, %FM, FFM, and %FFM and gestational age (GA). Sexual dimorphism was tested using analysis covariates of mean while controlling for GA at the time of scan as a covariate. A p-value of less than 0.05 was considered statistically significant.
Results
Overall, 452 fetuses were included in the study. Of them, 127 (28.1%) were excluded due to structural findings, 58 (12.8%) due to genetic abnormalities, and 93 (20.1%) due to poor imaging quality or segmentation results. BM, FM, %FM, FFM, and %FFM were calculated for 176 singleton fetuses. The mean GA was 33.63±1.59 weeks (range 30-36+6 weeks). The sex of 26 fetuses was unknown; 81 (54.7%) were females, and 69 (46.3%) were male.Fetal BM, FM, %FM, and FFM significantly increased throughout gestation (P<0.001). Subsequently, %FFM significantly decreases (P<0.001). Fig. 1 depicts the changes in body composition parameters with GA. Along the 50th centile, there was an increase of 178.51g in fetal BM, 38.81g in FM, 1.05% in %FM, and 145.4g in FFM per gestation week. %FFM decreased by 1.05% per week.
Male fetuses had a higher BM (2203.25±394g vs. 2105.75±392.12g, P=0.005), smaller %FM (10.37±2.95% vs. 12±2.85%, P=0.004), and higher %FFM (89.62±2.95% vs. 87.99±2.85%, P=0.004). The absolute FFM was higher among male subjects (1967.03±313.51g vs. 1846.76±314.08g, P<0.001); no significant differences in FM were observed between males and females (236.22±95.39g vs. 258.99±96.28g, P=0.546).
Discussion
In this study, we provide growth charts of apparently normal fetuses anthropometric changes, and demonstrated differences between sexes.Fetal BM, FM, %FM, and FFM increased throughout gestation, as demonstrated in previous studies.5,6, 9,13 However, more data is needed to compare our prenatal data with postnatal preterm growth curves.
Furthermore, our findings demonstrate intrauterine differences between male and female body composition, mainly larger BM and lower %FM among males. These results align with previous studies on preterm and term infants that showed similar anthropometric differences.7,8
Conclusion
To our knowledge, these are the first intrauterine FM and FFM body composition reference charts. These charts propose a reference for appropriate prenatal and preterm growth that may assist in nutritional management and possibly reduce adverse neurologic and metabolic impairments. There are anthropometric differences between male and female fetuses that align with previous studies.Acknowledgements
The authors would like to thank the participants of this study and the MRI radiographers for scanning the participants. We wish good health to all study participants and their newborns.References
1. van Beijsterveldt, I. A. L. P., de Fluiter, K. S., Breij, L. M., van der Steen, M. & Hokken-Koelega, A. C. S. Fat mass and fat-free mass track from infancy to childhood: New insights in body composition programming in early life. Obesity (Silver Spring). 29, 1899–1906 (2021).
2. Santos, S. et al. Subcutaneous fat mass in infancy and cardiovascular risk factors at school-age: The generation R study. Obesity (Silver Spring). 24, 424–429 (2016).
3. Coviello, C. et al. Effects of early nutrition and growth on brain volumes, white matter microstructure, and neurodevelopmental outcome in preterm newborns. Pediatr. Res. 83, 102–110 (2018). 4. Kleinman, R. E., Greer, F. R. & Nutrition, A. A. of P. C. on. Pediatric nutrition. (American Academy of Pediatrics Elk Grove Village, IL, 2014).
5. Ramel, S. E., Gray, H. L., Davern, B. A. & Demerath, E. W. Body composition at birth in preterm infants between 30 and 36 weeks gestation. Pediatr. Obes. 10, 45–51 (2015).
6. Demerath, E. W. et al. New body composition reference charts for preterm infants. Am. J. Clin. Nutr. 105, 70–77 (2017).
7. Davis, S. M. et al. Sex differences in infant body composition emerge in the first 5 months of life. J. Pediatr. Endocrinol. Metab. 32, 1235–1239 (2019).
8. Villar, J. et al. Body composition at birth and its relationship with neonatal anthropometric ratios: the newborn body composition study of the INTERGROWTH-21(st) project. Pediatr. Res. 82, 305–316 (2017).
9. Specktor-Fadida, B. et al. Deep learning-based segmentation of whole-body fetal MRI and fetal weight estimation: assessing performance, repeatability, and reproducibility. Eur. Radiol. (2023) doi:10.1007/s00330-023-10038-y.
10. Avisdris, N. et al. Automatic fetal fat quantification from MRI. in International Workshop on Preterm, Perinatal and Paediatric Image Analysis 25–37 (Springer, Cham, 2022).
11. Yushkevich, P. A. et al. User-guided 3D active contour segmentation of anatomical structures: significantly improved efficiency and reliability. Neuroimage 31, 1116–1128 (2006).
12. Uotila, J. et al. Magnetic resonance imaging compared to ultrasonography in fetal weight and volume estimation in diabetic and normal pregnancy. Acta Obstet. Gynecol. Scand. 79, 255–259 (2000). 13. Rabinowich, A. et al. Reduced adipose tissue in growth-restricted fetuses using quantitative analysis of magnetic resonance images. Eur. Radiol. (2023) doi:10.1007/s00330-023-09855-y.
Figures
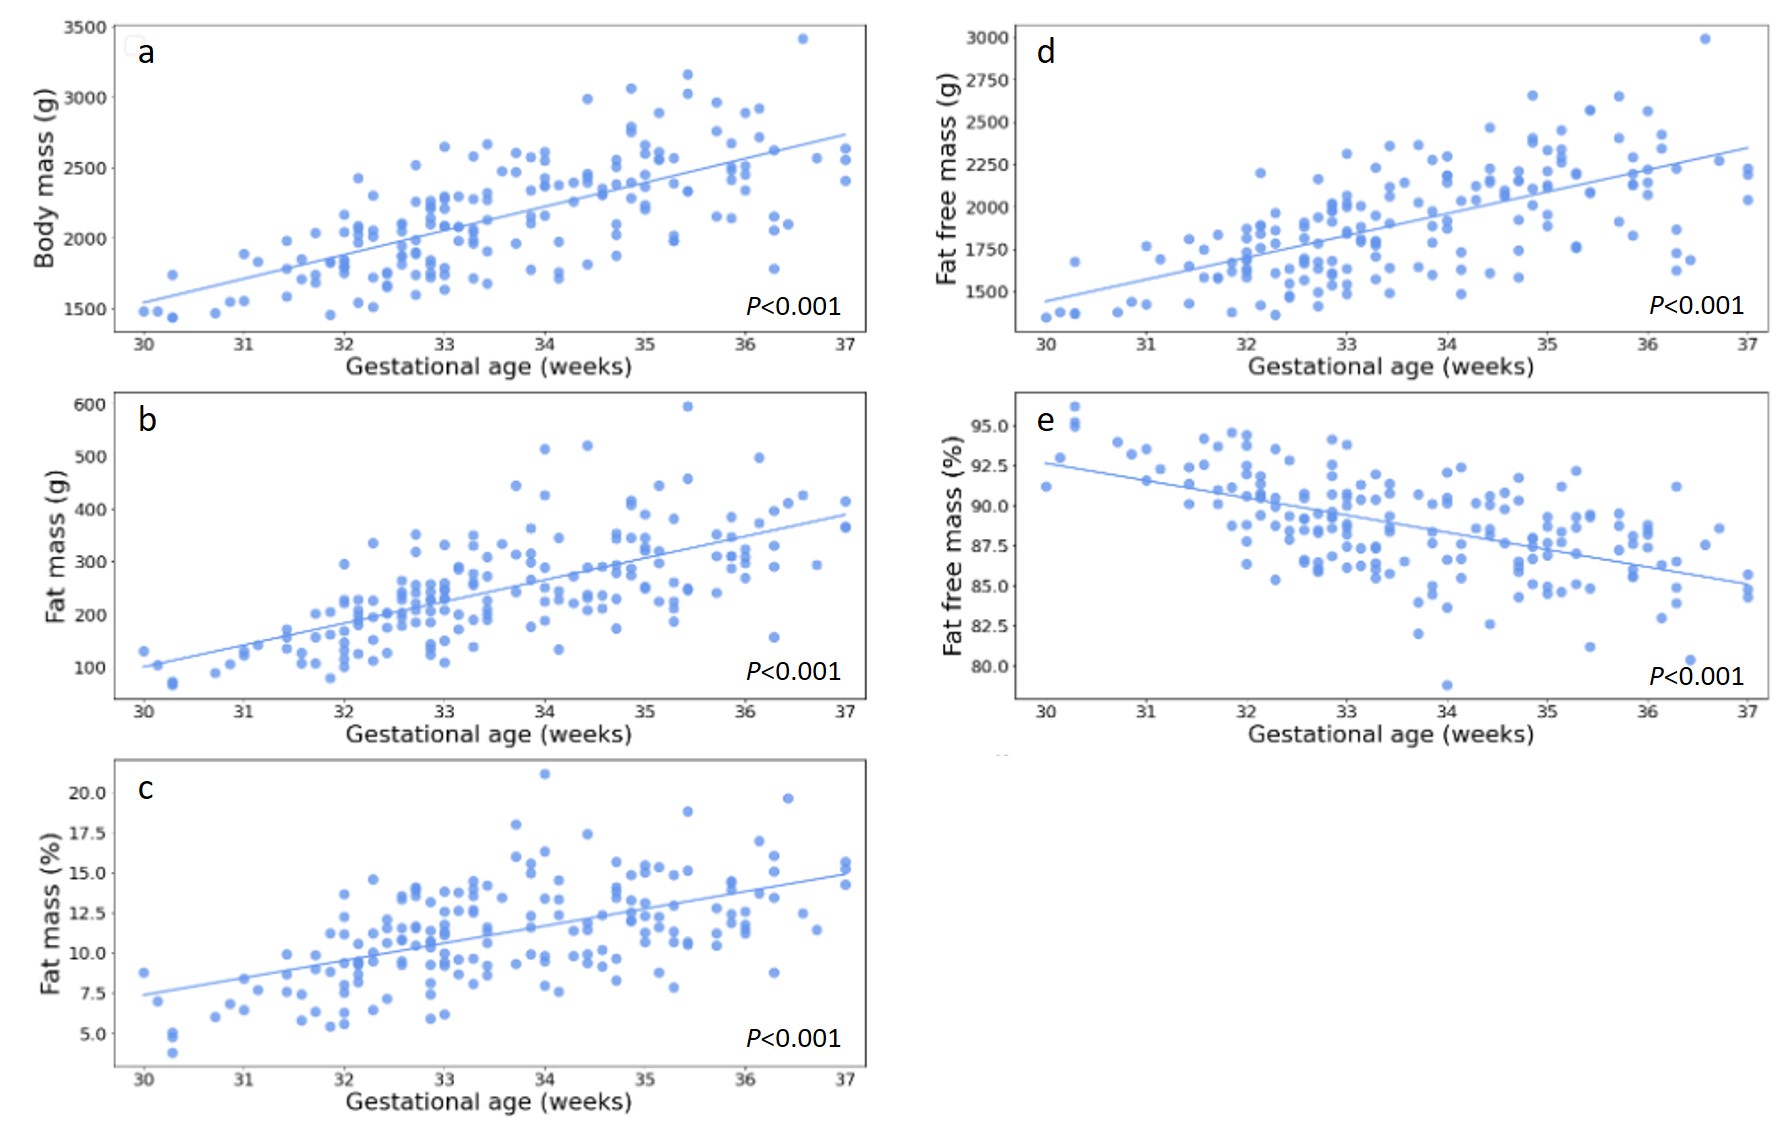
Fig 1. Changes in body composition from 30 to 36+6 weeks of gestation
Individual data points of 176 apparently normal fetuses with the 50th percentile line. There is a significant increase in BM (a), FM (b), %FM (c), and FFM (d) and a significant decrease in %FFM (e) between gestation weeks 30 and 36+6 (P<0.001).
Abbreviations: BM, body mass; FM, fat mass; FFM, fat free mass; %FFM, percent fat free mass; %FM, percent fat mass.
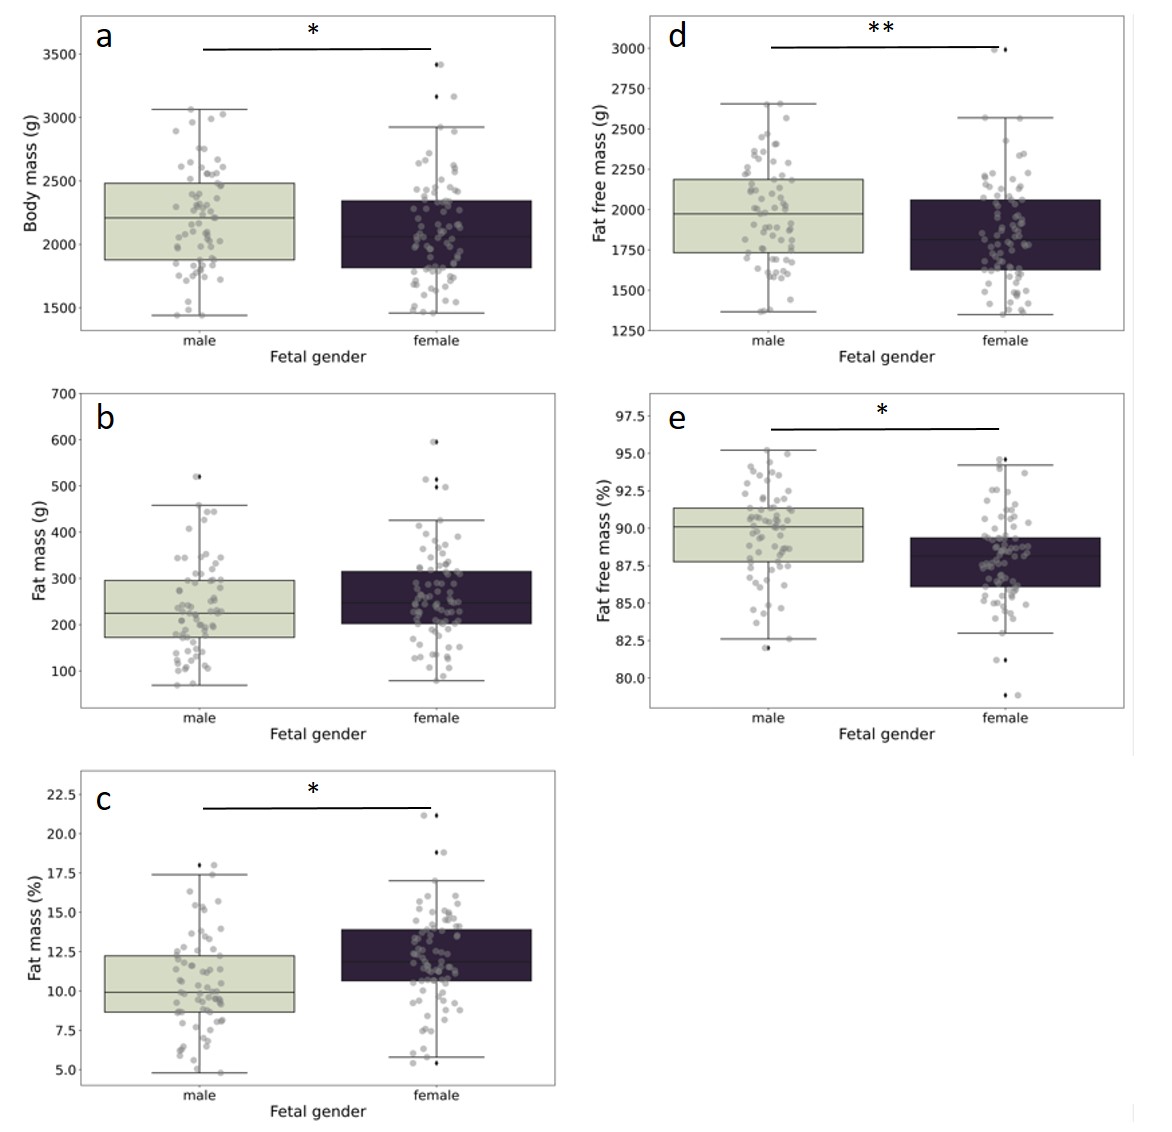
Fig 2. Intrauterine differences in body composition between males and females
Male subjects had a significantly higher BM (a), FFM (d), and %FFM (e). Female subjects had a higher %FM (b). There were no significant differences in FM between males and females (P=0.546).
Abbreviations: BM, body mass; FM, fat mass; FFM, fat free mass; %FFM, percent fat free mass; %FM, percent fat mass. * Indicates P≤0.005 ** Indicates P<0.001