0800
Dynamics of Respiratory Motion in Slow Flow Measurement using Simultaneous Coherent and Incoherent Motion Imaging Method1GE HealthCare, Niskayuna, NY, United States, 2Uniformed Services University of the Health Sciences, Bethesda, MD, United States, 3Walter Reed National Military Medical Center, Bethesda, MD, United States
Synopsis
Keywords: Neurofluids, Neurofluids
Motivation: The impact of respiration on fluid flow in brain parenchyma is poorly understood and remains an on-going research topic in MRI velocimetry.
Goal(s): To analyze the sensitivity of the simultaneous coherent and incoherent motion imaging (SCIMI) method to respiratory-induced phase in the brain parenchyma and to regress this phase contribution from the underlying slow-flow-induced phase.
Approach: Prospectively cardiac-gated SCIMI acquisitions were obtained during three different breathing schemes.
Results: Existence of strong correlations (p<0.005) between the breathing profiles and measured phase in various brain regions indicated the presence of respiration-induced phase in the SCIMI acquisition, and regression of such phases showed promising results.
Impact: This study showed the sensitivity of simultaneous coherent and incoherent motion imaging method to respiration-induced phase in the brain, and an initial attempt to regress such phase accrual from the desired brain slow flows$$$–$$$an important biomarker of glymphatic function.
Introduction
The removal of metabolic waste (produced by awake or active brain) occurs mostly during sleep and a disruption of this restorative slow-flow process can negatively affect neural functions1. Slow flow in the brain - cerebrospinal fluid (CSF), cisterns and subarachnoid spaces - has been shown to be partly driven by respiration2,3. Breathing-related susceptibility changes can also indirectly influence the signal phase in echo planar imaging (EPI)4,5. However, the dynamics of respiration-induced flow in the brain remains poorly understood. Chen, et al. attempted to use simultaneous multi-slice EPI phase contrast imaging to study the dynamics of respiratory-induced flow in the brain as routine cine-phase contrast techniques of flow imaging inherently cannot detect respiratory-related velocity changes as each image has randomized respiratory phase contributions due to sorting within the cardiac cycle6. Recent interest to simultaneously understand the waste removal processes and the microstructures of the gray/white matter has led to the customization of the well-known Stejskal-Tanner diffusion imaging method for simultaneous coherent and incoherent motion imaging (SCIMI) of slow flow in the brain parenchyma using the magnitude and phase information respectively7. Here, we analyze the sensitivity of SCIMI to respiration-induced phase in the brain parenchyma and show an initial attempt to regress such induced phase to obtain a more accurate slow flow measurement$$$-$$$an important biomarker of glymphatic function.Materials and Methods
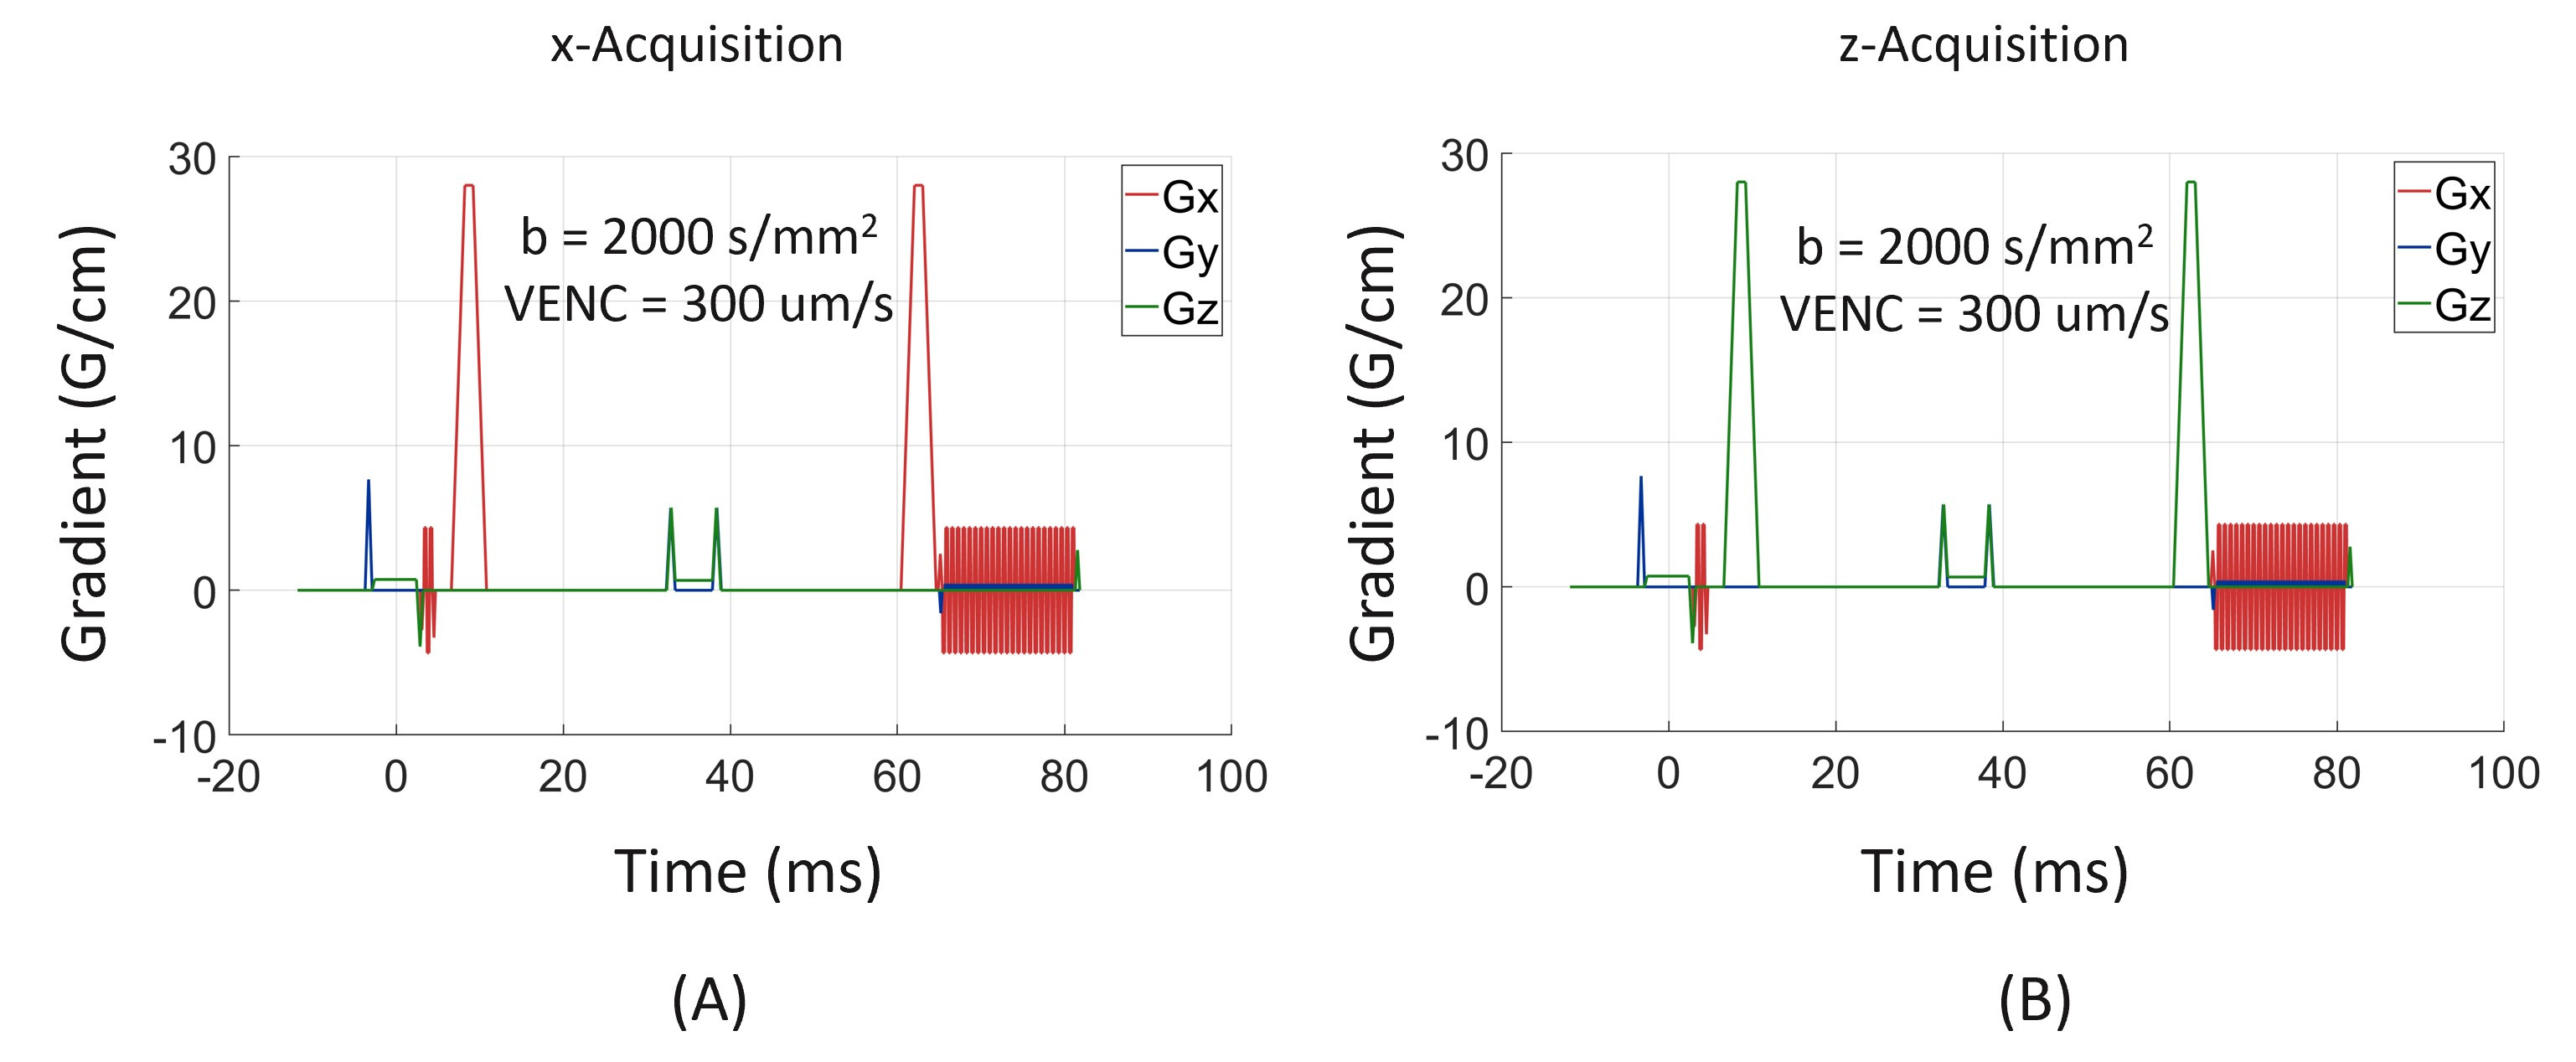
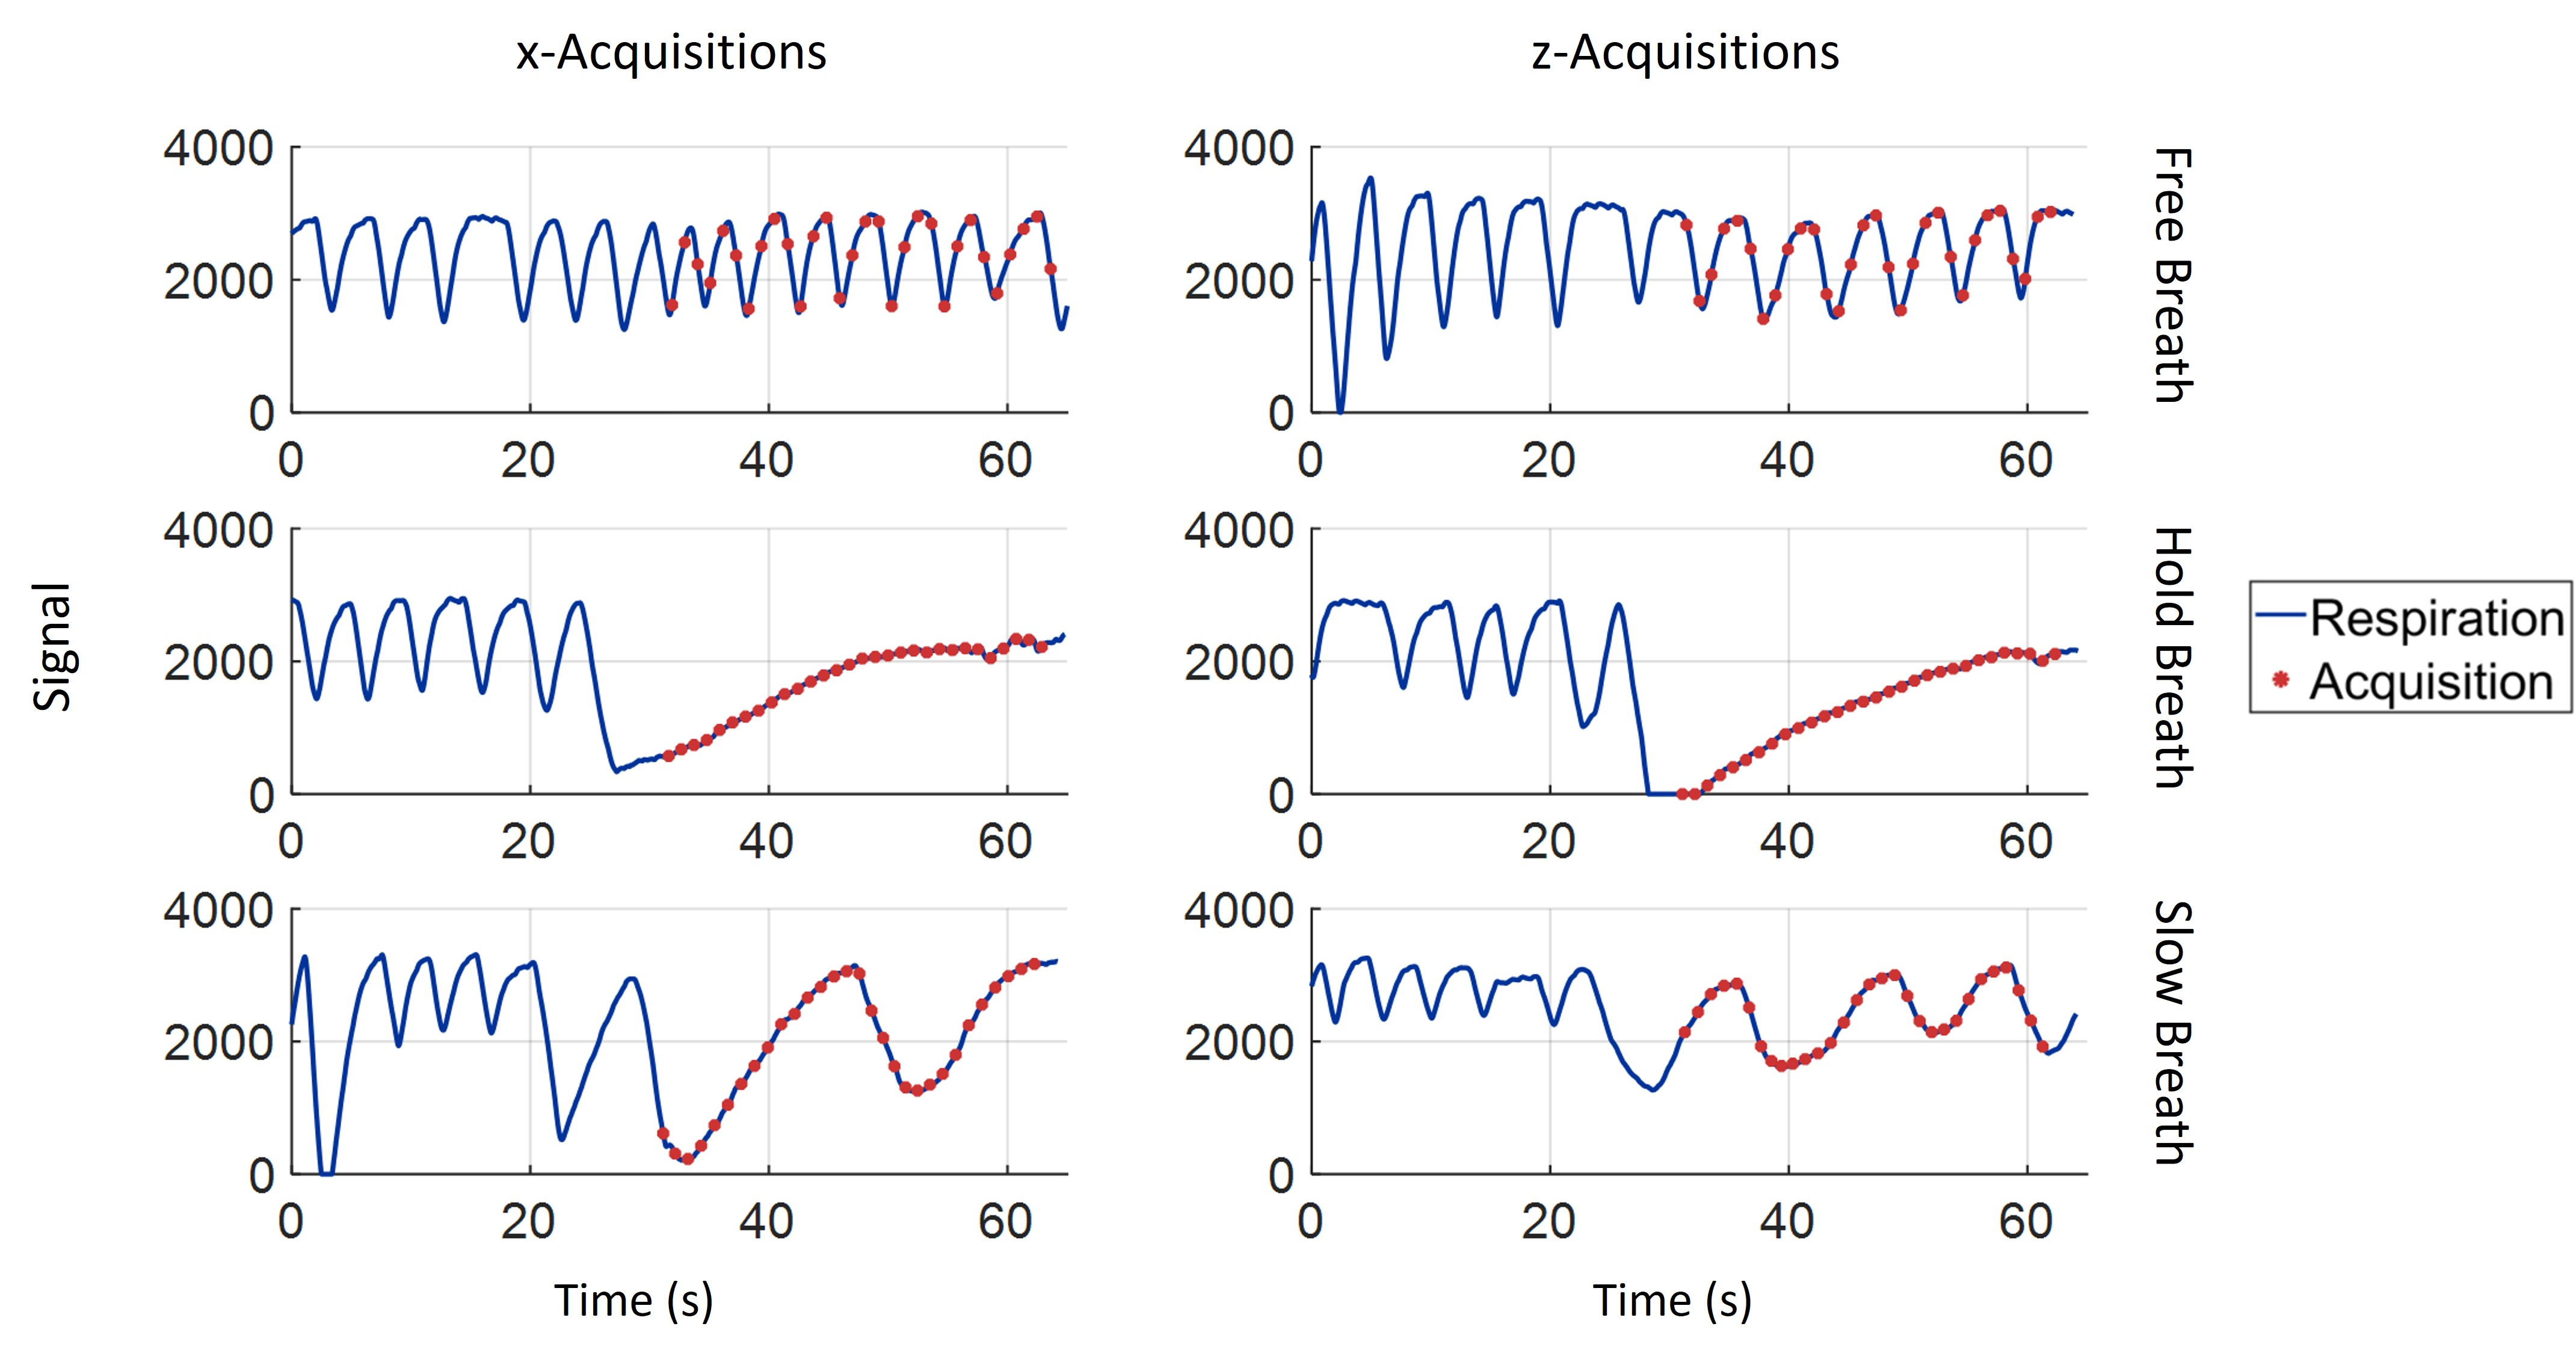
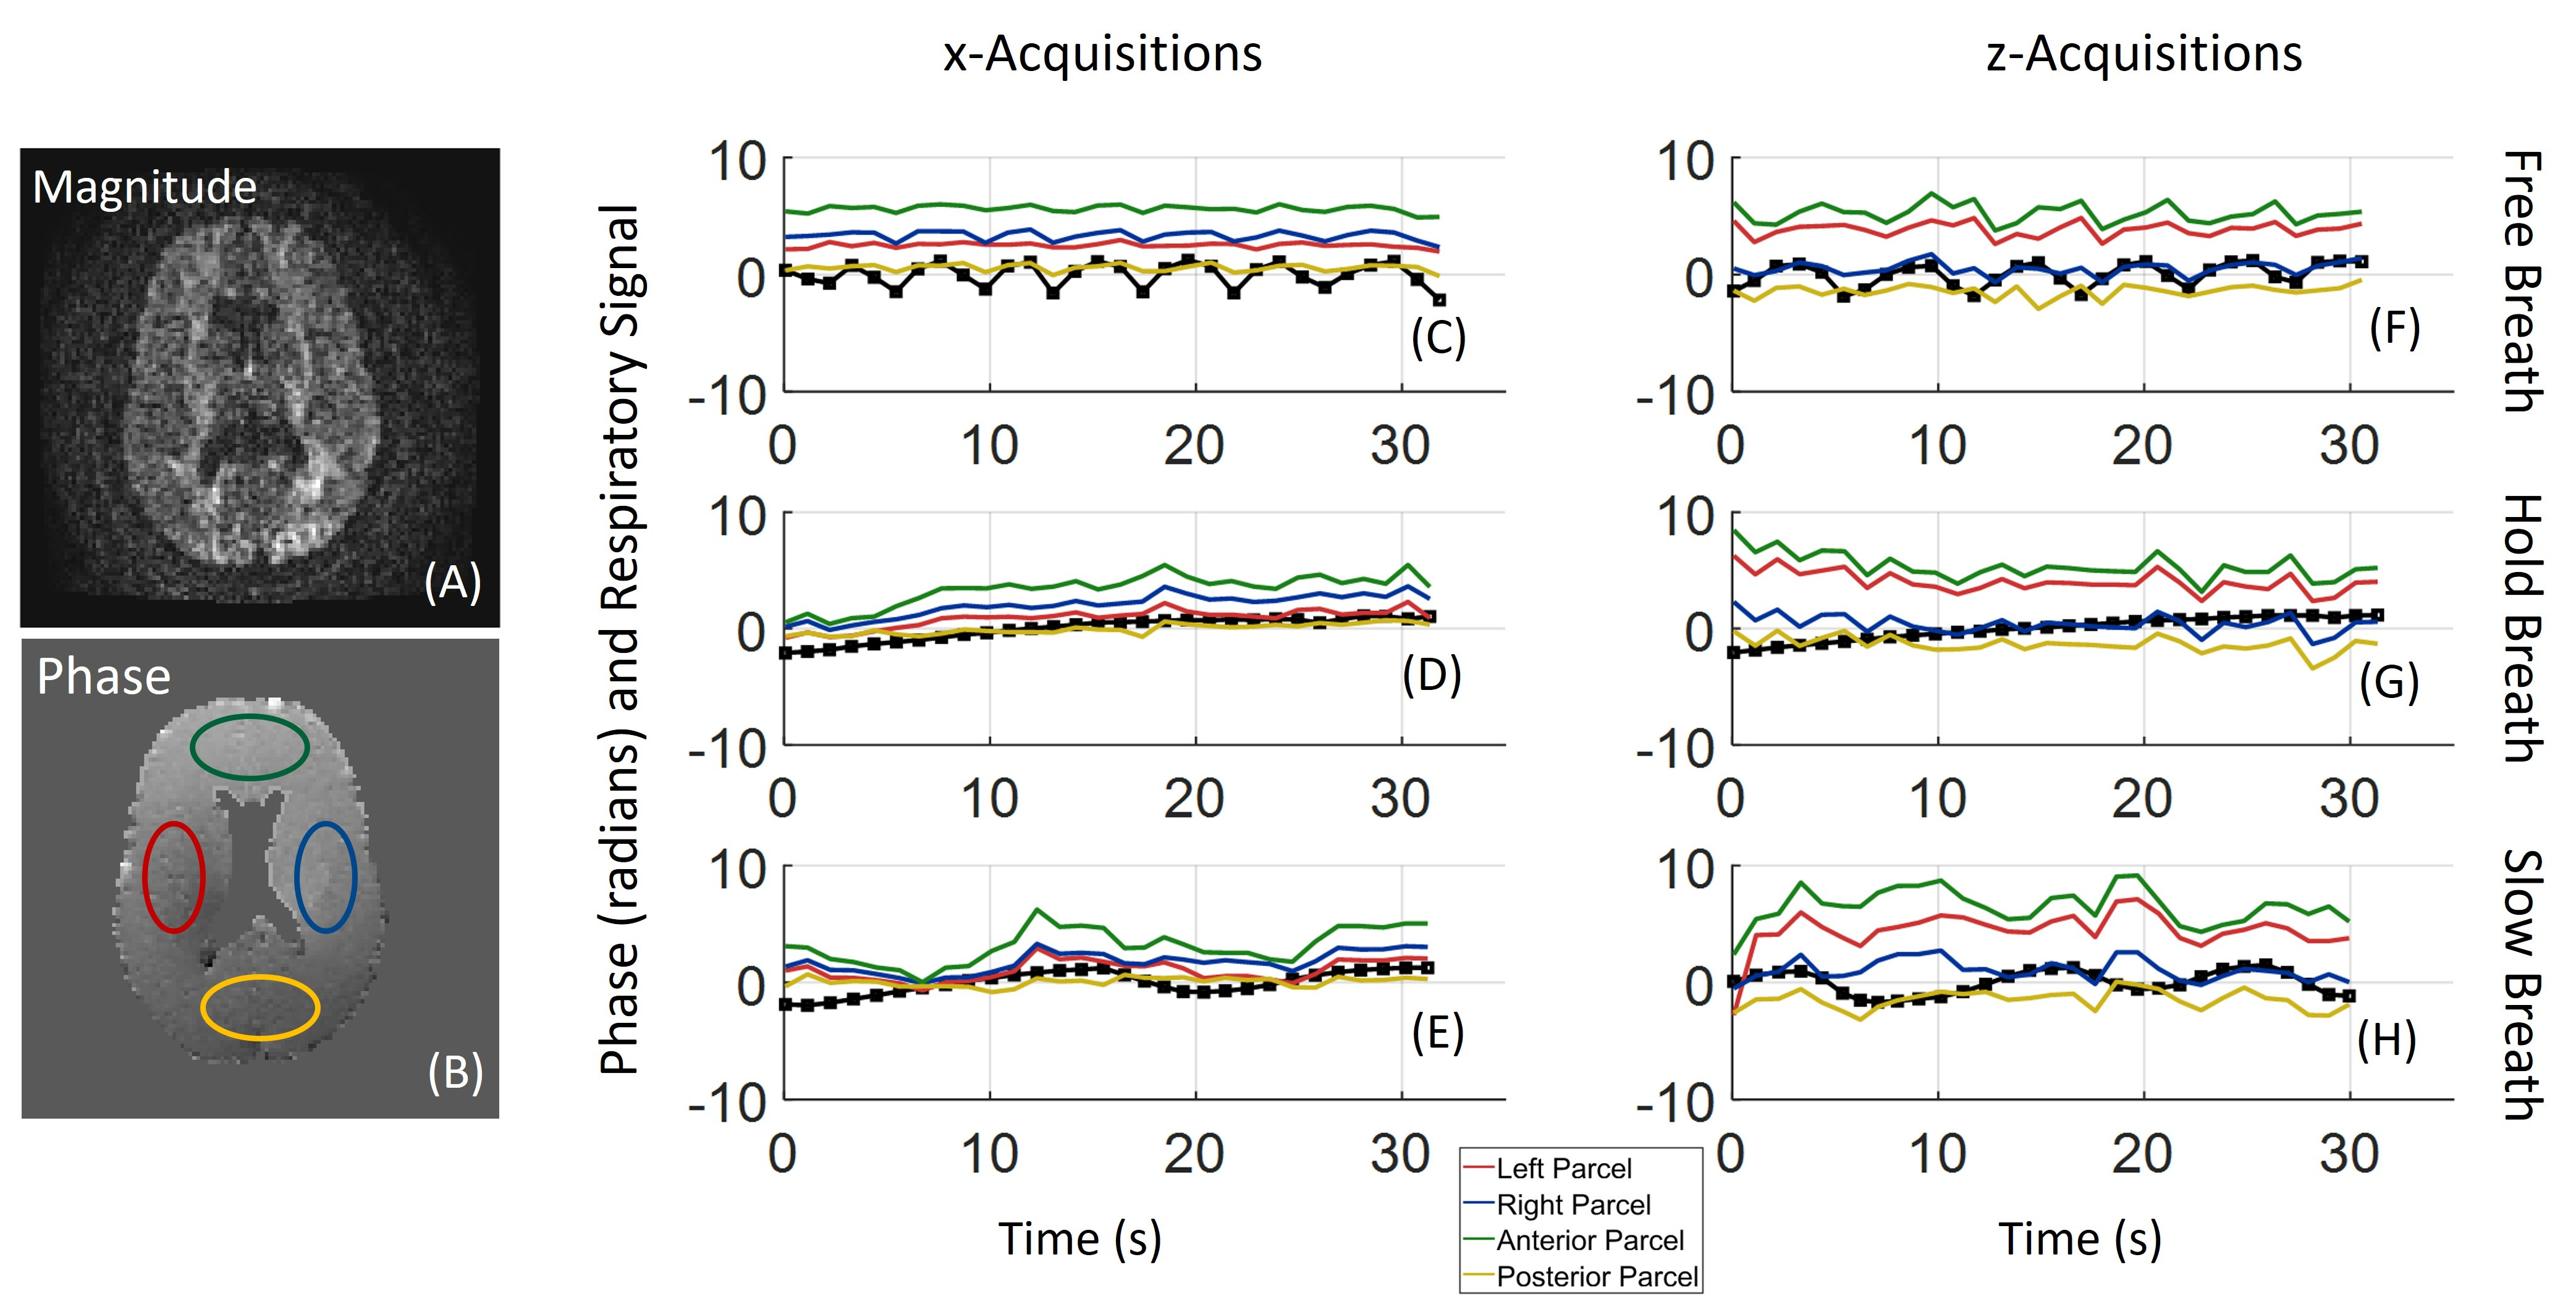
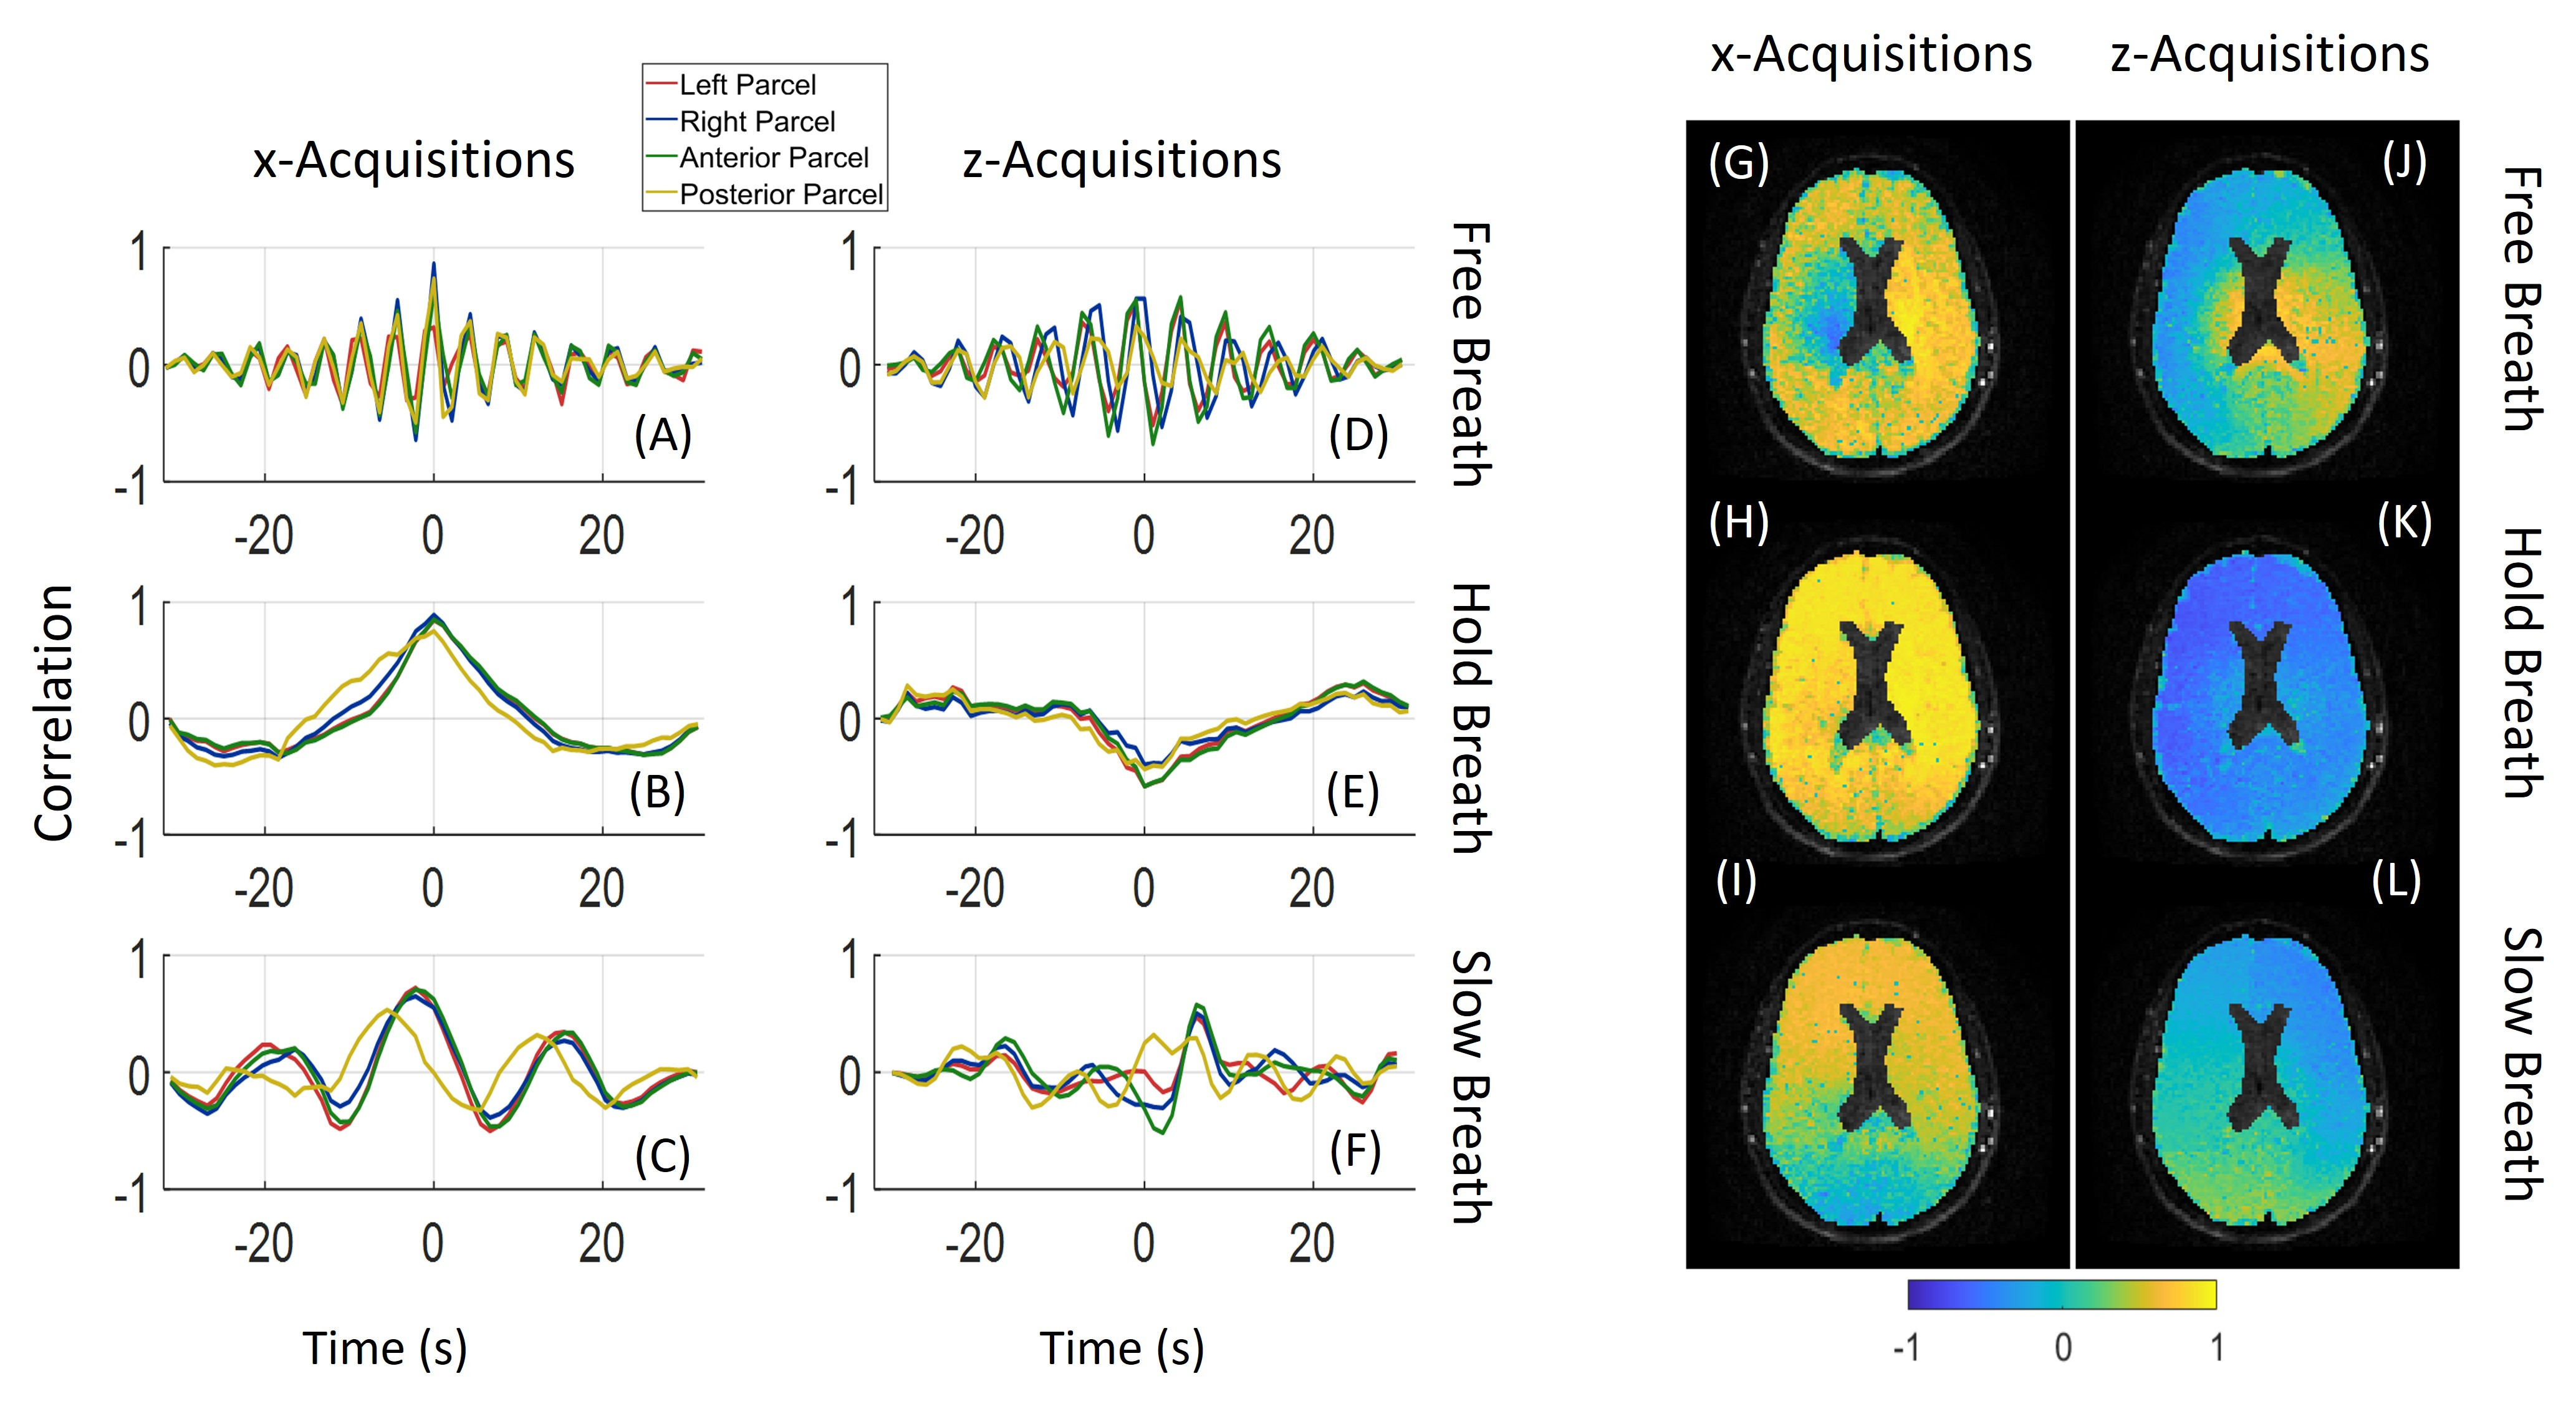
All images were acquired on an MRI scanner equipped with a high-performance gradient system (MAGNUS$$$-$$$GE HealthCare, Waukesha, WI, USA) that can simultaneously deliver a maximum gradient strength (Gmax) and slew rate (SRmax) of 300 mT/m and 750 T/m/s respectively8. RF signal transmission and reception was achieved using an integrated 16-rung birdcage body coil and a 32-channel receiver coil (NOVA Medical Inc. Wilmington, MA, USA) respectively. A SCIMI pulse sequence was designed with a b=2000 s/mm2 and velocity encoding (VENC)=300 um/s (Figure 1). Prospectively cardiac-gated acquisitions were obtained during three breathing schemes (free, hold and slow breath) that were monitored with respiratory bellows. Cardiac pulsation was monitored with a peripheral pulse oximeter plethysmograph. A single q-space encoding vector was measured per R-R interval at peak systole. SCIMI acquisitions were separately carried out in the x (qx) and z (qz) gradient directions, and only 30 q-space vectors were acquired to limit the total scan duration to ~30 s due to breath-hold constraint. For a constant eddy current in each q-space acquisition, each q-vector had identical gradient waveform, and an additional zero-diffusion-weighted reference was acquired. Three volunteers able to hold their breath for 30 s were imaged using SCIMI upon receiving a written informed consent. For each volunteer, 3 axial slices were positioned on the corpus callosum with FOV=24 cm, voxel=2x2x2 mm3 and TE=70.2 ms.SCIMI Reconstruction and Analyses: All acquisitions were reconstructed in MATLAB (MathWorks, Natick, MA, USA) using Orchestra software development kit (GE HealthCare, Waukesha, WI, USA). The phase image of each q-vector acquisition was unwrapped and four parcels in the anterior, posterior, right and left side of the brain were semi-automatically drawn on the first slice. Cross-correlation of the mean phase in each parcel and the respiratory profiles was estimated. Further, a pixel-wise correlation at zero time-lag between the respiratory profile and the phase images was calculated. Lastly, respiration-induced phase was isolated using a generalized linear regression model (GLM) defined as:
$$y=\beta_0+\beta_1x_1+\beta_2x_2 \tag{1}$$
where $$$y=$$$measured phase, $$$x_1=$$$respiratory signal and $$$x_2=$$$third order polynomial.
Results and Discussion
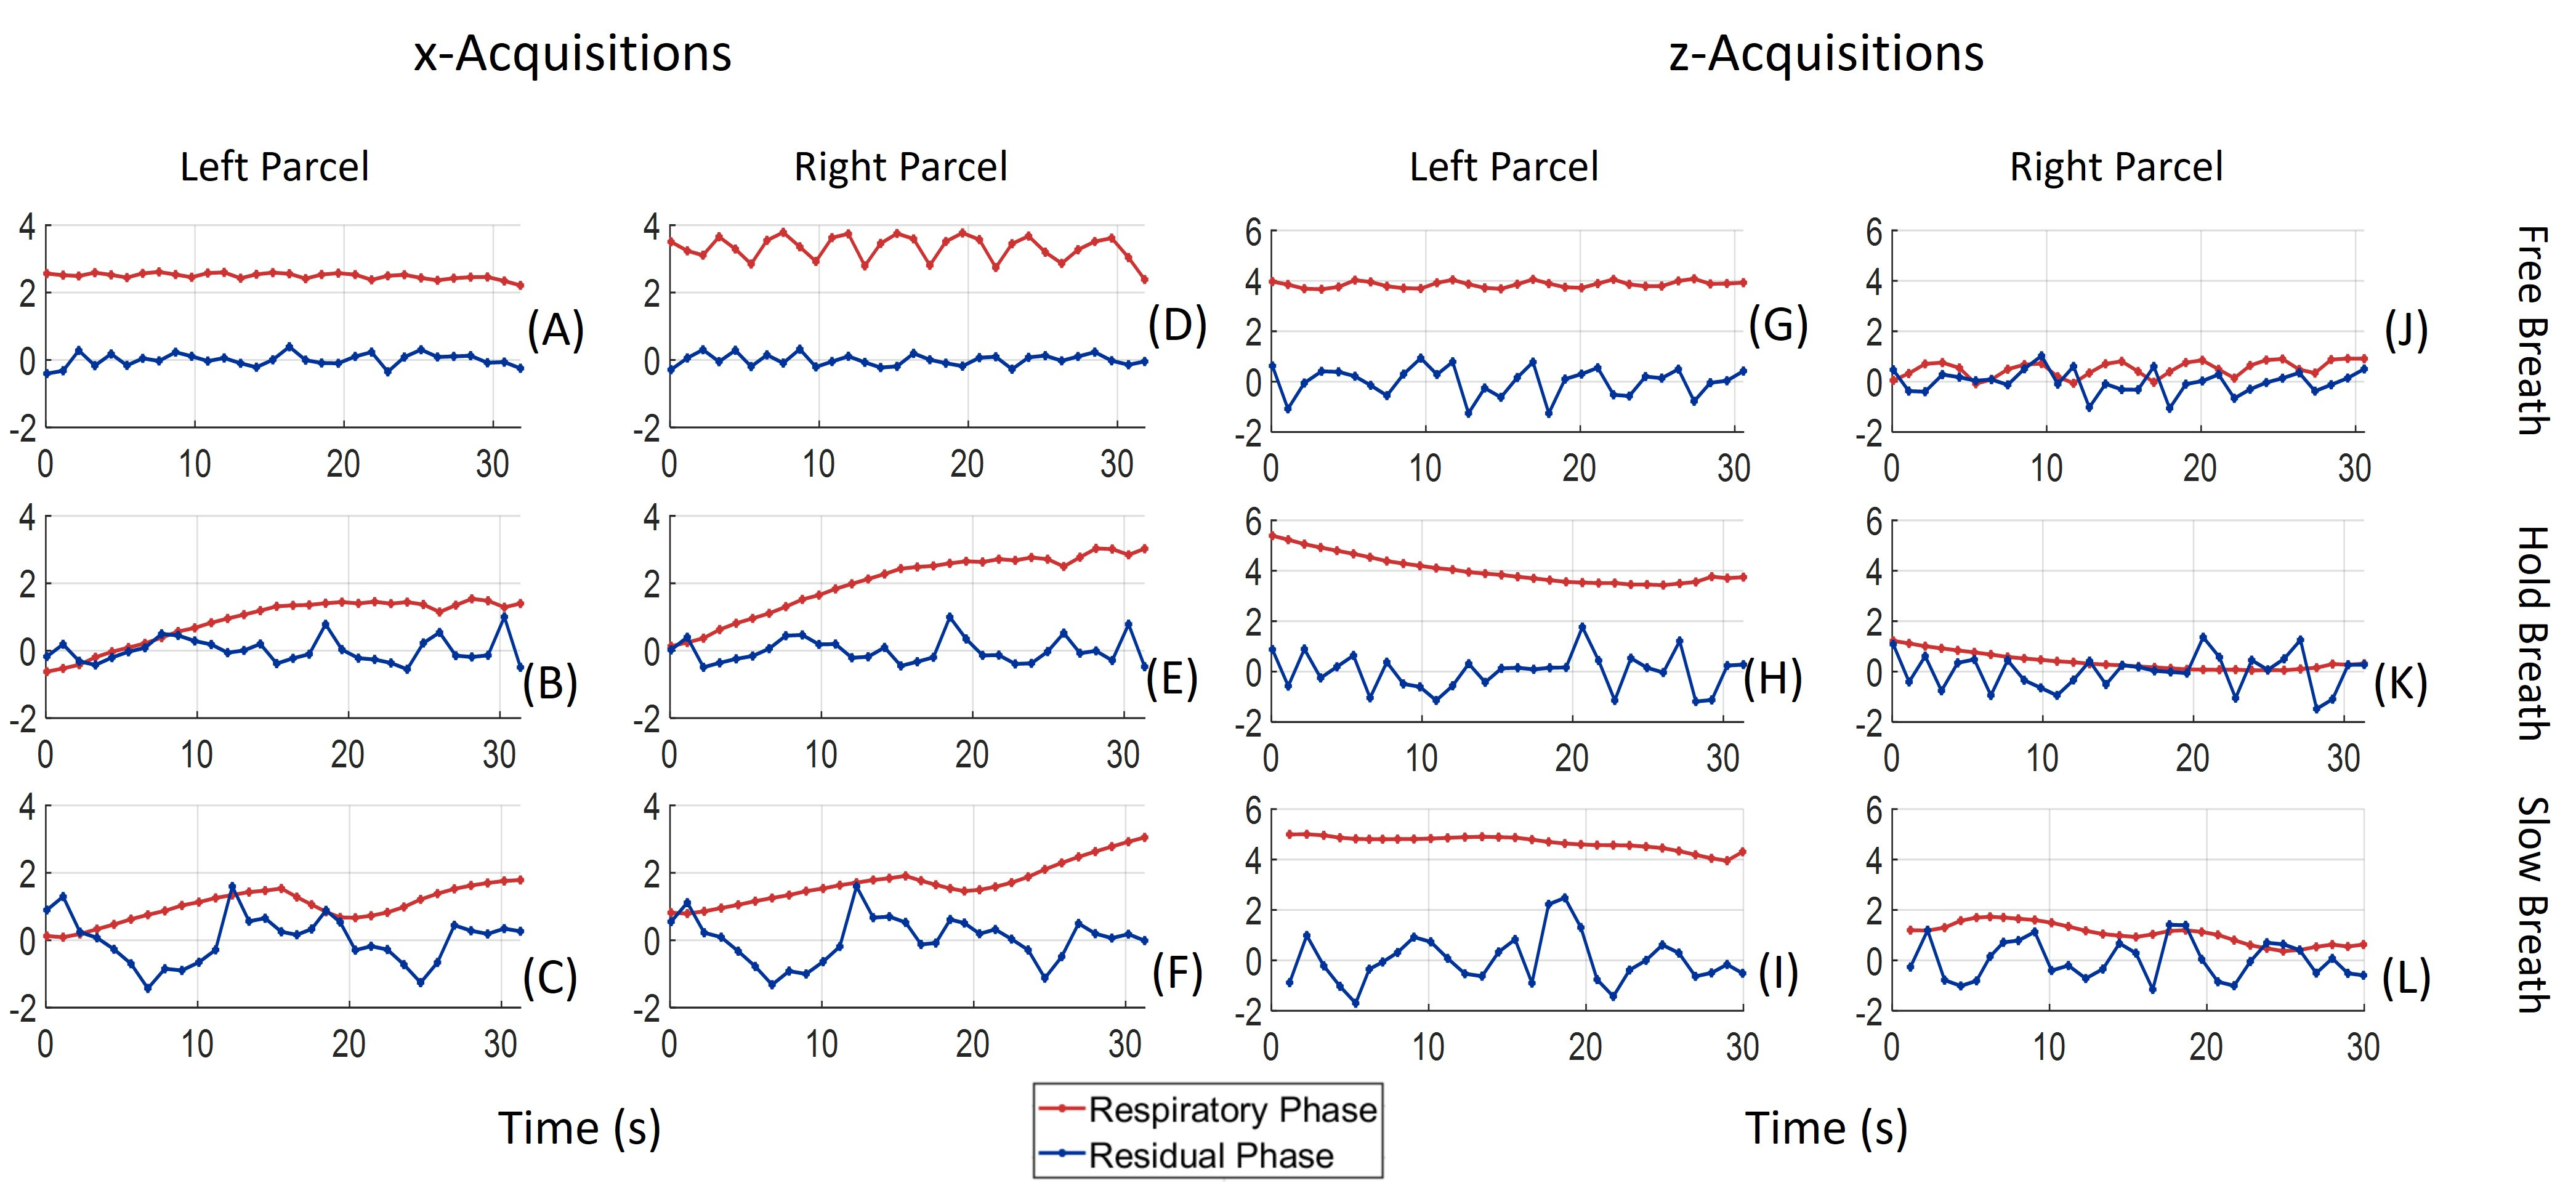
Representative respiratory profiles from a single volunteer show the three breathing profiles and the corresponding acquisition time points (Figure 2). Sample magnitude and phase images for a single q-vector at a single time point are shown in Figure 3. The temporal evolution of the mean phase extracted from the parcels alongside the z-scored respiratory bellow signal are shown for the x and z acquisitions and for all three breathing profiles (Figures 3C-3H). The measured phase has a marked fundamental frequency periodicity equal to that of the respiratory signal as displayed in the cross-correlation analyses plots (Figures 4A-4F). The maximum correlation occurred at zero time-lag for most parcels and breathing schemes. The pixel-wise correlation between the measured phase and the respiratory signal unveiled the spatial distribution of the respiration-induced phase (Figures 4G-4L). Comparatively, a flatter distribution is observed for the breath-hold acquisitions that may indicate a lesser dependence of the measured phase on respiration. The GLM-extracted respiration-induced phase retained the periodicity of the respiratory profile but the residual phase did not (Figure 5).Conclusion
The SCIMI pulse sequence is sensitive to respiration-induced phase, and regression of such phase accruals using GLM promises a more accurate slow-flow measurement in the brain$$$-$$$a result that needs further verification.Acknowledgements
Research reported in this work was supported by the CDMRP under award number: W81XWH-22-2-0038. The opinions and assertions expressed herein are those of the authors and do not reflect the official policy or position of the Uniformed Services University of the Health Sciences, Walter Reed National Military Medical Center, or the Department of Defense.
References
1. Hablitz LM, Nedergaard M. The Glymphatic System: A Novel Component of Fundamental Neurobiology. J Neurosci. 2021 Sep 15;41(37):7698–711.
2. Klose U, Strik C, Kiefer C, Grodd W. Detection of a relation between respiration and CSF pulsation with an echoplanar technique. J Magn Reson Imaging. 2000 Apr;11(4):438–44.
3. Schroth G, Klose U. Cerebrospinal fluid flow. II. Physiology of respiration-related pulsations. Neuroradiology. 1992;35(1):10–5.
4. Raj D, Anderson AW, Gore JC. Respiratory effects in human functional magnetic resonance imaging due to bulk susceptibility changes. Phys Med Biol. 2001 Dec;46(12):3331–40.
5. Raj D, Paley DP, Anderson AW, Kennan RP, Gore JC. A model for susceptibility artefacts from respiration in functional echo-planar magnetic resonance imaging. Phys Med Biol. 2000 Dec;45(12):3809–20.
6. Chen L, Beckett A, Verma A, Feinberg DA. Dynamics of respiratory and cardiac CSF motion revealed with real-time simultaneous multi-slice EPI velocity phase contrast imaging. Neuroimage. 2015 Nov 15;122:281–7.
7. Jansen I, Marinelli L, Tan ET, Shih R, Werner K, Ho VB, et al. Simultaneous Imaging of Diffusion and Coherent Motion in Slow-Flow Compartments in the Brain. In: ISMRM 2020 Annual Proceedings. Virtual; 2020.
8. Foo TKF, Tan ET, Vermilyea ME, Hua Y, Fiveland EW, Piel JE, et al. Highly efficient head-only magnetic field insert gradient coil for achieving simultaneous high gradient amplitude and slew rate at 3.0T (MAGNUS) for brain microstructure imaging. Magnetic Resonance in Medicine. 2020;83(6):2356–69.
Figures