0799
Optimization of Simultaneous Coherent/Incoherent Motion Imaging (SCIMI): Combined Diffusion and Velocimetry for Glymphatic Circulation1GEHC Technology and Innovation Center, Niskayuna, NY, United States, 2Uniformed Services University of the Health Sciences, Bethesda, MD, United States, 3Walter Reed National Military Medical Center, Bethesda, MD, United States
Synopsis
Keywords: Neurofluids, Neurofluids, Glymphatic, MRI Velocimetry, Phase-Sensitive Diffusion
Motivation: To study glymphatic circulation in the brain parenchymal tissue, methods to measure sub-millimeter velocities of fluid flow in tissue must be developed.
Goal(s): We evaluate the feasibility of imaging both coherent and incoherent motion (SCIMI) in brain tissue using phase-sensitive reconstruction of dMRI.
Approach: Approach: By modifying a DTI sequence to achieve physiologically relevant low VENC, we demonstrate the simultaneous reconstruction of diffusion metrics highlighting incoherent motion in the brain and velocity data showing coherent motion by leveraging phase and magnitude information.
Results: We measure velocity maps in the whole brain in conjunction with clinically relevant diffusion metrics.
Impact: SCIMI acquisition and reconstruction of velocity in brain parenchymal tissue shows to be an important addendum that can be run parallel to existing DTI methods and provides novel insights into glymphatic circulation.
Introduction
Glymphatic flow through perivascular spaces in the brain is a topic of significant interest due to its role in disease pathology, sleep homeostasis, age-related changes, and lifestyle choices. SCIMI1,2 (Simultaneous Coherent/Incoherent Motion Imaging) is a technique that was developed for measurement of motion through parenchymal space at sub-millimeter velocities, the range of interest for glymphatic flow. By using both magnitude and phase information contained in dMRI, SCIMI generates relevant diffusion metrics and velocity vectors which are complementary contrasts that can be leveraged for inferences related to changes in in-vivo brain homeostasis non-invasively. In this study, we bring in additional aspects of a diffusion processing pipeline to account for gradient non-linearity and complex volume registration, which are critical to reliable aggregation of longitudinal and cross-site studies.Methods
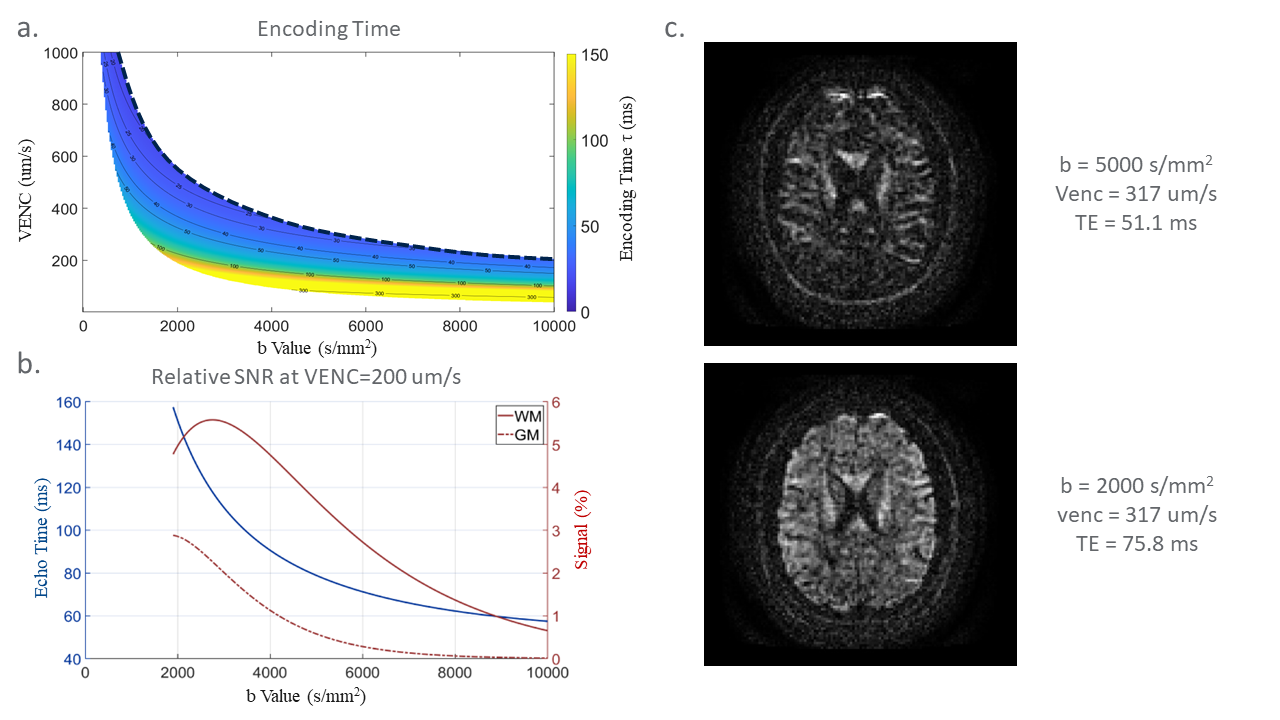
In dMRI, while the magnitude of the signal decay is related to RMS displacement, the phase of the signal encodes bulk velocity, analogous to phase-contrast imaging. Typical parameters for diffusion encoding pulses (b=100-2500 s/mm2) are equivalent to velocity encoding (VENC) in the range of 200-800 um/s. With the distribution of directions in q-space being many times what is required for a 3D velocity vector reconstruction, this allows for fitting of multiple velocity (flow) vectors from a single scan, which can be leveraged to create velocity profiles corresponding to multiple points in the cardiac cycle. The equations describing b-value and VENC as a function of timing parameters can be combined to create the following equation, the solutions of which give values of δ that allow for a b-value and VENC to be simultaneously determined, given a fixed ramp time, r, and gradient strength, G:$$\delta^3+(\frac{r^2}{2}-\frac{3\pi}{\gamma G v_{enc}})\delta+\frac{3b}{\gamma^2 G^2}-\frac{r^3}{10}=0.$$
Figure 1a shows the parameter space of b and VENC, where the encoding time is the time from the beginning of the first encoding trapezoid to the end of the second, agnostic to imaging parameters such as FOV. Within this parameter space, the signal response follows . Figure 1b and 1c shows that for a fixed VENC, the maximum signal does not occur at the minimum TE, but at a lower b-value, and depends on the ratio between T2 and the diffusion coefficient, D, for a given tissue.
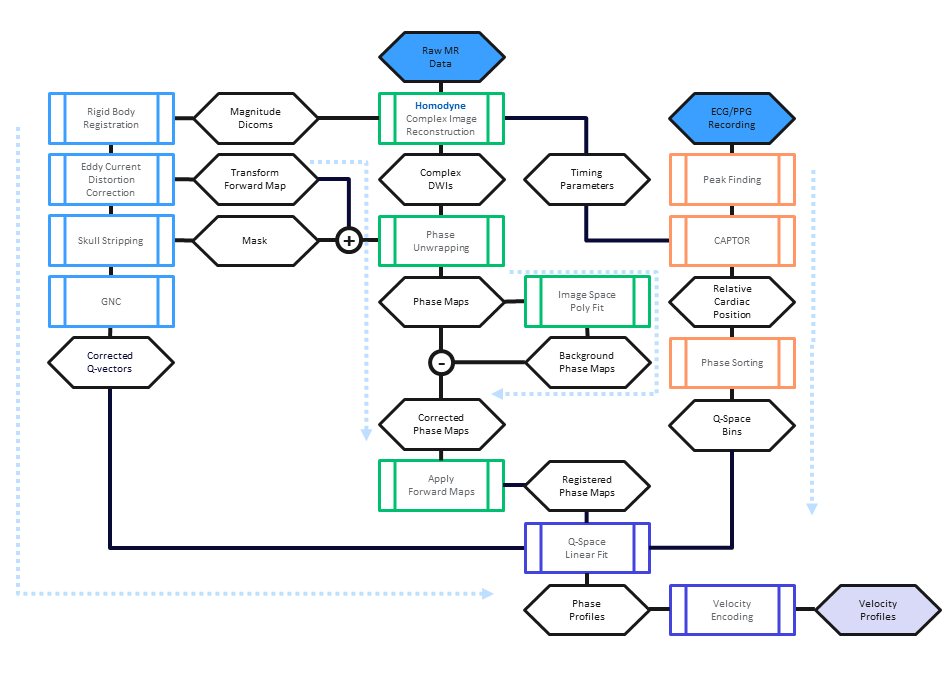
In this study, volunteers were scanned with the 2nd generation MAGNUS platform3 that delivers 300 mT/m and 750 T/m/s using standard clinical 3.0 T system electronics (Signa Premier, GE HealthCare, Waukesha, USA). A phased-array 32-channel head coil (NOVA Medical, Wilmington, MA, USA) was used for all scans. Diffusion encoding pulses were designed according to the framework in Fig 1a for b=2000 and 5000 s/mm2 with VENC=317 mm/s, and b=1500 s/mm2 with VENC=300 mm/s. A synchronized peripheral pulse gating (PPG) signal was recorded for retrospective cardiac binning. Figure 2 details the reconstruction pipeline to generate in-vivo velocity profiles. Diffusion and VENC encoding were corrected for eddy current distortion, bulk motion and susceptibility, and gradient non-linearity for diffusion encoding using a custom image processing pipeline. Forward transform maps from magnitude-based processing were used to register the complex volumes. The original timing parameters of each voxel was tracked such that retrospective cardiac binning was applied according to the true acquisition time of the voxel.
Results & Discussion
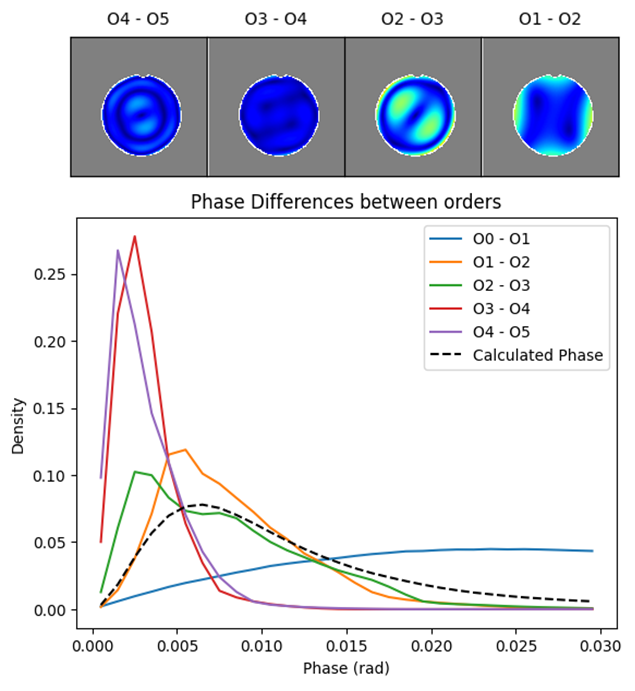
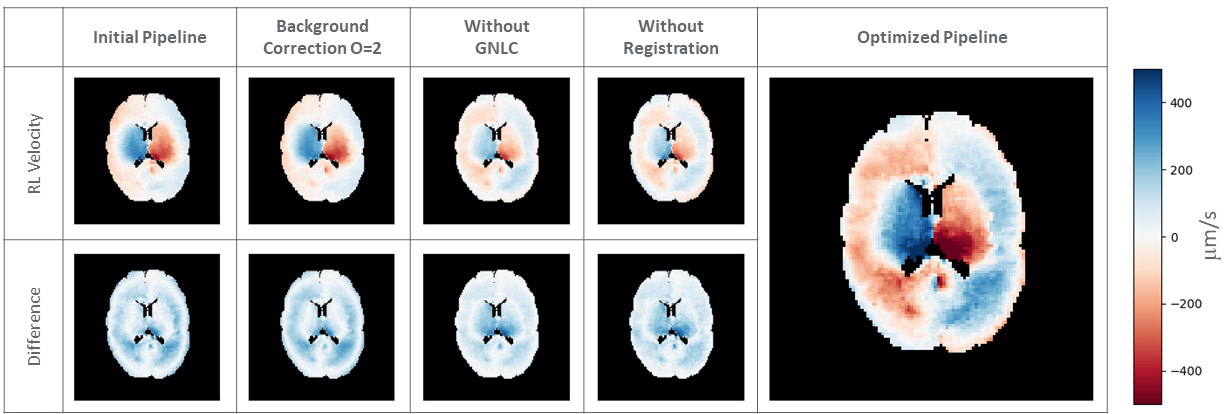
Figure 3 shows an agar phantom scan used to investigate the effect of different orders of phase background correction. The difference between a 2nd, 3rd, and 4th-order correction suggests that a 3rd order correction is needed to fully remove the effects of eddy current on the phase, while a 4th order correction is likely to overfit the data.Figure 4 shows the effect of each stage of the reconstruction pipeline improvement for a scan with b=1500 s/mm2 and VENC=300 mm/s including phase background correction (2nd order vs 3rd order), voxel-specific q-space vectors based on gradient non-linearity, and complex registration of each volume.
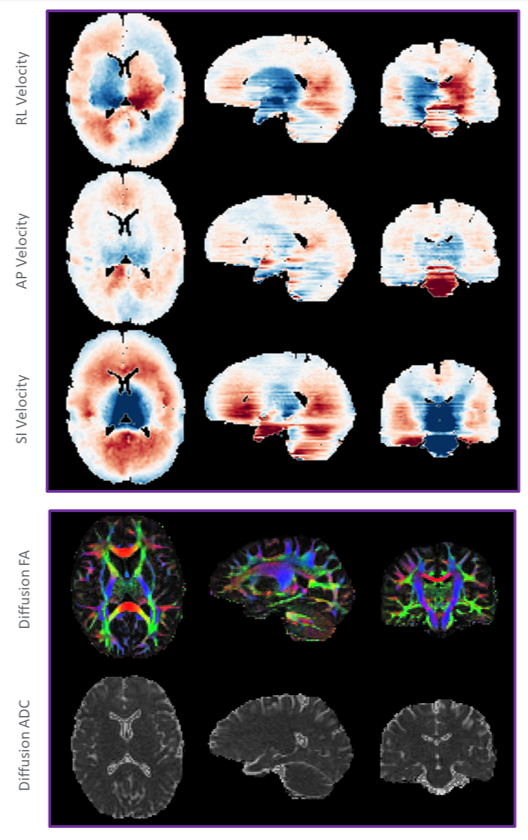
Figure 5 presents a full-brain volume of velocity in the parenchymal tissue alongside conventional reconstruction of the same dataset for fractional anisotropy and diffusion coefficients, for the same scan shown in Figure 4. With the SCIMI framework and reconstruction pipeline, information on both incoherent motion via diffusion and coherent motion over the cardiac cycle in the brain can be obtained in a single scan.
Conclusion
In this work, we present the SCIMI framework and reconstruction of velocity in brain parenchymal tissue. A single scan generates complimentary, non-redundant information for inference on brain microstructure, providing insights into both coherent and incoherent motion. This motion over the cardiac cycle is an important addendum that can be run parallel to existing DTI methods and provides novel insights into glymphatic circulation.Acknowledgements
Research reported in this work was supported by the CDMRP under award number: W81XWH-22-2-0038. The opinions or assertions contained herein are the views of the authors and are not to be construed as the views of the U.S. Department of Defense, Walter Reed National Military Medical Center, or the Uniformed Services University.References
1. Heukensfeldt Jansen, I., et al. (2020, August 10-13). Simultaneous Imaging of Diffusion and Coherent Motion in Slow-Flow Compartments in the Brain [Conference Presentation]. ISMRM 2020, Virtual Conference. https://www.ismrm.org/20/program_files/PP26.htm
2. Heukensfeldt Jansen, I., et al. (2021, May 15-20). Retrospective Cardiac Gating of Simultaneous Coherent/Incoherent Motion Imaging (SCIMI) in the Brain [Conference Presentation]. ISMRM 2021, Virtual Conference.
3. Foo TK, Tan ET, Vermilyea ME, et al. Highly efficient head-only magnetic field insert gradient coil for achieving simultaneous high gradient amplitude and slew rate at 3.0 T (MAGNUS) for brain microstructure imaging. Magn Reson Med. 2020; 83: 2356-2369.
Figures