0798
Investigation of Feasibility of Measurement of Neurofluid Movement by Propagator Analysis based on Q-space Imaging1Human and Information Science, Tokai University, Kanagawa, Japan, 2BioView, Inc., Tokyo, Japan, 3Course of Electrical and Electronic Engineering, Tokai University, Kanagawa, Japan, 4Department of Neursurgery, School of Medicine, Tokai University, Kanagawa, Japan, 5Department of Radiological Technology, Tokai University Hospital, Kanagawa, Japan
Synopsis
Keywords: Neurofluids, Neurofluids
Motivation: To quantitatively measure neurofluid movement in the brain parenchyma of mouse and human by propagator analysis of q-space imaging (QSI).
Goal(s): The accuracy of the propagator analysis to measure the neurofluid movement including the pulsation and the blood flow was investigated by Bloch simulation.
Approach: The propagator analysis of pulsatile neurofluid or capillary blood flow in a voxel was conducted by Bloch simulation. The accuracy of the technique in the constant flow was validated by experiments.
Results: The propagator analysis indicated the high accuracy of the velocity measurement of the pulsatile neurofluid movement and the blood flow.
Impact: The high accuracy of the velocity measurement of QSI-based propagator analysis of pulsatile movement and blood flow in the voxel was validated by Bloch simulation. The technique may reveal neurofluid movement and clearance mechanism of neurowastes in human brain.
Introduction
Recently, there are many reports related with neurofluid movement and neurowaste clearance system1-6. Q-space imaging (QSI)-based propagator analysis derives the diffusivity and displacement as well as the velocity of the water molecules as property change of the probability density function (PDF). Velocity mapping by the propagator analysis was applied to the mouse brain to observe the neurofluid movements in the parenchyma7; however, the effects of the pulsation of neurofluid and of the blood flow were not considered.In the present study, to investigate the pulsatile neurofluid movement as well as the blood flow in the parenchyma measured by QSI, Bloch simulation of diffusion-weighted stimulated echo (DW-STE) sequence was performed. Then, the propagator analysis was applied to the mouse brain to evaluate ISF and neurofluid movements in the parenchyma.
Methods
Bloch SimulationThe time varying magnetization of the isochromat with diffusion term is described in Bloch-Torrey equation as below:
$$\frac{d\bf{M}}{dt}=\begin{bmatrix}-\frac{1}{T_2}&\gamma{B_z}&-\gamma{B_y}\\-\gamma{B_z}&-\frac{1}{T_2}&\gamma{B_x}\\\gamma{B_y}&-\gamma{B_x}&-\frac{1}{T_1}\end{bmatrix}\bf{M}\mathrm+\begin{bmatrix}\mathrm0\\0\\\frac{\bf{M}_0}{T_1}\end{bmatrix}+\it{D}\nabla^2\bf{M}$$
where M is magnetization vector, B is magnetic field in each direction including the effect of the gradient, and D is diffusion coefficient.
Figure 1 shows DW-STE sequence chart and the simulation model. Figure 1 shows DW-STE sequence chart and the simulation model. The details of the simulation steps are described in the caption of Fig. 1.
Propagator analysis of QSI was applied for the simulated complex signals. QSI signal is described in the following equation:
$$S(q)=S_0exp((2\pi{q})^2D(\Delta-\frac{\delta}{3}))$$
where q, which is a wave number [m-1], is $$$q=\frac{\gamma{g}\delta}{2\pi}$$$, g is motion probing gradient (MPG), δ is duration of the MPG, and Δ is the interval between the MPGs. The probability distribution function (PDF) of the water proton displacement, called as propagator, was assumed as below:
$$P(R,\Delta)=\frac{1}{2\pi}\int{}S(q)e^{i2\pi{q}R}dq$$
where P(R, Δ) is the propagator, R is the displacement. The average displacement $$$\bar{R}$$$ can be calculated from the peak position of the propagator in the displacement axis. The displacement divided by Δ derives the velocity. The propagator was interpolated in the resolution of 0.1 µm/s using the Lanczos filter.
Mouse experiments
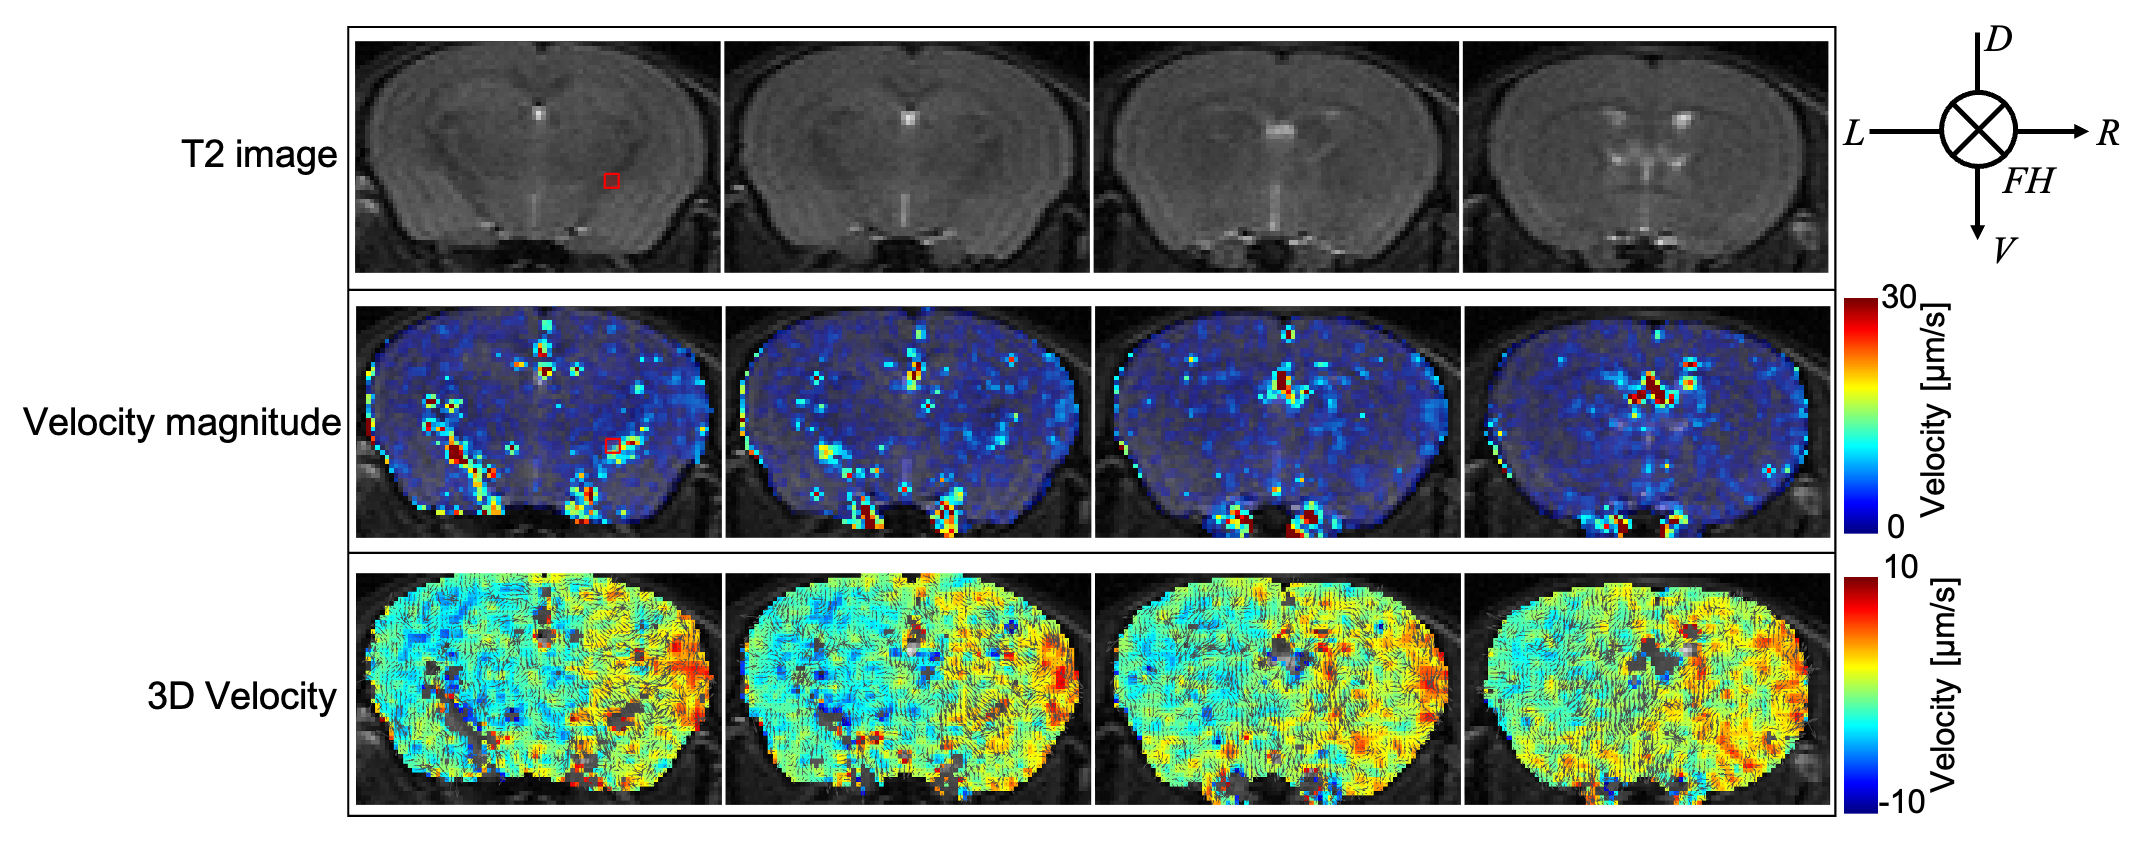
3D DW-STE-EPI was performed in the brain of five female mouse (postnatal week 12-13) under anesthesia at 9.4-T. The experimental setup is shown in Fig. 2. Imaging parameters were as follows: TR, 8000 ms; TE, 17.81 ms; δ, 1 ms; Δ, 1000 ms; MPG amplitude, between -292.74 and 292.74 mT/m at intervals of 73.185 mT/m, corresponding to maximum q 1.25×10⁴ m-1; MPG directions, ±RL, ±VD, and ±FH; matrix, 128×128×12; spatial resolution, 140×140×500 mm3; EPI segments, 6. Total acquisition time was approximately 8 hours. The complex signals of QSI were zero-filled to 32 data points in q-space. The propagator in the resolution of 10 µm/s was interpolated in the resolution of 0.1 µm/s as same as the above simulation.
Results
Bloch simulationFigure 3 shows the simulation results. The results in all steps indicated that the estimated velocity was identical to the set average value; however, the baseline of the propagators was lifted in the case of including the ISF pulsatile movement and the capillary blood flow.
Mouse experiments
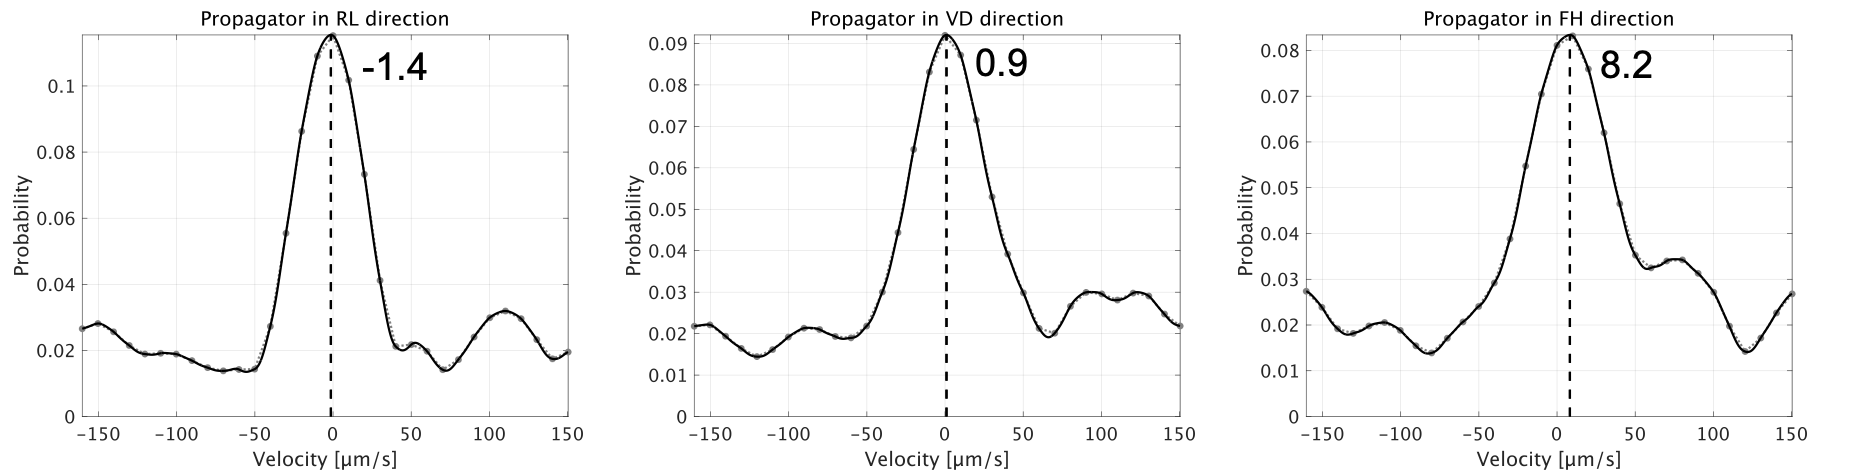
Figure 4 shows the results of the propagator analysis applied for the mouse brain. The velocity magnitude maps showed the high velocity around the vessels and the fiber tracts. Figure 5 shows the propagator in each direction in the region of interest indicated by red rectangle on the T2 image and the velocity map in Fig. 4.
Discussions
This study demonstrated the feasibility of the neurofluid velocity measured by the propagator analysis. The technique may give us abundant information of the neurofluid movement and the clearance pathway of neurowastes in the brain parenchyma such as amyloid beta protein.The Bloch simulation presented the high accuracy of the propagator analysis even if presence of the pulsatile neurofluid and the blood flow; however, the baseline of propagators was lifted. It suggests that movements more than the velocity bandwidth spread in the entire velocity axis. Nevertheless, since the technique exhibited the accurate velocity of neurofluid in the simulation, the propagator analysis is feasible to seize neurofluid movements in the brain parenchyma.
The mouse study demonstrated the velocity distribution of the brain parenchyma. From the simulation results, the velocity observed by the propagator analysis reflects the water molecule movements such as neurofluid. In addition, relatively the high velocities appeared around vessels and in fiber tracts may be related to aquaporin-4 (AQP4) water channel8. Further investigation to interpret the velocity distribution regarding the neurofluid movements is needed.
In conclusion, the propagator analysis by QSI can evaluate the slow flow such as neurofluid movement even if the presence of remarkably faster movement.
Acknowledgements
The authors would like to thank Dr. Koichi Oshio at the Keio University School of Medicine for his valuable suggestions.References
1. Brinker T, Stopa E, Morrison J, Klinge P. A new look at cerebrospinal fluid circulation. Fluids and barriers of the CNS. 2014; 11:10.
2. Jessen NA, Munk AS, Lundgaard I, Nedergaard M. The Glymphatic System: A Beginner's Guide. Neurochemical research. 2015; 40:2583-2599.
3. Naganawa S, Nakane T, Kawai H, Taoka T. Lack of Contrast Enhancement in a Giant Perivascular Space of the Basal Ganglion on Delayed FLAIR Images: Implications for the Glymphatic System. Magnetic resonance in medical sciences : MRMS : an official journal of Japan Society of Magnetic Resonance in Medicine. 2017; 16:89-90.
4. Mestre H, Tithof J, Du T, et al. Flow of cerebrospinal fluid is driven by arterial pulsations and is reduced in hypertension. Nature communications. 2018; 9:4878.
5. Taoka T, Naganawa S. Glymphatic imaging using MRI. Journal of Magnetic Resonance Imaging. 2020; 51:11-24.
6. Agarwal N, Lewis LD, Hirschler L, Rivera LR, Naganawa S, Levendovszky SR, Ringstad G, Klarica M, Wardlaw J, Iadecola C, Hawkes C, Carare RO, Wells J, Bakker E, Kurtcuoglu V, Bilston L, Nedergaard M, Mori Y, Stoodley M, Alperin N, de Leon M, van Osch MJP. Current Understanding of the Anatomy, Physiology, and Magnetic Resonance Imaging of Neurofluids: Update From the 2022 "ISMRM Imaging Neurofluids Study group" Workshop in Rome. J Magn Reson Imaging 2023.
7. Yatsushiro S, Satou A, Matsumae M, et al. Measurement of Cerebrospinal fluid and Interstitial Fluid Flow in Mouse Brain using Q-space Imaging. Intl Soc Magn Reson Med. 2022. p2943.
8. Eidsvaag VA, Enger R, Hansson HA, Eide PK, Nagelhus EA. Human and mouse cortical astrocytes differ in aquaporin-4 polarization toward microvessels. Glia 2017;65(6):964-973.
Figures
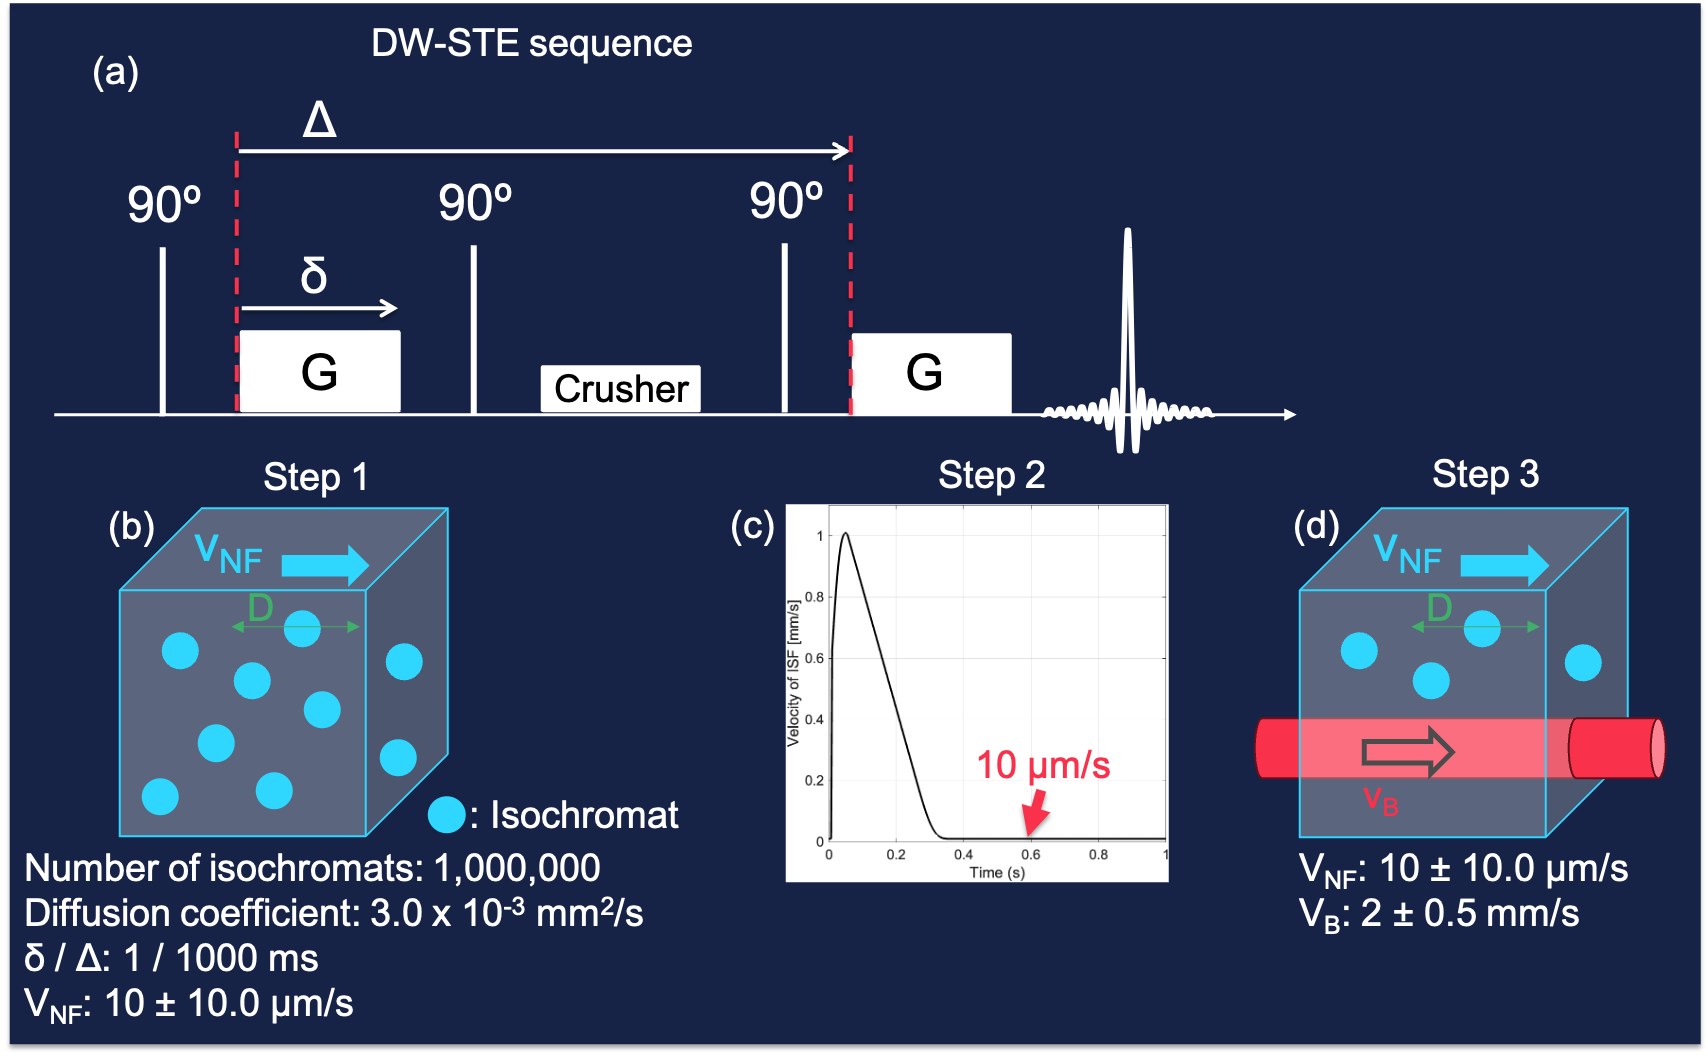
Figure 1: DW-STE sequence chart (a) and simulation models (b-d). Simulations were conducted as following steps 1-3 indicated by (b-d): 1) Only isochromats of neurofluid which moves in the velocity of 10±5 µm/s with diffusion are present in the voxel; 2) added pulsatile movement of the neurofluid, which the peak velocity was 1 mm/s to the step 1; 3) added capillary blood flow of 2±0.2 mm/s to the step 2, which the isochromat fraction of the neurofluid and the blood in the voxel was changed. VNF, velocity of neurofluid; D, diffusion movement; VB, velocity of blood flow
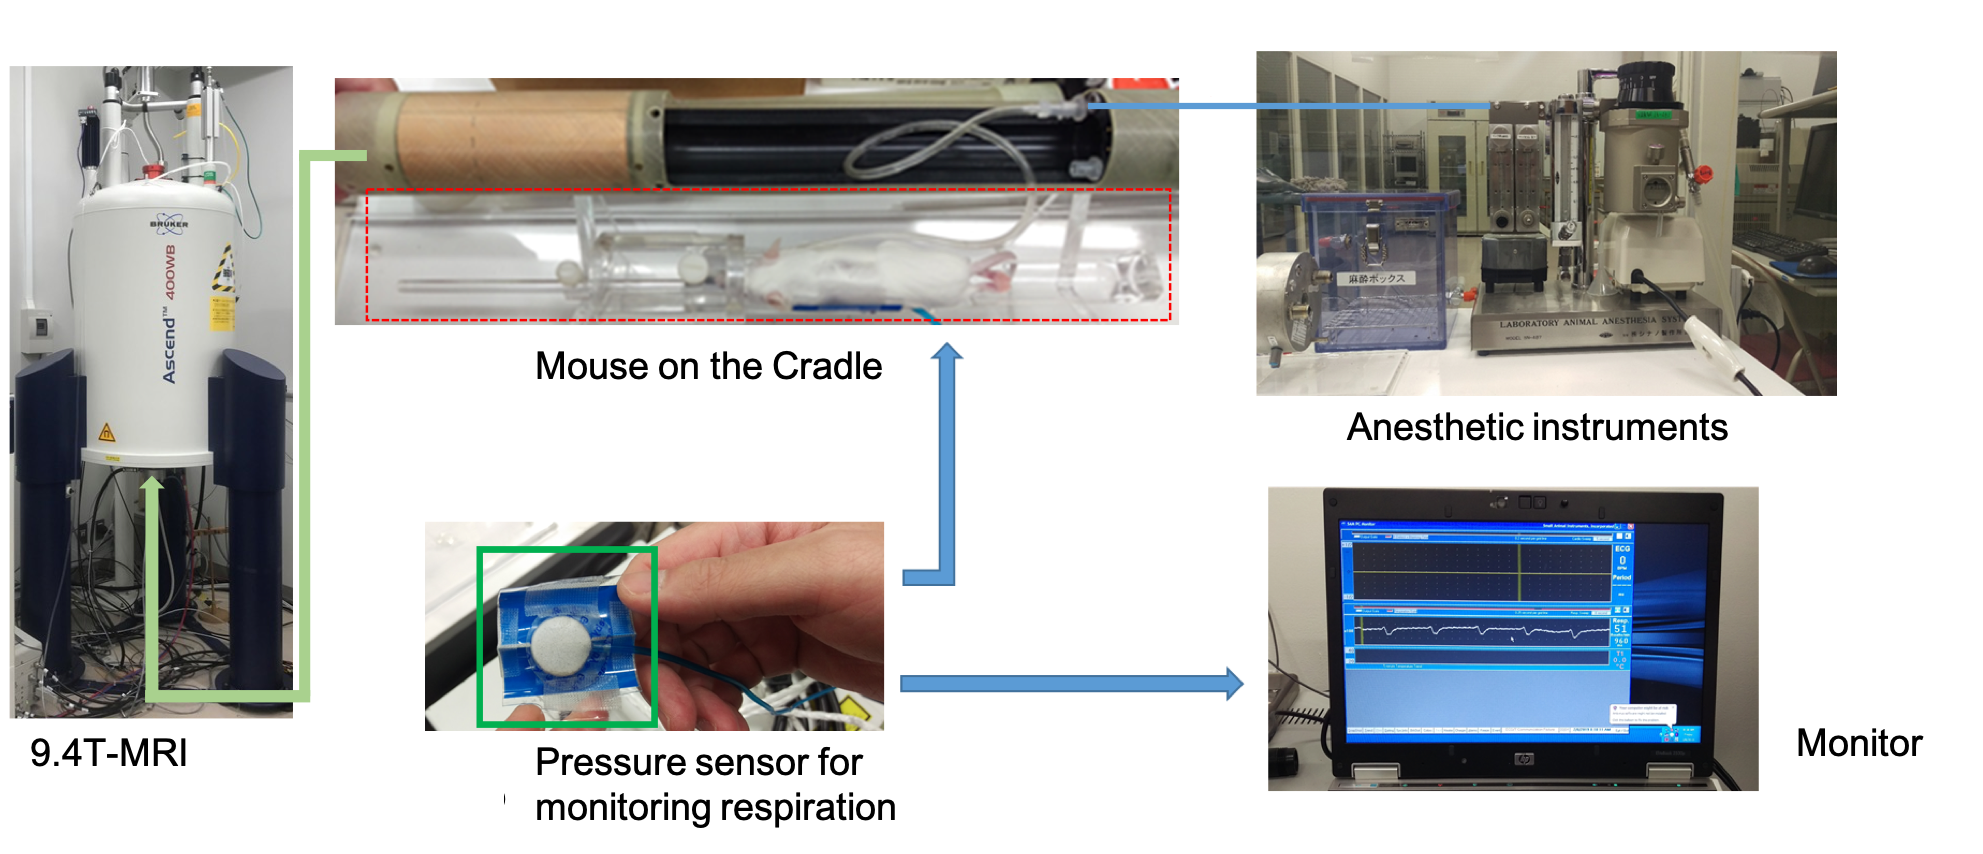
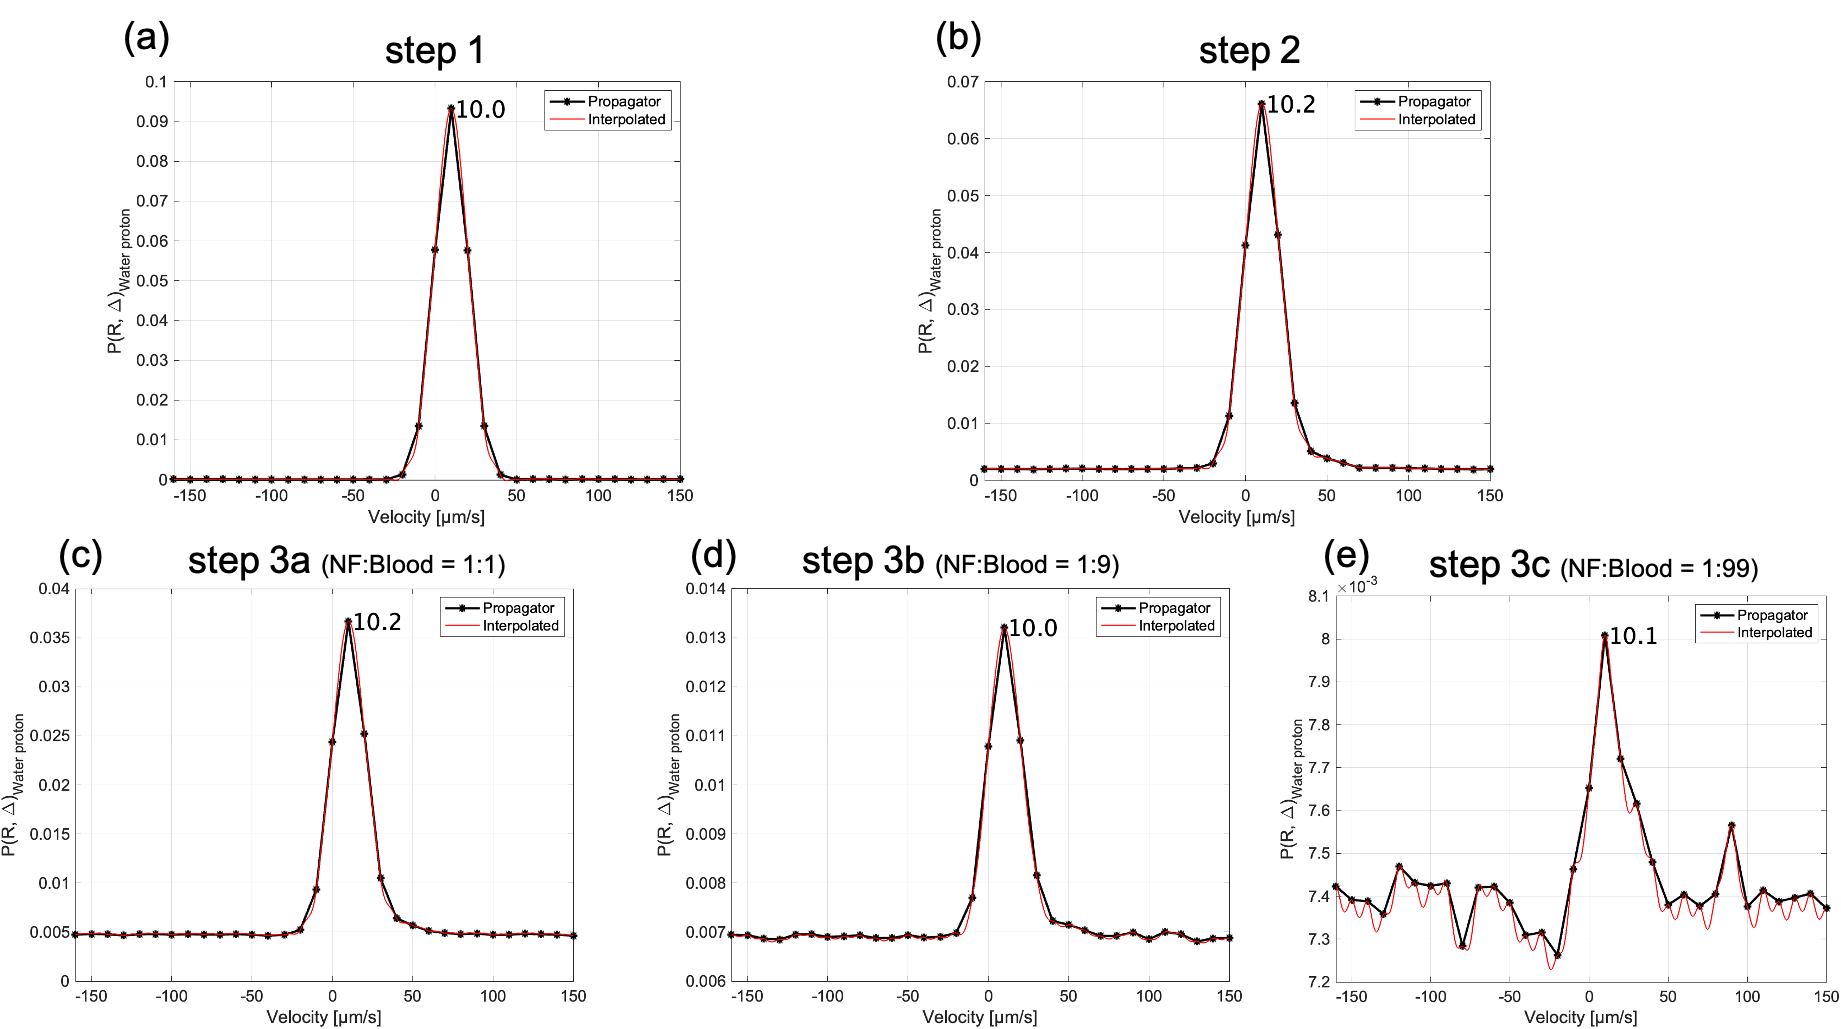
Figure 3: Simulation results of the propagator analysis in each step. (a) The propagator at step 1 completely agreed with the set value. (b) The propagator at step 2 showed a little change of the shape. (c) The ratio of the neurofluid to blood in the voxel is set as 1:1. (d) The ratio of neurofluid to blood is 1:9. (e) The ratio of neurofluid to blood is 1:99. The average velocity is denoted near the peak. NF: neurofluid.