0792
Subject-specific PNS prediction using a localizer and fast E-field calculation1Radiology, Stanford University, Stanford, CA, United States, 2Robarts Research Institute, University of Western Ontario, London, ON, Canada, 3Roemer Consulting, Lutz, FL, United States
Synopsis
Keywords: Gradients, Gradients, peripheral nerve stimulation, subject-specific PNS prediction, electric field calculation
Motivation: Given the large population variability in PNS thresholds (~3-fold), rapid and accurately prediction of PNS thresholds for individual subjects would be valuable.
Goal(s): To apply our E-field-based PNS prediction method to individual subjects, and to test the hypothesis that we can predict an individual subject’s PNS threshold with reasonable accuracy.
Approach: Subject-specific body models were fit to an individual’s anatomy based on a localizer. E-field calculations yielded Emax and therefore PNS threshold. We compared to measured PNS thresholds using 3 different head gradient coils and 7 different gradient directions.
Results: Individual subject PNS thresholds values can be predicted to an accuracy of ~35%.
Impact: There would be significant advantages in being able to predict PNS thresholds rapidly and accurately for individual subjects. This would allow much more effective use of high-performance gradient hardware, benefitting the subset of the population with high PNS thresholds.
Introduction
Peripheral nerve stimulation (PNS) has become a significant limiting factor for high performance gradient coils, including latest generation head gradients. Population-average PNS thresholds have always been used on scanners to set safety limits; however, given the large variability in PNS thresholds across the population (~3-fold), the ability to predict PNS thresholds rapidly and accurately for individual subjects would be valuable. This would allow much more effective use of high-performance gradient hardware, benefitting the subset of the population with high PNS thresholds.Emax is defined as the maximum electric field per unit slew rate, evaluated over the surface of simplified body models positioned in the gradient coil, and is an accepted predictor of PNS thresholds according to regulatory standards1. Previously, we calculated Emax for various gradient coils and simplified body model populations, and demonstrated the ability to predict population-average PNS thresholds to within 20%2.
The goal of the present work was to apply our Emax-based PNS prediction method to individual subjects, and to test the hypothesis that we can predict an individual subject’s PNS threshold with reasonable accuracy. We fit simplified body models to individual subject anatomy based on localizer scans and extracted Emax per subject
Methods
We used three different head gradient coils developed by our group (H42, LH7 and SH7) to measure PNS thresholds in three subjects. For H4, PNS experiments were run for both shoulder-coil contact and 2cm shoulder-coil gap. Linear fits between rise time and stimulation thresholds were performed to define PNS parameters, ΔGmin and SRmin, on a subject specific basis for each case. Measured SRmin values were converted to Emax as described previously2. Measured Emax values were considered to be reliable for r2>0.95 in the linear fitting.3D localizer scans were acquired for the same three subjects using a proton-density-weighted gradient sequence with ~3mm isotropic spatial resolution and ~1min scan time. Simplified body models were constructed to fit the individual subject’s anatomy by matching key dimensions to the localizer scan. Figure 1 shows the generic description of the simplified body model geometry and dimension parameters including head, neck, shoulder and torso regions.
Gradient fields and corresponding vector potentials of three gradient coils were simulated in Sim4Life (ZMT MedTech AG, Zurich). We used our E-field calculation technique to compute E-fields on the subject-specific simplified body models in MATLAB. Emax was extracted for each case from the surface E-fields. We then compared with measured to calculated Emax as a direct measure of PNS threshold prediction.
Results
Figure 2 shows calculated E-fields on the surface of the subject-specific simplified body models. It can be observed that the relatively smaller body model extracted from Subject 3 had lower Emax for all cases compared to the other subjects. Subject 2 had smaller body dimensions than Subject 1 except for the neck radius in the A-P direction.Figure 3 shows the experimentally measured thresholds, hardware limits and fitted PNS curves for all subjects, coils and axes. Stimulation could not be observed in the z-axis except in a few cases due to hardware limits and stimulation thresholds of z-axis being higher as expected from E-field calculations. Qualitative analysis showed that Subject 1 had higher measured Emax values than other subjects except for the 2cm gap H4-X case, in which case Subject 2 had the highest Emax.
Figure 4 shows the comparison between experimentally measured and calculated Emax values. Only the linear fits in Figure 3 with r2>0.95 were used in this comparison. This allowed us to compare 45 distinct pairs of Emax values. Linear regression fitting of experimentally measured to calculated Emax values yielded an r2 value of 0.48, indicating a high correlation between the experiments and predictions. The slope of the fit was 0.91, showing that the Emax predictions were slightly high. The mean absolute error (MAE) was around 3mV/m over the range of Emax measurements between 4 and 23 mV/m. Across all data points, the normalized MAE was 35%.
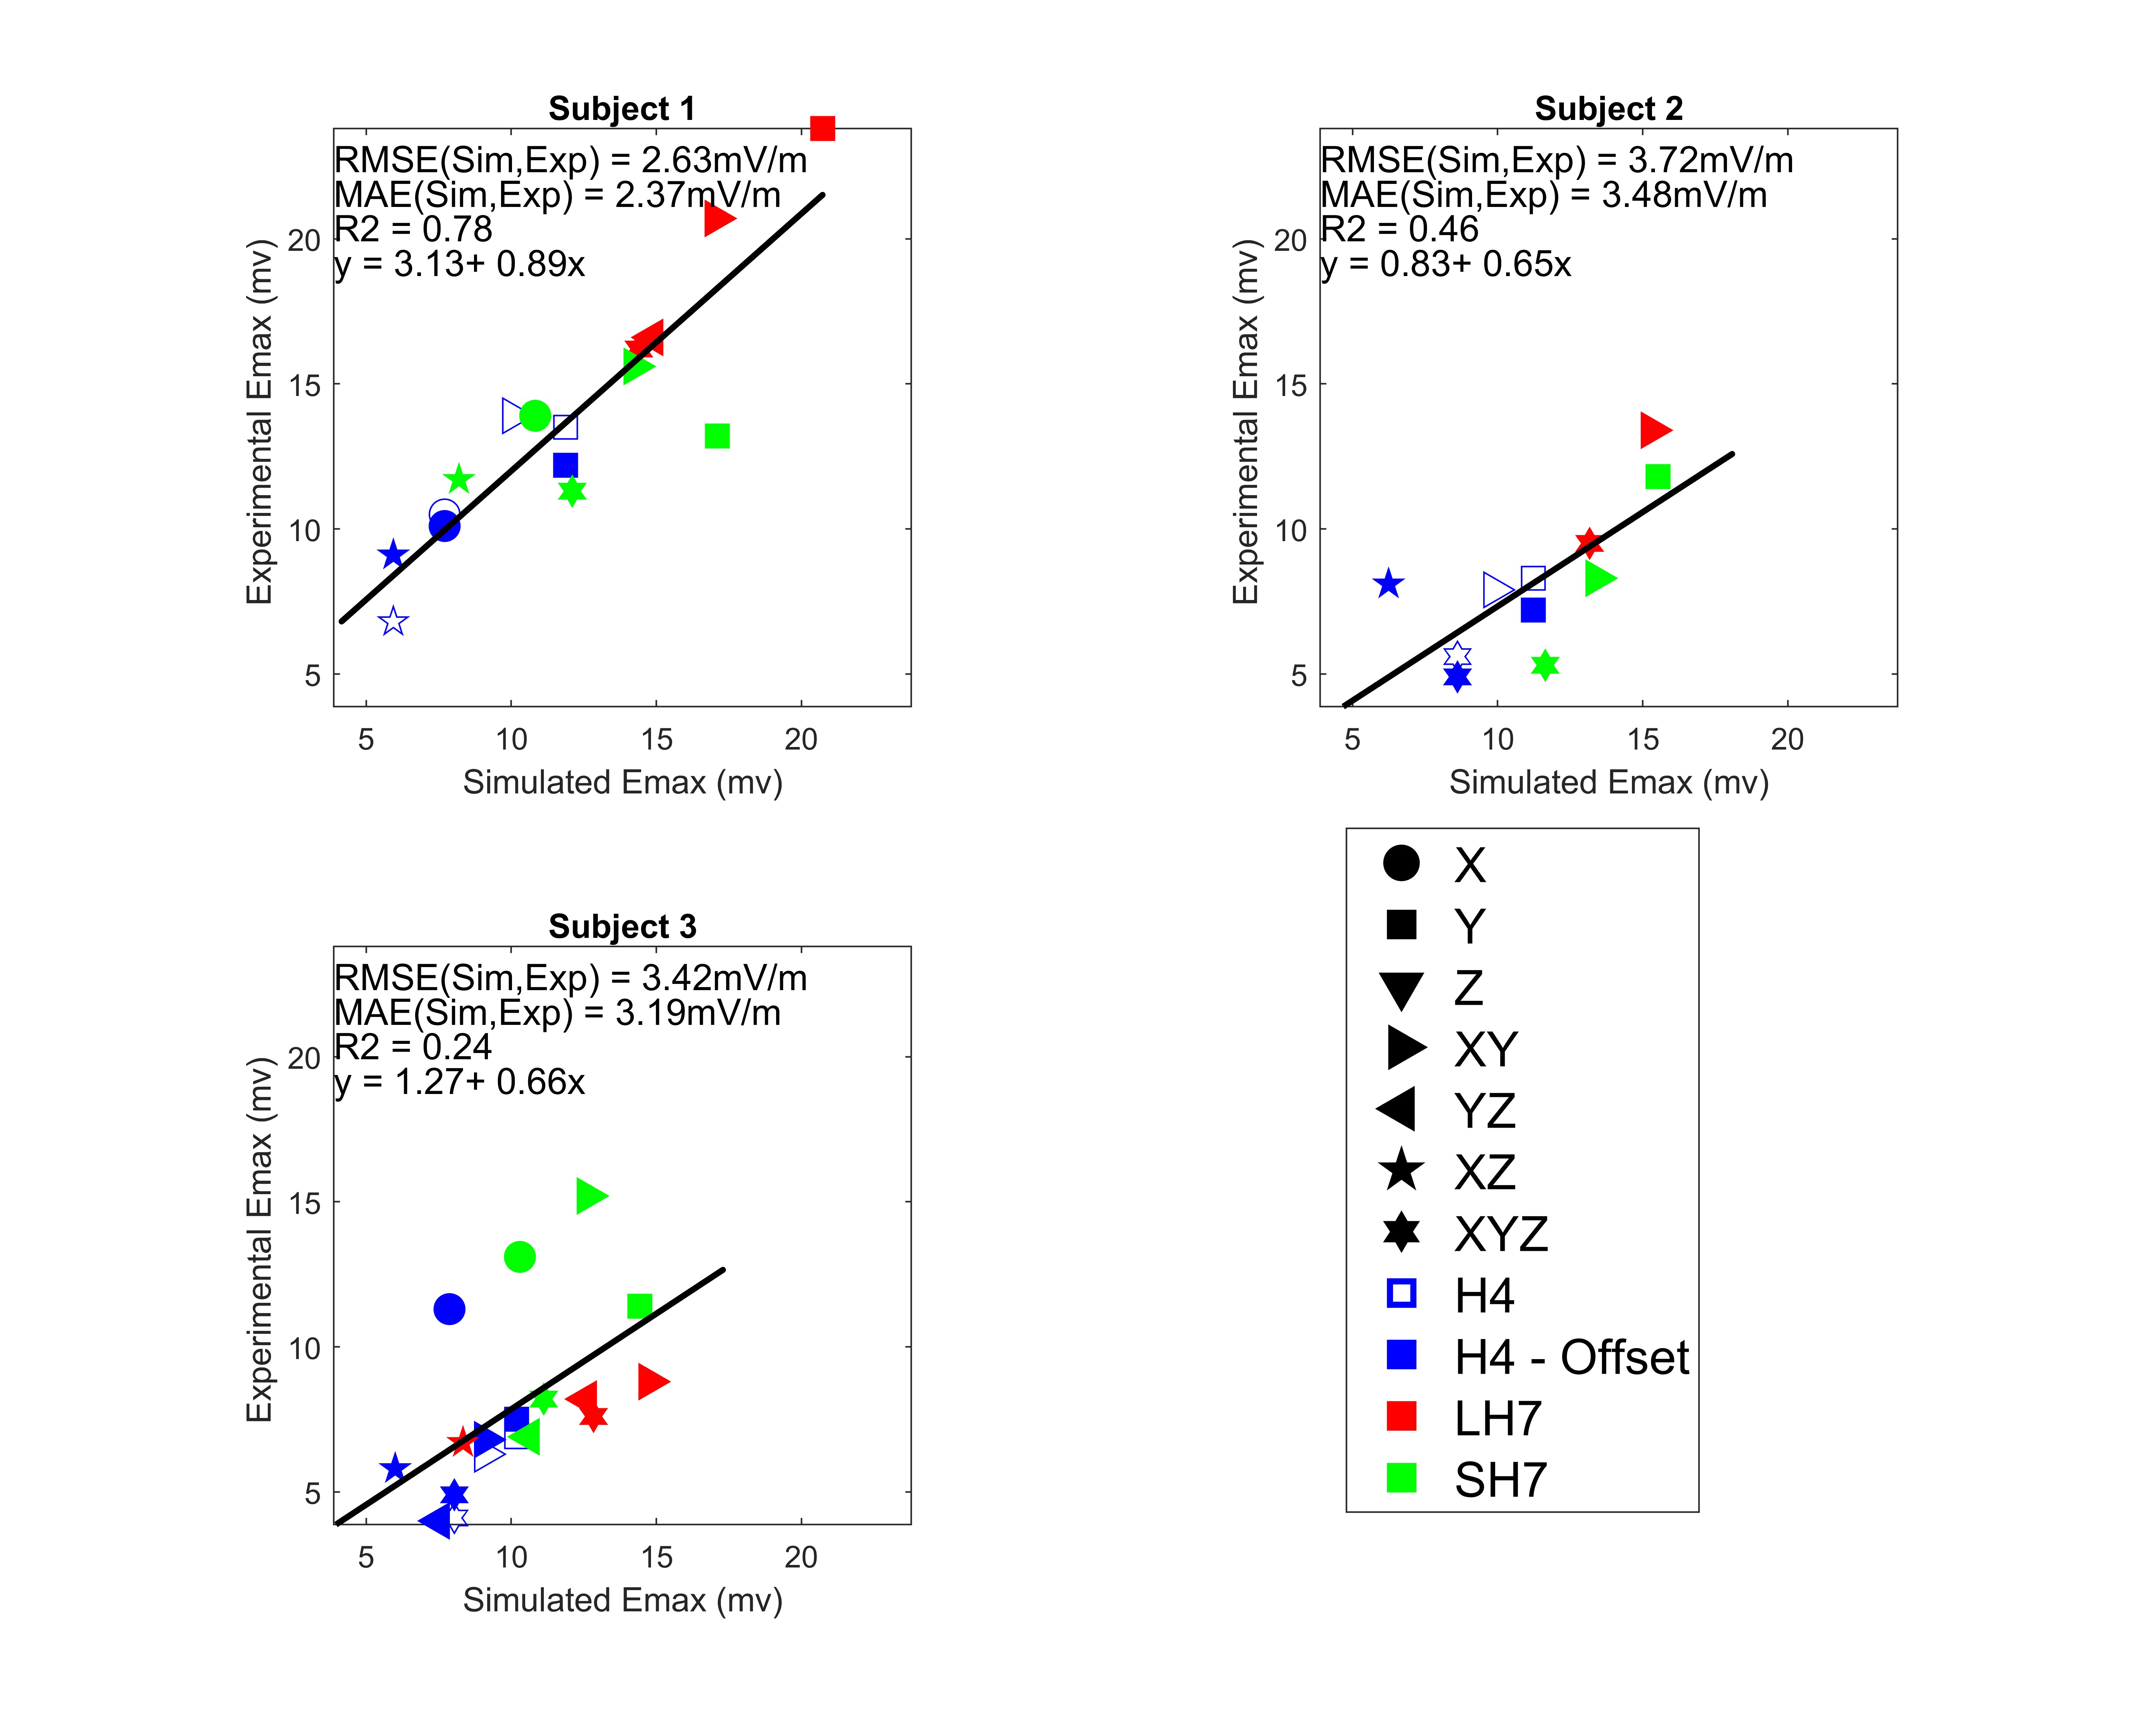
Figure 5 shows comparisons of simulated and measured Emax values, plotted separately for each subject, with linear regression fits shown. Marker type indicates gradient axis and color indicates gradient coil. RMS, MAE errors and r2 values are provided in the upper left corner. Normalized MAE is approximately 20% for Subject 1 and 40% for Subjects 2/3. r2 values are 0.78, 0.46 and 0.24, respectively.
Discussion and Conclusions
We have demonstrated the ability to predict PNS thresholds for individual subjects with 20-40% accuracy. Future refinements in body-model matching and E-field calculations should further improve this prediction accuracy. These promising methods and results should enable fast subject-specific PNS prediction.Acknowledgements
The authors gratefully acknowledge research support from NIH U01 EB025144 and NIH R01 EB025131. We also acknowledge support from the Sim4Science program at ZurichMedTech.References
1. IEC. Medical electrical equipment – Part 2-33: Particular requirements for the basic safety and essential performance of magnetic resonance equipment for medical diagnosi. International Electrotechnical Commissioin 60601-2-33 Edition 3.2(2015).
2. Roemer, P.B., Wade, T., Alejski, A., McKenzie, C.A. & Rutt, B.K. Electric field calculation and peripheral nerve stimulation prediction for head and body gradient coils. Magn Reson Med 86, 2301-2315 (2021).
Figures