0791
Modeling of cardiac stimulation limits by MRI gradient coils in a population of body models1A. A. Martinos Center for Biomedical Imaging, Department of Radiology, Massachusetts General Hospital, Charlestown, MA, United States, 2Harvard Medical School, Boston, MA, United States, 3Harvard-MIT Division of Health Sciences and Technology, Cambridge, MA, United States
Synopsis
Keywords: Safety, Safety, Cardiac stimulation
Motivation: Our previous modeling of gradient-induced cardiac stimulation (CS) in two body models indicated that the regulatory IEC 60601-2-33 CS limit overestimated CS thresholds by 9- to 46-fold.
Goal(s): To investigate the expected variance of CS thresholds across a healthy population.
Approach: We deploy our validated cardiac magnetostimulation modeling approach in six body models with varying shape/BMI/age and a commercial gradient system.
Results: Predicted CS thresholds vary up to 2-fold across body models. Worst-case CS thresholds are 7X greater than the IEC CS limit and 4X greater than experimental PNS limits.
Impact: Our modeling allows investigation of the variability of CS thresholds across the population, which is not accessible experimentally. This knowledge is critical to obtain a robust estimate of safe, but not overly restrictive cardiac safety limits for MRI gradients.
Purpose
The IEC 60601-2-33 regulatory standard limits the electric field (E-field) and dB/dt of MRI gradients to protect patients from cardiac stimulation (CS)[2]. These guidelines were based on a conservative threshold estimate that assumes the same E-field rheobase for the heart as predicted for large peripheral nerves (Erheo=6 V/m)[4], including a safety factor of 3 (effective Erheo=2 V/m). The E-field limit was converted to dB/dt using a conversion factor based on E-field calculations in a homogeneous body model[4]. The resulting dB/dt limit can be more restrictive than PNS in some high-amplitude gradient systems at long rise times[7], thus raising the question whether the cardiac safety limit can be raised without compromising safety.Unlike PNS, CS cannot be measured in humans. We have therefore developed a modeling framework to predict quantitative CS thresholds for arbitrary coils and waveforms, which we validated by comparing predictions with threshold measurements in anesthetized pigs[8, 9]. We previously used this model to predict CS thresholds in two body models, and found that the IEC cardiac safety limit overestimated the predicted thresholds by factors of 9 to 46[10]. Since regulatory safety guidelines must protect patients of all genders, body shapes, ethnicities, and body mass indices (BMI), we here expand our modeling to include additional body models and a commercial gradient system.
Methods
Body models and gradient systems: We use the XCAT body model family, which comprises a total of 58 adult models created from CT scans that are parameterized to allow modeling respiratory motion[11]. We selected 6 of those models (3 females, 3 males) spanning a large range of BMIs (BMI=19-39). We added cardiac Purkinje fiber paths to the myocardium of those models using a rule-based fiber generation algorithm[1] and assigned electrical conductivity values to the different tissue classes using the low-frequency IT’IS material database[12]. We modeled single axes and an axis combination (X+Y+Z) of a commercial whole-body gradient system with maximum gradient strength Gmax=80 mT/m and maximum slew rate Smax=200 T/m/s (Siemens Prisma, Siemens Healthineers, Erlangen, Germany). For one of the gradient axes, we simulated CS thresholds for 2 lung phases (inspiration and expiration) in all 6 body models.CS thresholds simulations: We used our modeling workflow[9, 10] to predict quantitative CS thresholds (Fig. 1). We used the C++ software package M-FEM[13] to simulate E-fields induced in the 6 body models by the gradient coils at a spatial resolution of 1x1x1 mm3. Body models were placed with their head at gradient isocenter, as we have previously shown that this position yields higher E-fields in the heart than the heart-at-isocenter landmark[8]. We projected the E-field onto the cardiac fibers and integrated along them to obtain the electric potential. We modulated this potential in time with trapezoidal gradient waveforms (10 bipolar lobes, 500 µs flat-top duration, rise times between 0.1 ms and 5.0 ms) and used a validated electrical circuit model of human Purkinje cells[3] connected by gap junctions[5] to predict the smallest gradient amplitude evoking an action potential in the fibers (CS threshold).
Results
Figure 2 shows E-field maps in the 6 body models for all gradient axes. The 95th percentile E-field (E95) varies by up to 1.4X across the body models (Fig. 3A) and reaches a maximum of E95=3.3 V/m (model #96, X+Y+Z). The ratio between peak dB/dt evaluated on a 20-cm radius cylinder (IEC compliance volume[2]) and E95 in the myocardium ranges from 22 to 35 (T/s)*(V/m)-1, which is greater than the conversion factor of 10 (T/s)*(V/m)-1 in the IEC standard[2] (Fig. 3B).Figure 4 shows predicted CS thresholds for the 6 body models, IEC 60601-2-33 CS limit, and experimental PNS limits of the Prisma gradient. The predicted CS thresholds vary up to 2-fold across the models (ratio of greatest to smallest threshold at trise=5.0 ms). Across all gradient axes, body models, and rise times, the smallest CS thresholds are 7X greater than the IEC CS limit (4X greater than the PNS limit).
Figure 5 shows a mild impact of respiratory motion on E95 in the myocardium (E-field variation of ≤12%).
Discussion
Our validated electromagnetic-electrophysiological CS modeling in a population of 6 body models indicates a CS threshold variability of 2X. Despite this large variability, the worst-case CS thresholds were >7X higher than the IEC cardiac safety limit and >4X times higher than the PNS limit. We plan to expand our simulations to different body landmark positions and multiple gradient systems. These simulations will be important to find the most conservative CS threshold estimate to guide the determination of appropriate cardiac safety limits for all patients and gradient systems.Acknowledgements
We thank the members of the MT40 working group of the International Electrotechnical Commission for their feedback and input. This study was supported by NIH award number R01 EB028250 and R01 EB033853.References
1. Ijiri T, Ashihara T, Yamaguchi T, Takayama K, Igarashi T, Shimada T, Namba T, Haraguchi R, and Nakazawa K, A procedural method for modeling the Purkinje fibers of the heart. J Physiol. Sci., 2008. 58(7): 481-486.
2. IEC, International standard IEC 60601 medical electrical equipment. Part 2-33: Particular requirements for the basic safety and essential performance of magnetic resonance equipment for medical diagnosis. 2010, International Electrotechnical Commission (IEC).
3. Stewart P, Aslanidi O V, Noble D, Noble P J, Boyett M R, and Zhang H, Mathematical models of the electrical action potential of Purkinje fibre cells. Phil. Trans. R. Soc. A, 2009. 367: 2225-2255.
4. Reilly J P, Principles of nerve and heart excitation by time-varying magnetic fields. Ann. N. Y. Acad. Sci., 1992. 649: 96-117.
5. Rudy Y and Quan W, Propagation delays across cardiac gap junctions and their reflection in extracellular potentials: A simulation study. J. Cardiovasc. Electrophysiol., 1991. 2(4): 299-315.
6. Rudy Y and Quan W, A model study of the effects of the discrete cellular structure on electrical propagation in cardiac tissue. Circ. Res., 1987. 61: 815-823.
7. Setsompop K, Kimmlingen R, Eberlein E, Witzel T, Cohen-Adad J, McNab J A, Keil B, Tisdall M D, Hoecht P, Dietz P, Caluey S F, Tountcheva V, Matschl V, Lenz V H, Heberlein K, Potthast A, Thein H, Van Horn J, Toga A, Schmitt F, Lehne D, Rosen B R, Wedeen V, and Wald L L, Pushing the limits of in vivo diffusion MRI for the Human Connectome Project. NeuroImage, 2013. 80: 220-233.
8. Klein V, Coll-Font J, Vendramini L, Straney D, Davids M, Ferris N G, Schad L R, Sosnovik D E, Nguyen C T, Wald L L, and Guérin B, Measurement of magnetostimulation thresholds in the porcine heart. Magn. Reson. Med., 2022. 88: 2242-2258.
9. Klein V, Davids M, Vendramini L, Ferris N G, Schad L R, Sosnovik D E, Nguyen C T, Wald L L, and Guerin B, Prediction of experimental cardiac magnetotimulation thresholds using pig-specific body models. Magn Reson Med, 2023. 90: 1594-1609.
10. Klein V, Davids M, Schad L R, Wald L L, and Guérin B, Investigating cardiac stimulation limits of MRI gradient coils using electromagnetic and electrophysiological simulations in human and canine body models. Magn. Reson. Med., 2021. 85: 1047–1061.
11. Segars W P, Sturgeon G, Mendonca S, Grimes J, and Tsui B M W, 4D XCAT phantom for multimodality imaging research. Med. Phys., 2010. 37(9): 4902-4915.
12. Hasgall P A, Di Gennaro F, Baumgartner C, Gosselin M C, Payne D, Klingenböck A, and Kuster N, IT’IS Database for thermal and electromagnetic parameters of biological tissues Version 4.0. 2018.
13. Anderson R H, Andrej J, Barker A, Bramwell J, Camier J S, Cerveny J, Dobrev V, Dudouit Y, Fisher A, Kolev T, Pazner W, Stowell M, Tomov V, Akkerman I, Dahm J, Medina D, and Zampini S, MFEM: A modular finite element methods library. Comput Math with Appl, 2021. 81: 42-74.
Figures
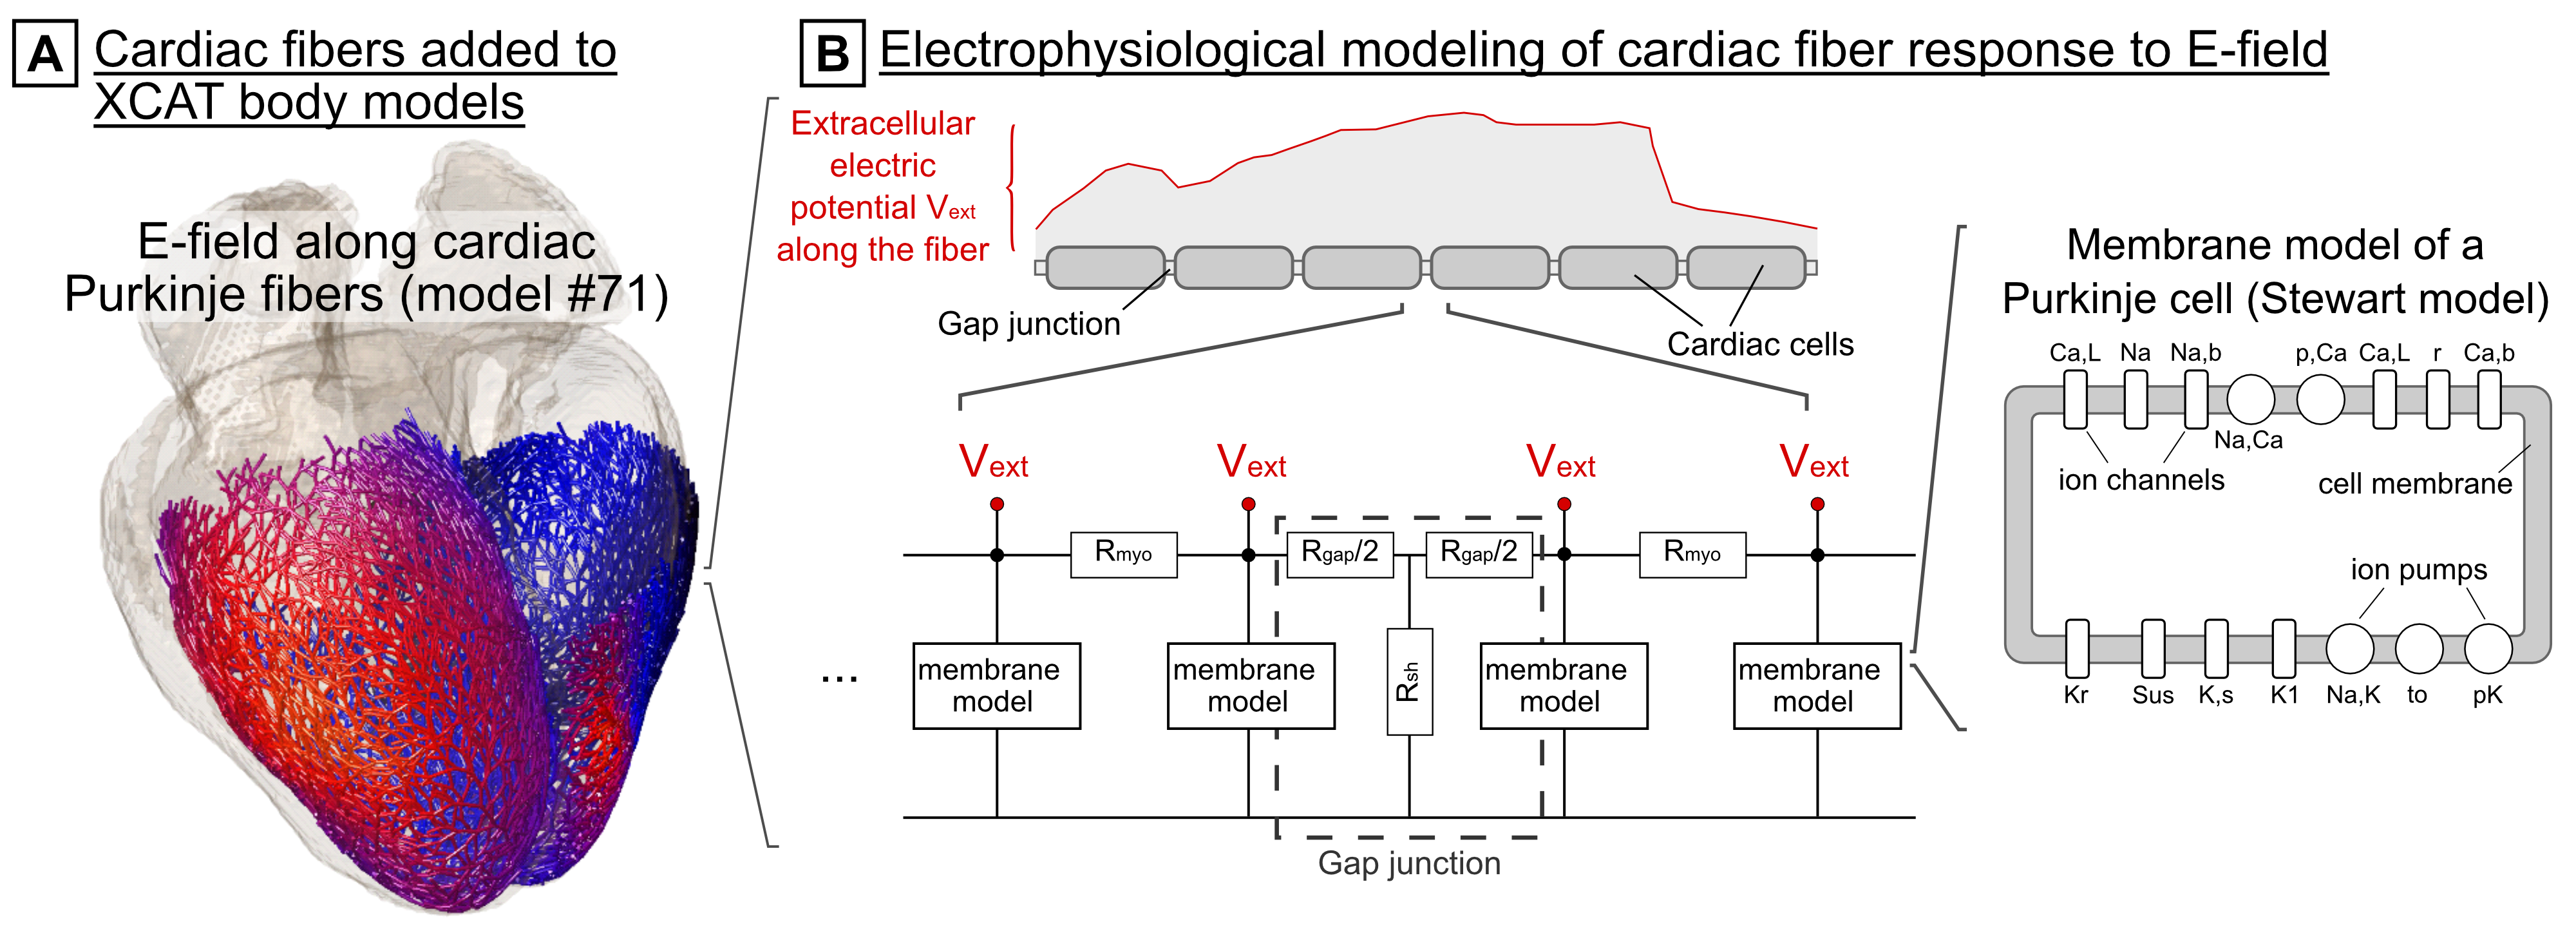
Figure 1: (A) Cardiac Purkinje fibers are added to the 6 XCAT body models using a rule-based algorithm[1]. The E-field is projected onto the fiber paths and integrated to obtain the extracellular electric potential. (B) The potential is fed into an electrical circuit model consisting of individual cardiac cells represented by a mammalian Purkinje cell membrane model[3] connected by resistive gap junctions[5, 6]. This model predicts the initiation of action potentials in the fibers, and thus CS.
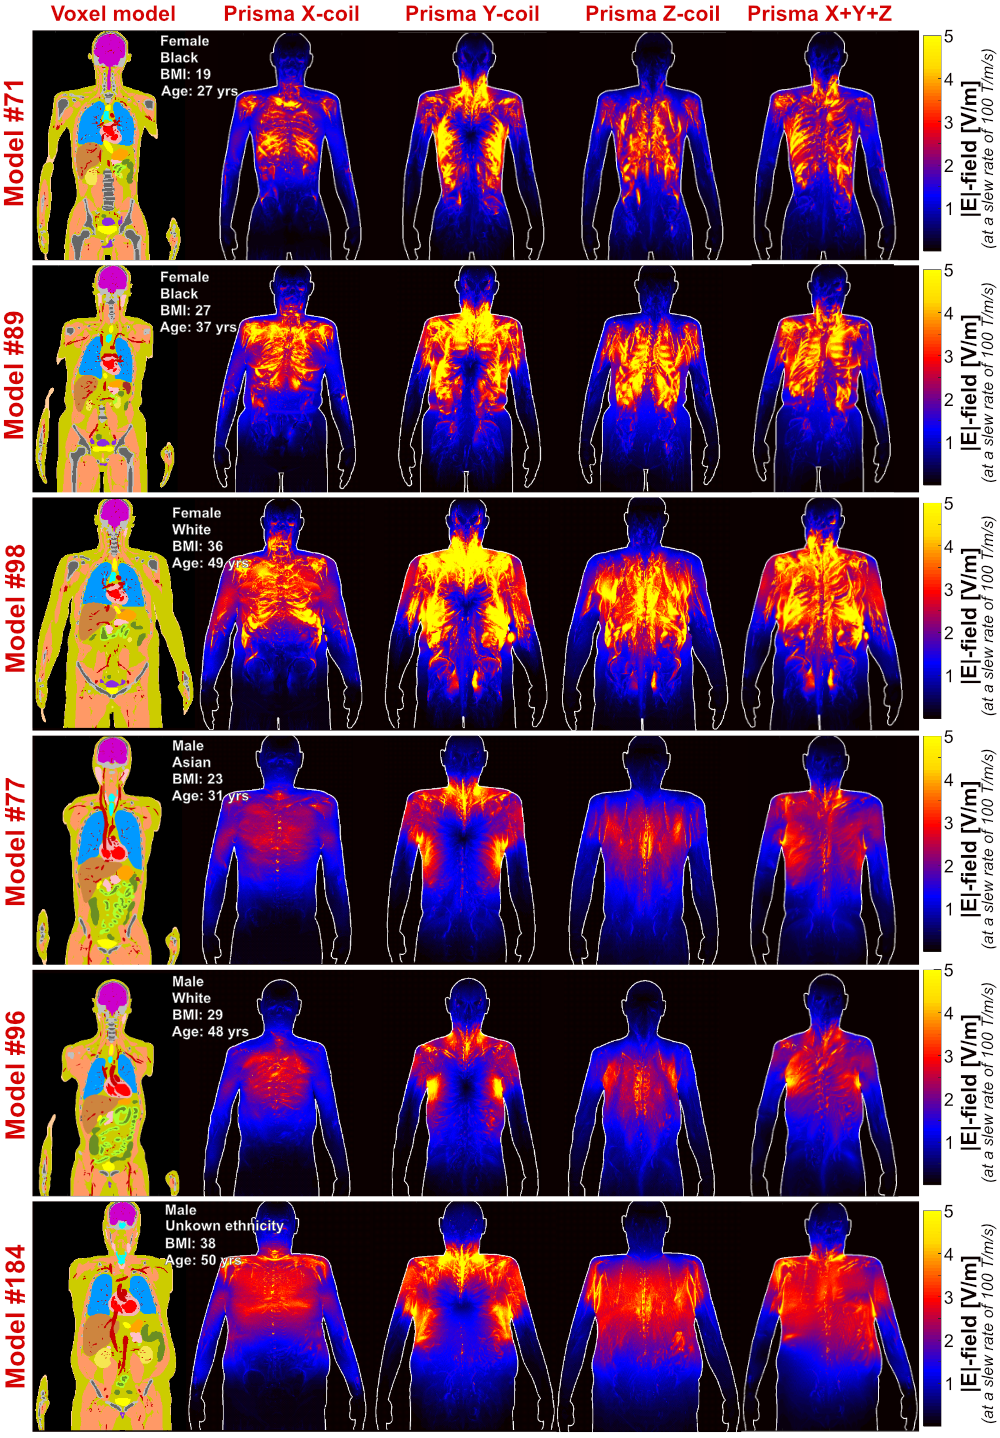
Figure 2: Coronal slices of the 6 XCAT voxel models (cardiac phase: late diastole, respiratory phase: full expiration) and electric fields (E-fields) induced by the Prisma gradient single axes (X, Y, and Z) and by a combination of all three axes (X+Y+Z). E-field maps are shown as maximum intensity projections at a slew rate of 100 T/m/s. The E-field is highly heterogeneous and varies both across the different body shapes and the gradient coils.
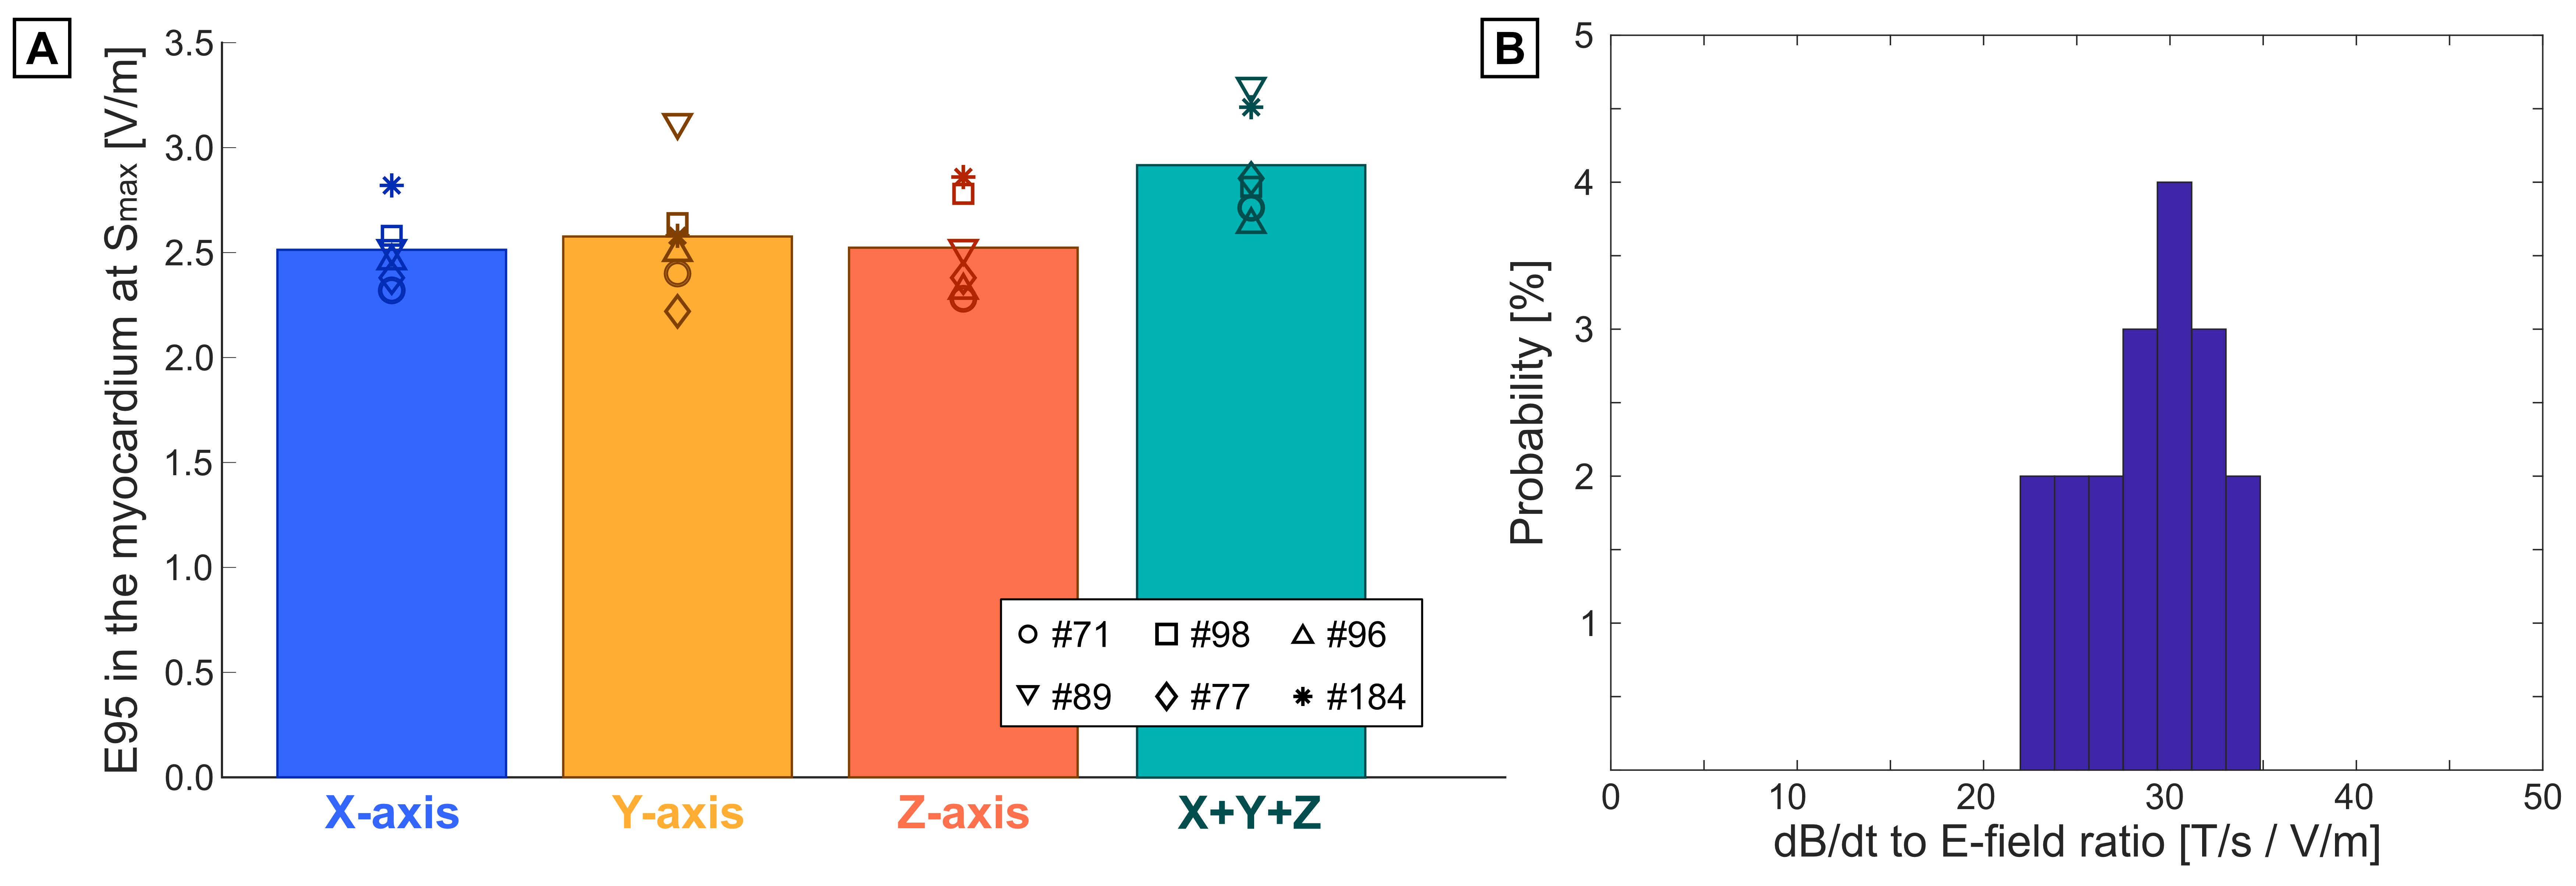
Figure 3: (A) 95th percentile electric field (E95) induced in the myocardium of the 6 body models by the Prisma gradient (single axes and X+Y+Z axis combination). The E-field is scaled to Smax=200 T/m/s. (B) Histogram of the ratio of peak dB/dt evaluated on a 20-cm cylinder (IEC compliance volume[2]) and E95 in the myocardium of the 6 models for all axes. The smallest ratio is ~20 (T/s)*(V/m)-1, which is higher than the dB/dt-to-E-field conversion factor used in the IEC 60601-2-33 standard.
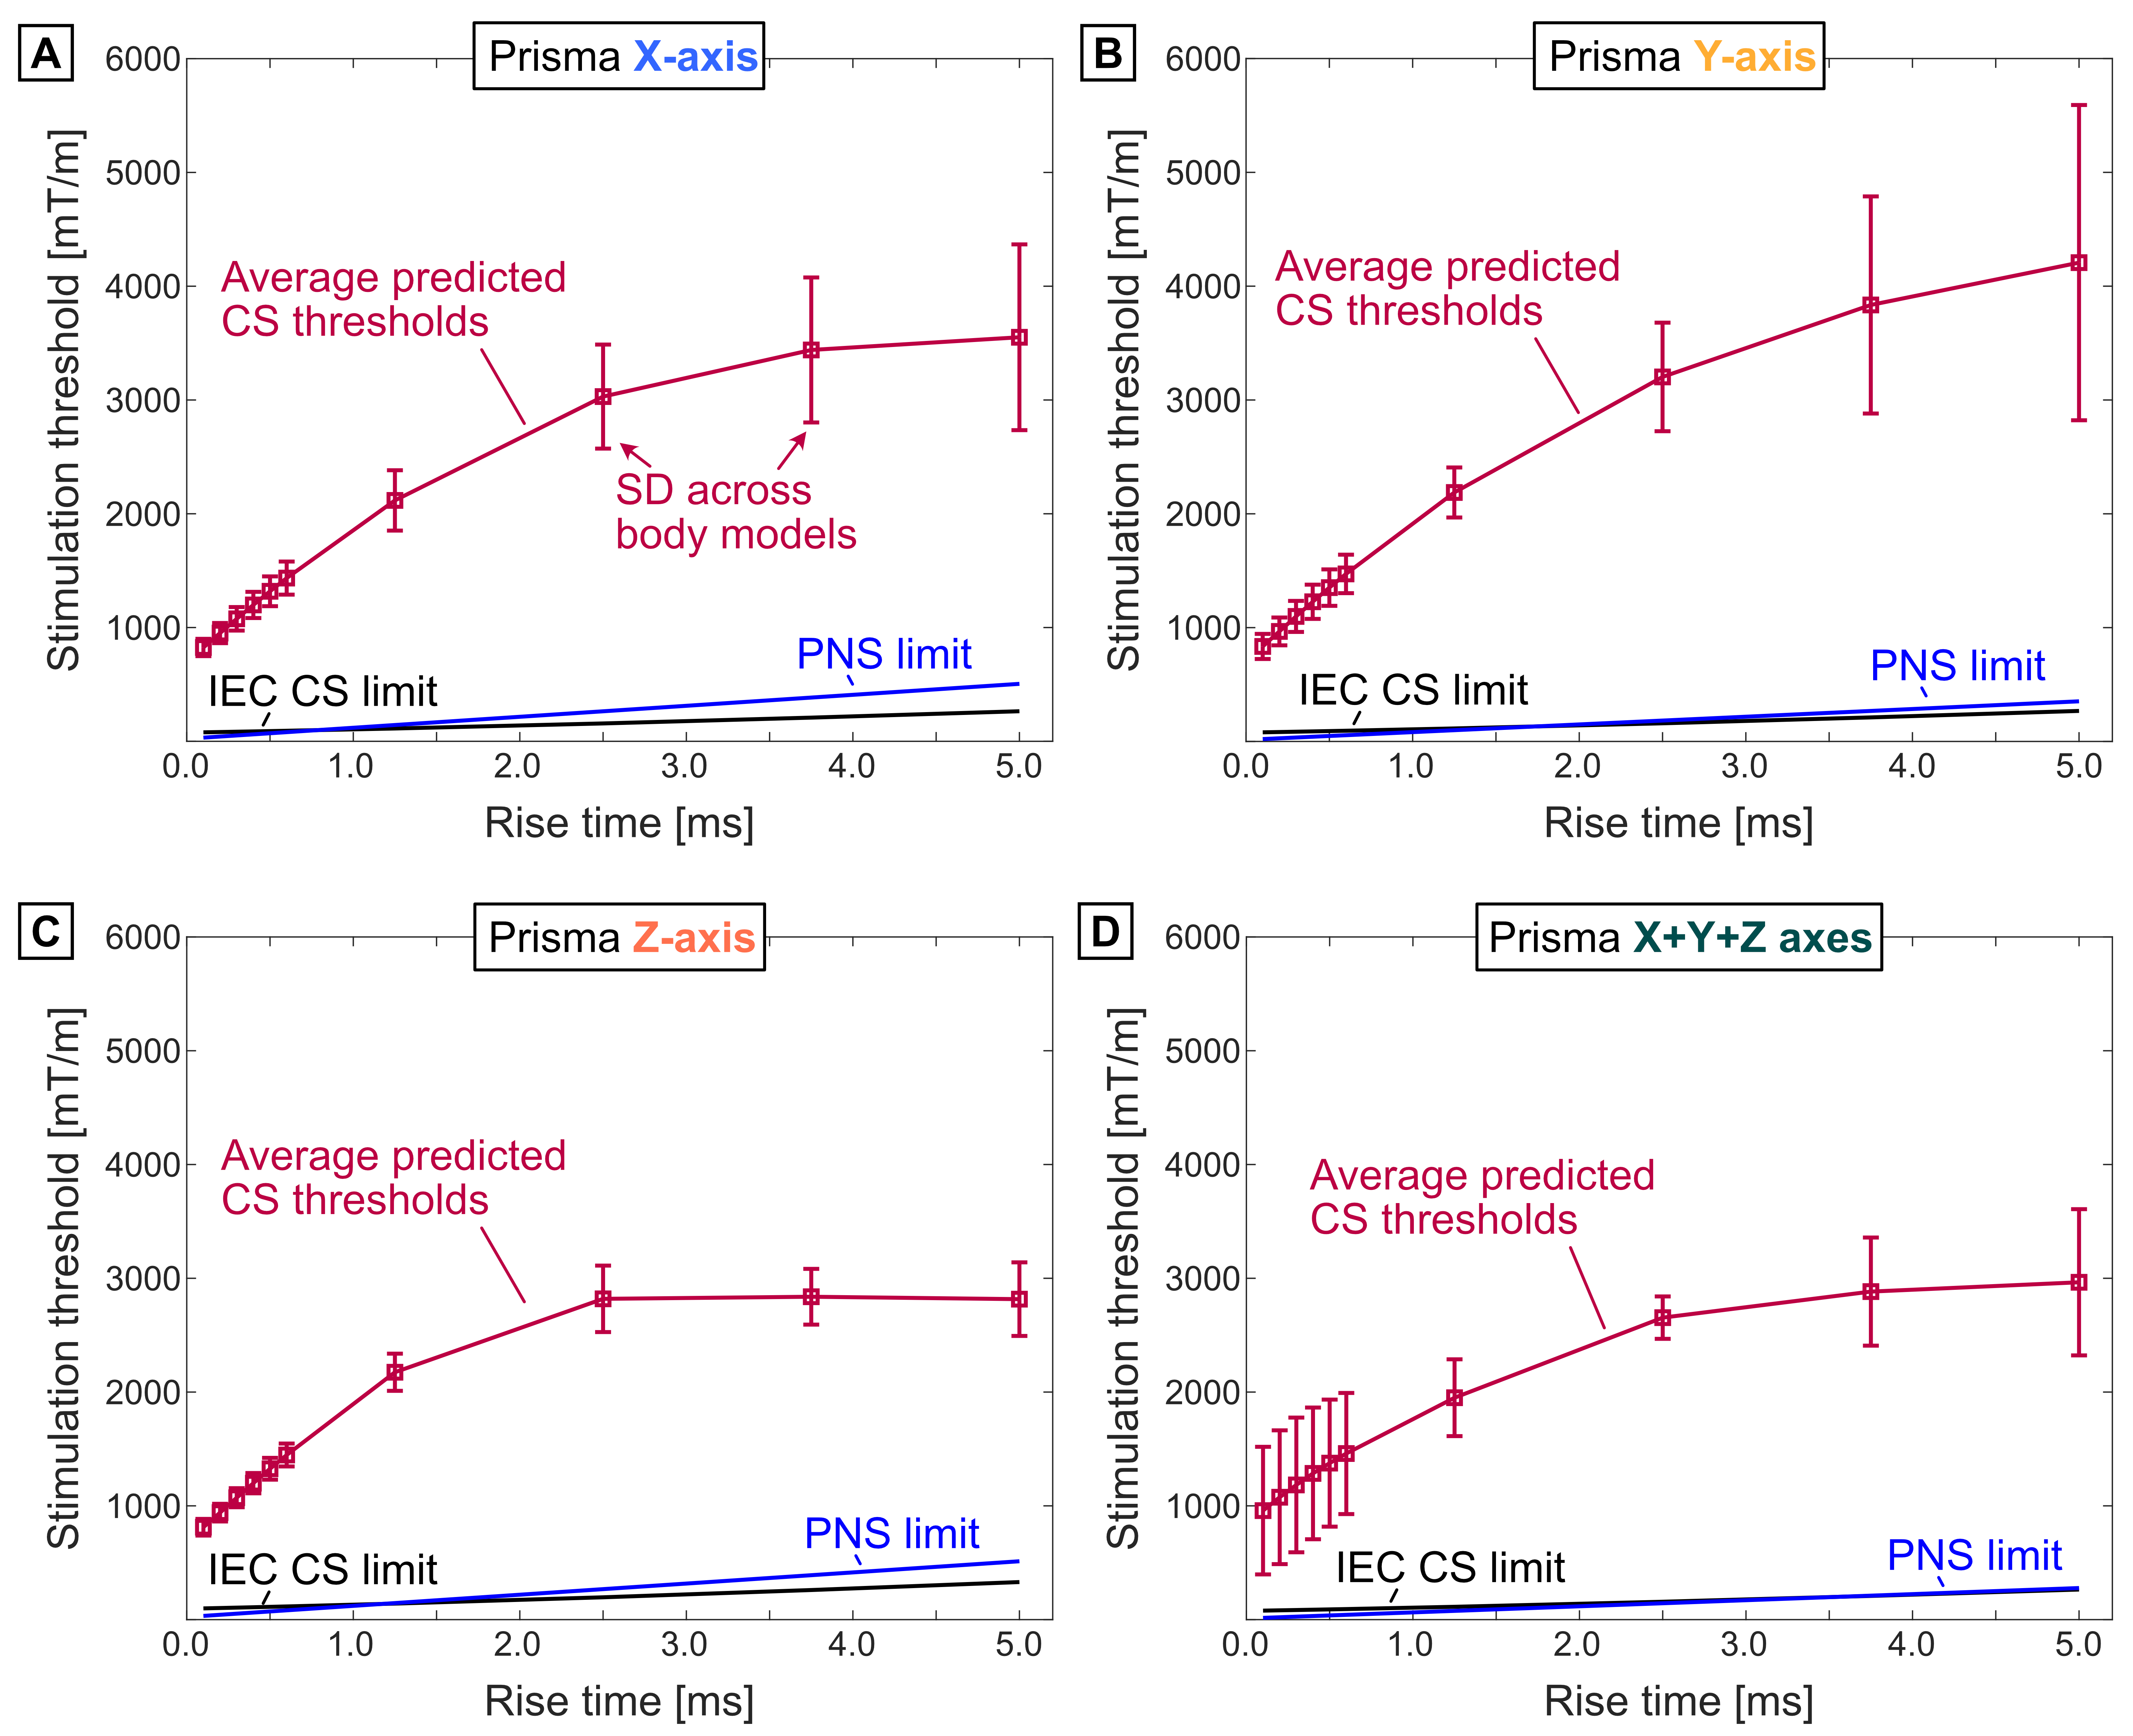
Figure 4: Predicted CS thresholds (red), IEC 60601-2-33 CS limit (black), and PNS limit (blue) for the Prisma gradient across all body models. Different panels show results for single axes and an axis combination (X+Y+Z). The PNS limit was extrapolated linearly from measurements at small rise times performed for individual axes or axis combination. The greatest variability of predicted CS thresholds across body models is 2-fold. In all cases, the minimum ratio between CS threshold and IEC CS limit is 7X.
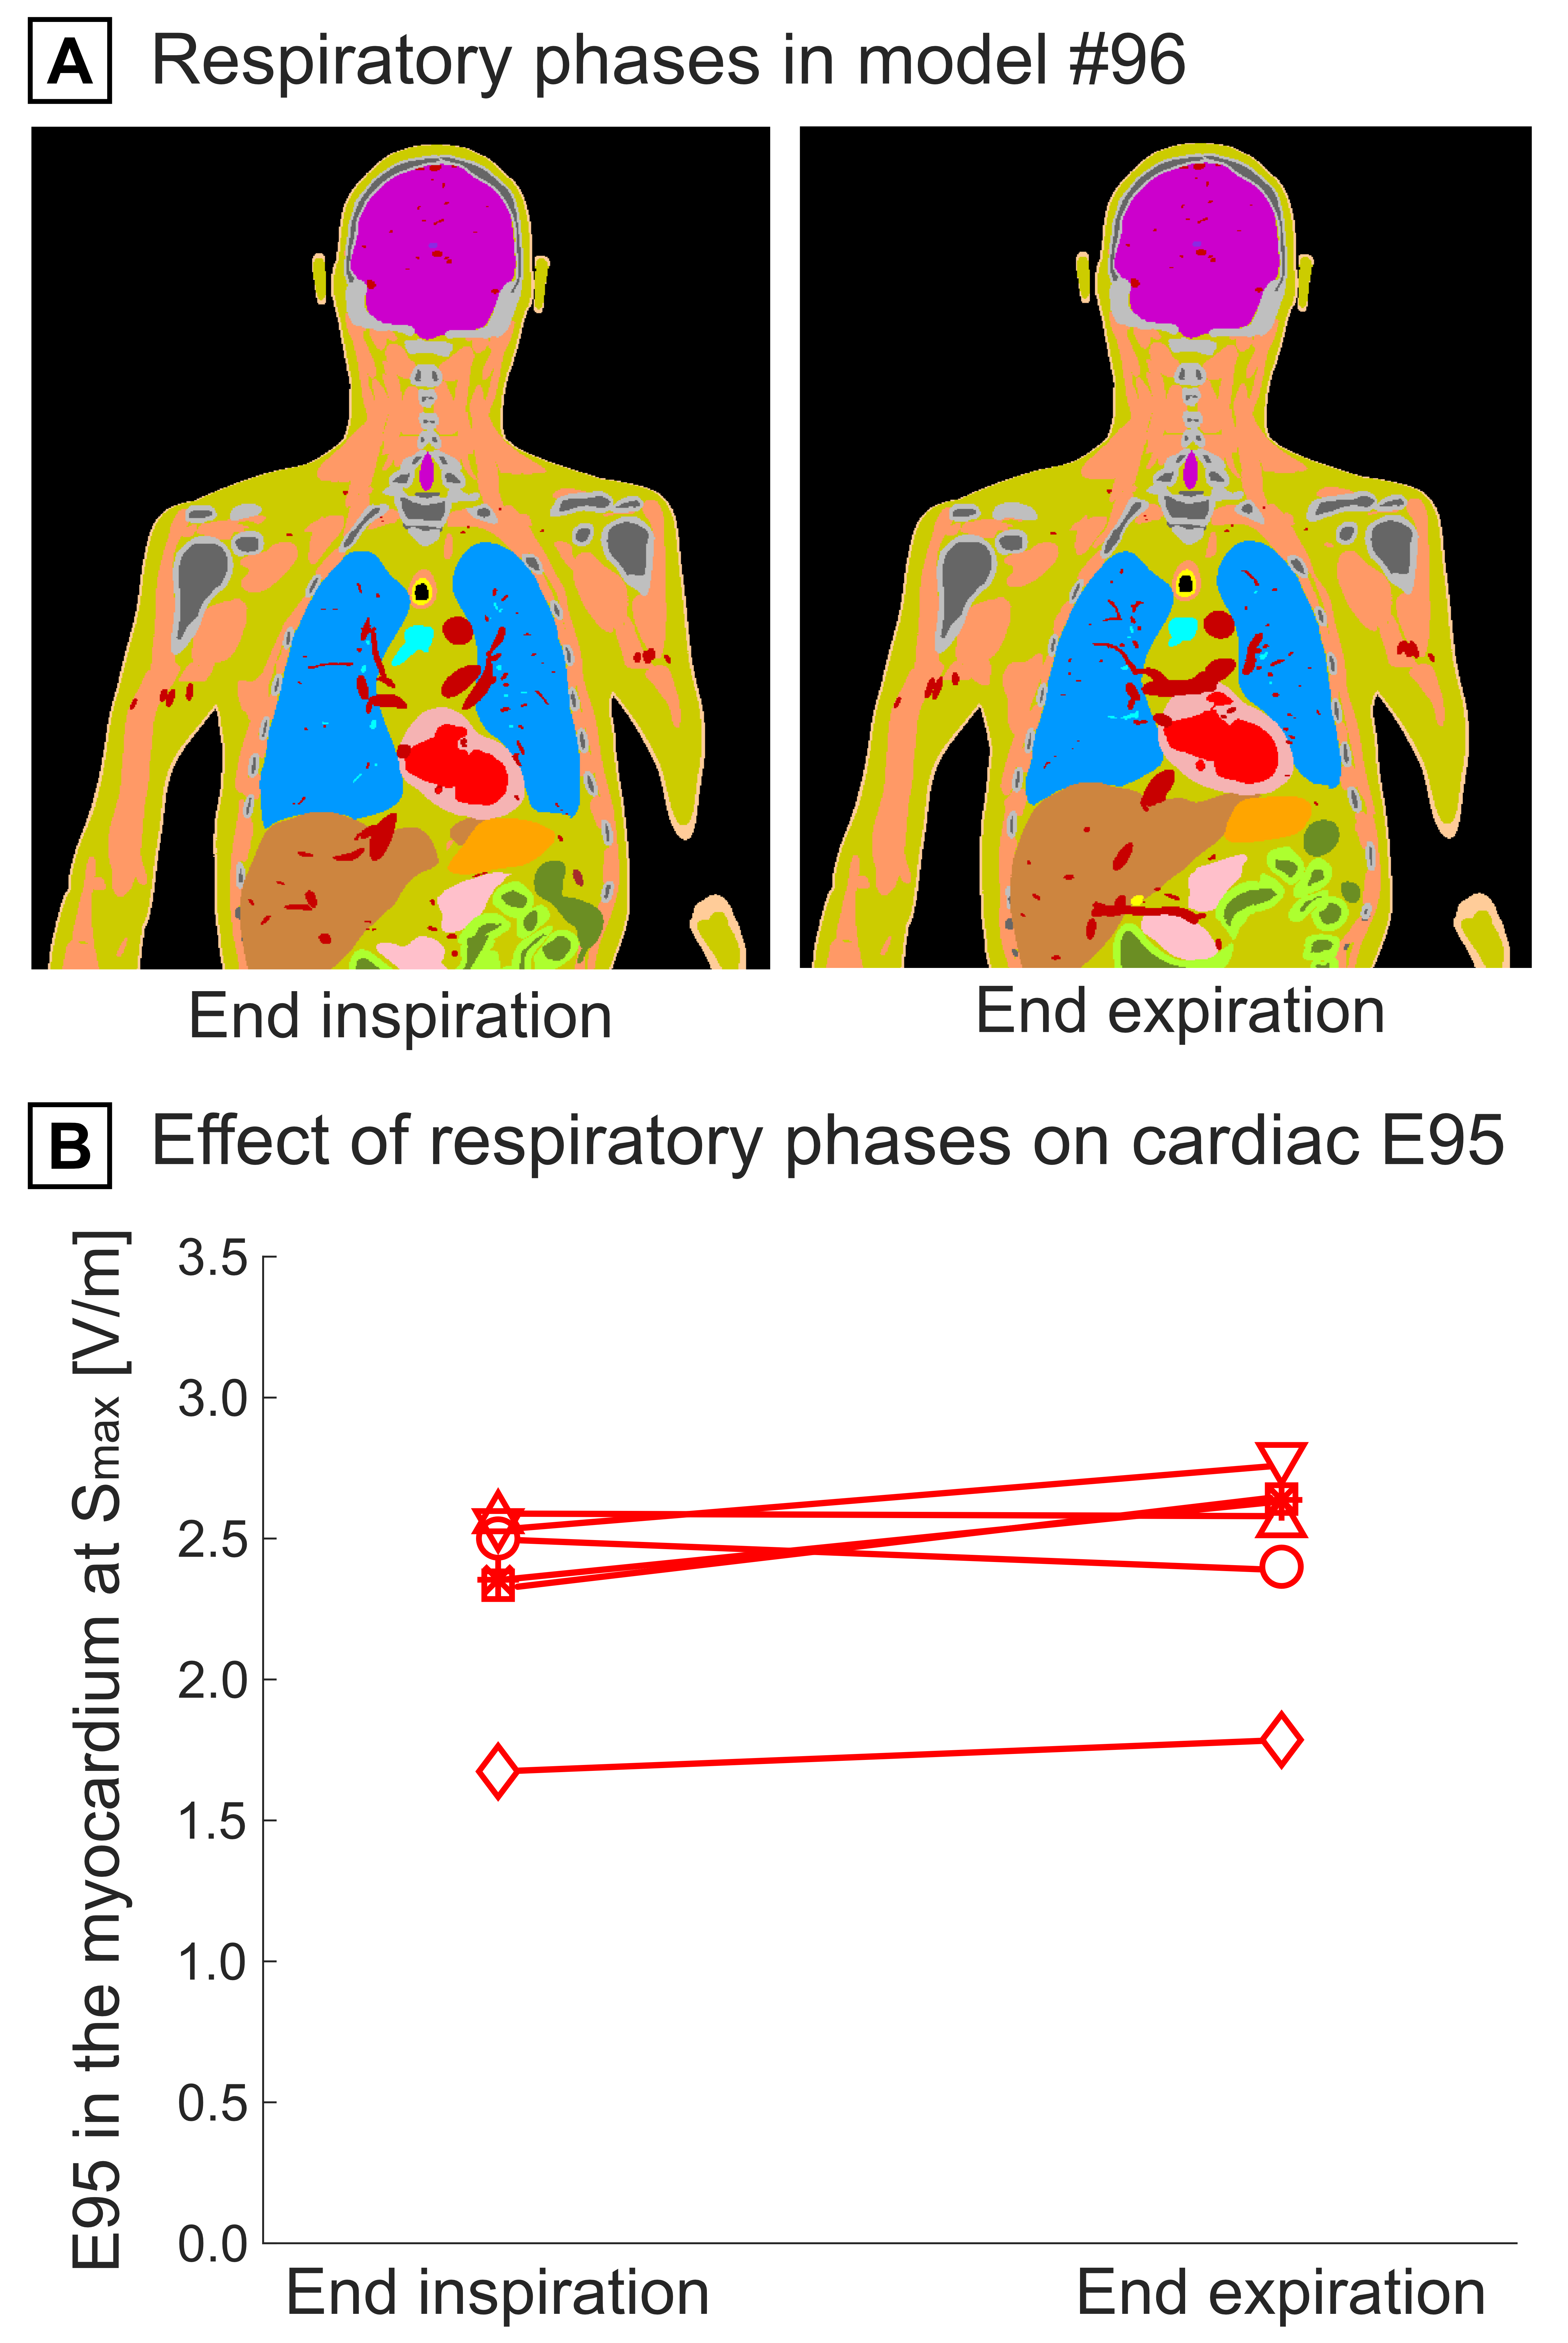
Figure 5: (A) Voxel model (model #96) for respiratory phases: End of inspiration (maximum lung volume) and end of expiration (minimum lung volume). The location and shape of the heart and surrounding tissues changes between the two phases. (B) E95 induced in the myocardium of all body models by the Prisma Y-axis coil at Smax=200 T/m/s for both respiratory phases. The maximum change in E95 between inspiration and expiration is 12%.