0783
Deep Learning-based Fully-Automated Detection and Segmentation of Small Renal Masses on Multi-sequences MRI: A Multi-center Study1Department of Radiology, the First Medical Center, Chinese PLA General Hospital, Beijing, China, 2State Key Laboratory of Cognitive Neuroscience and Learning, Beijing Normal University, Beijing, China, 3Radiology Department, Peking University First Hospital, Beijing, Beijing, China, 4Department of Radiology, Beijing Friendship Hospital, Capital Medical University, Beijing, China, 5Department of Radiology, Chinese PLA General Hospital, Beijing, China
Synopsis
Keywords: Kidney, Kidney
Motivation: Automated detection and segmentation method could serve as a fundamental step for diagnosis of small renal mass (SRM)
Goal(s): To develop and assess automated segmentation method for SRM using a deep learning method based on multi-sequences MRI
Approach: A total of 913 SRM patients from three institutions was used in deep learning model training and testing for five sequences (T2WI, T1WI, CP, NP, DP). The model was evaluated on internal and external test set using DSC (dice similarity coefficient)
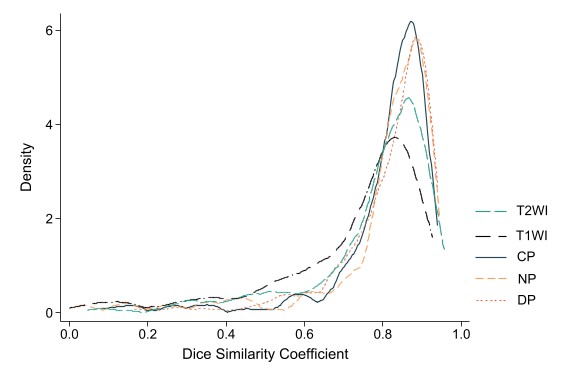
Results: The overall median DSC of five sequences (T2WI, T1WI, CP, NP, and DP) yield 0.824, 0.769, 0.845, 0.847, 0.855 on whole test set.
Impact: The value of radiomics in preoperative diagnosis of benign and malignant SRM had been proven. However, manual segmentation impeded the conduction of radiomics. Automated segmentation models could help efficiently build radiomics model and reduce radiologists’ workloads.
Introduction
Small renal mass (SRM) defined as masses less than 4 cm in the largest dimension 1, 2. Approximately 20% to 30% of resected SRM cases were found to be benign 2. Considering the overlapping imaging features of benign and malignant kidney tumors, the preoperative diagnosis is a challenge 3. The value of radiomics in preoperative diagnosis of benign and malignant SRM had been proven 4-8. Manual segmentation presented limitations in terms of time-consuming annotation, low inter-reader agreement, and the need for additional training for radiologists, which ultimately impedes the conduction of radiomics 9, 10. Consequently, there is an urgent demand for the development of automated and accurate SRM segmentation method.Despite previous studies presenting automated kidney tumor segmentation models with satisfactory accuracy 11-14, there is currently no research available on the automated segmentation of SRM. Moreover, existing studies have primarily focused on CT images or single-sequence MRI scans 11-14, whereas the diagnosis of SRM often necessitates multi-sequences MRI 15.To address the urgent clinical needs, we aim to develop an automated segmentation method for SRM based on multi-sequences MRI from a large multicenter cohort.
Methods
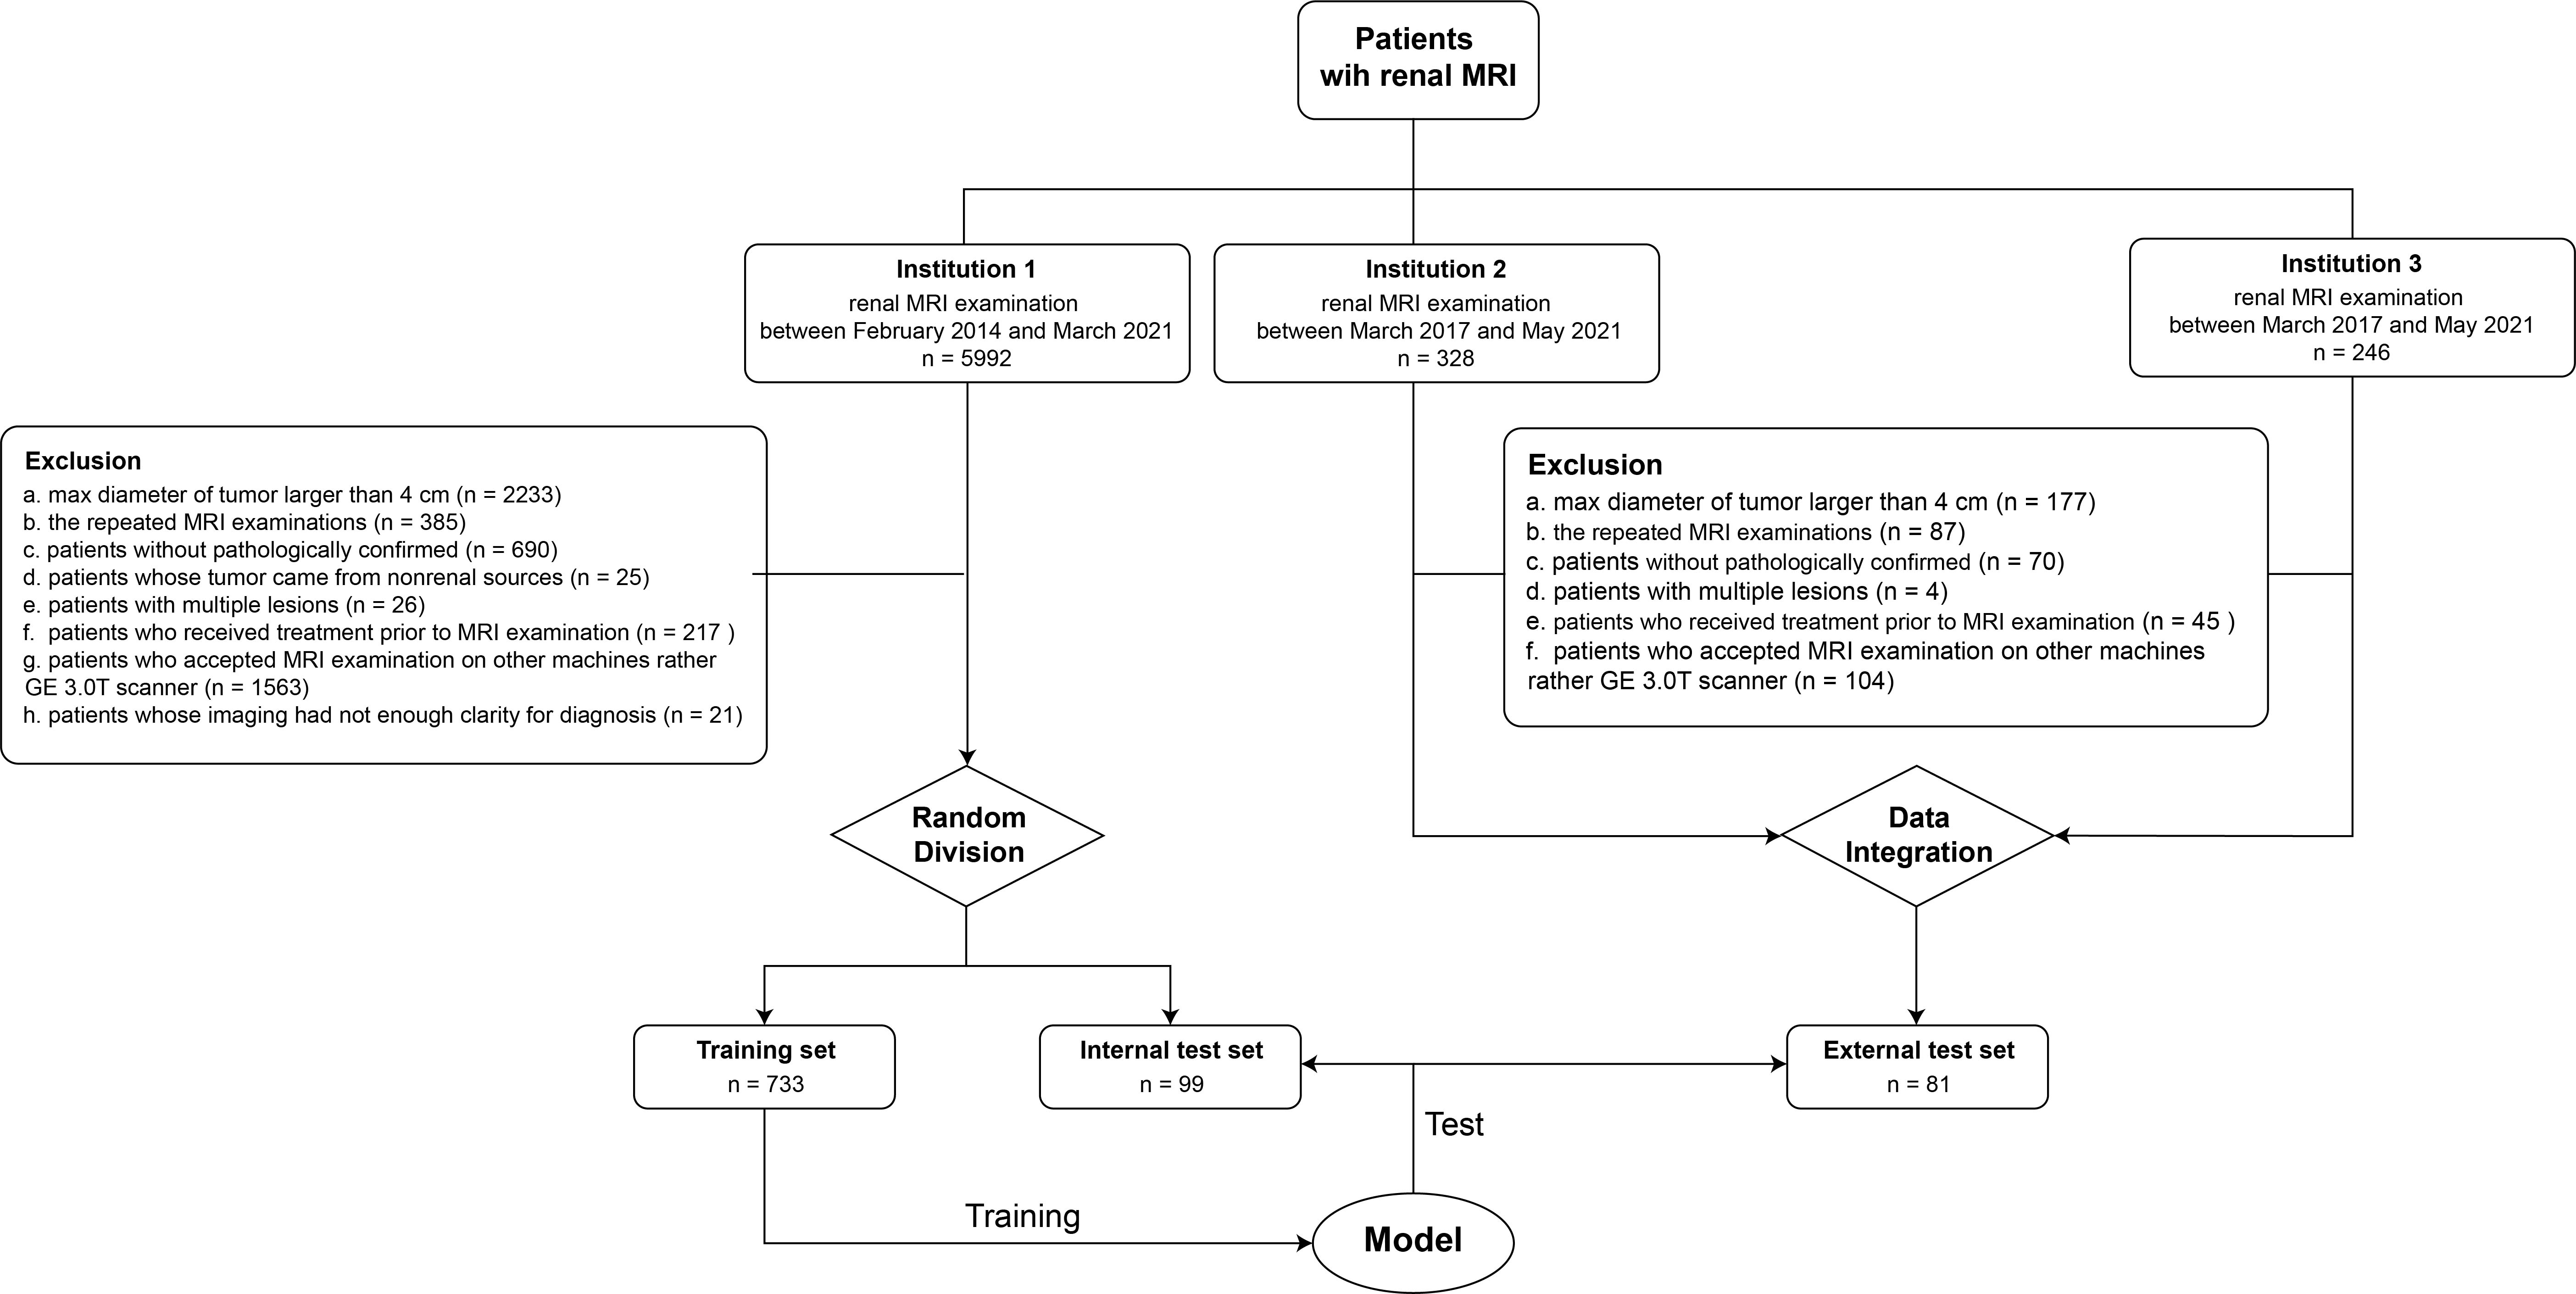
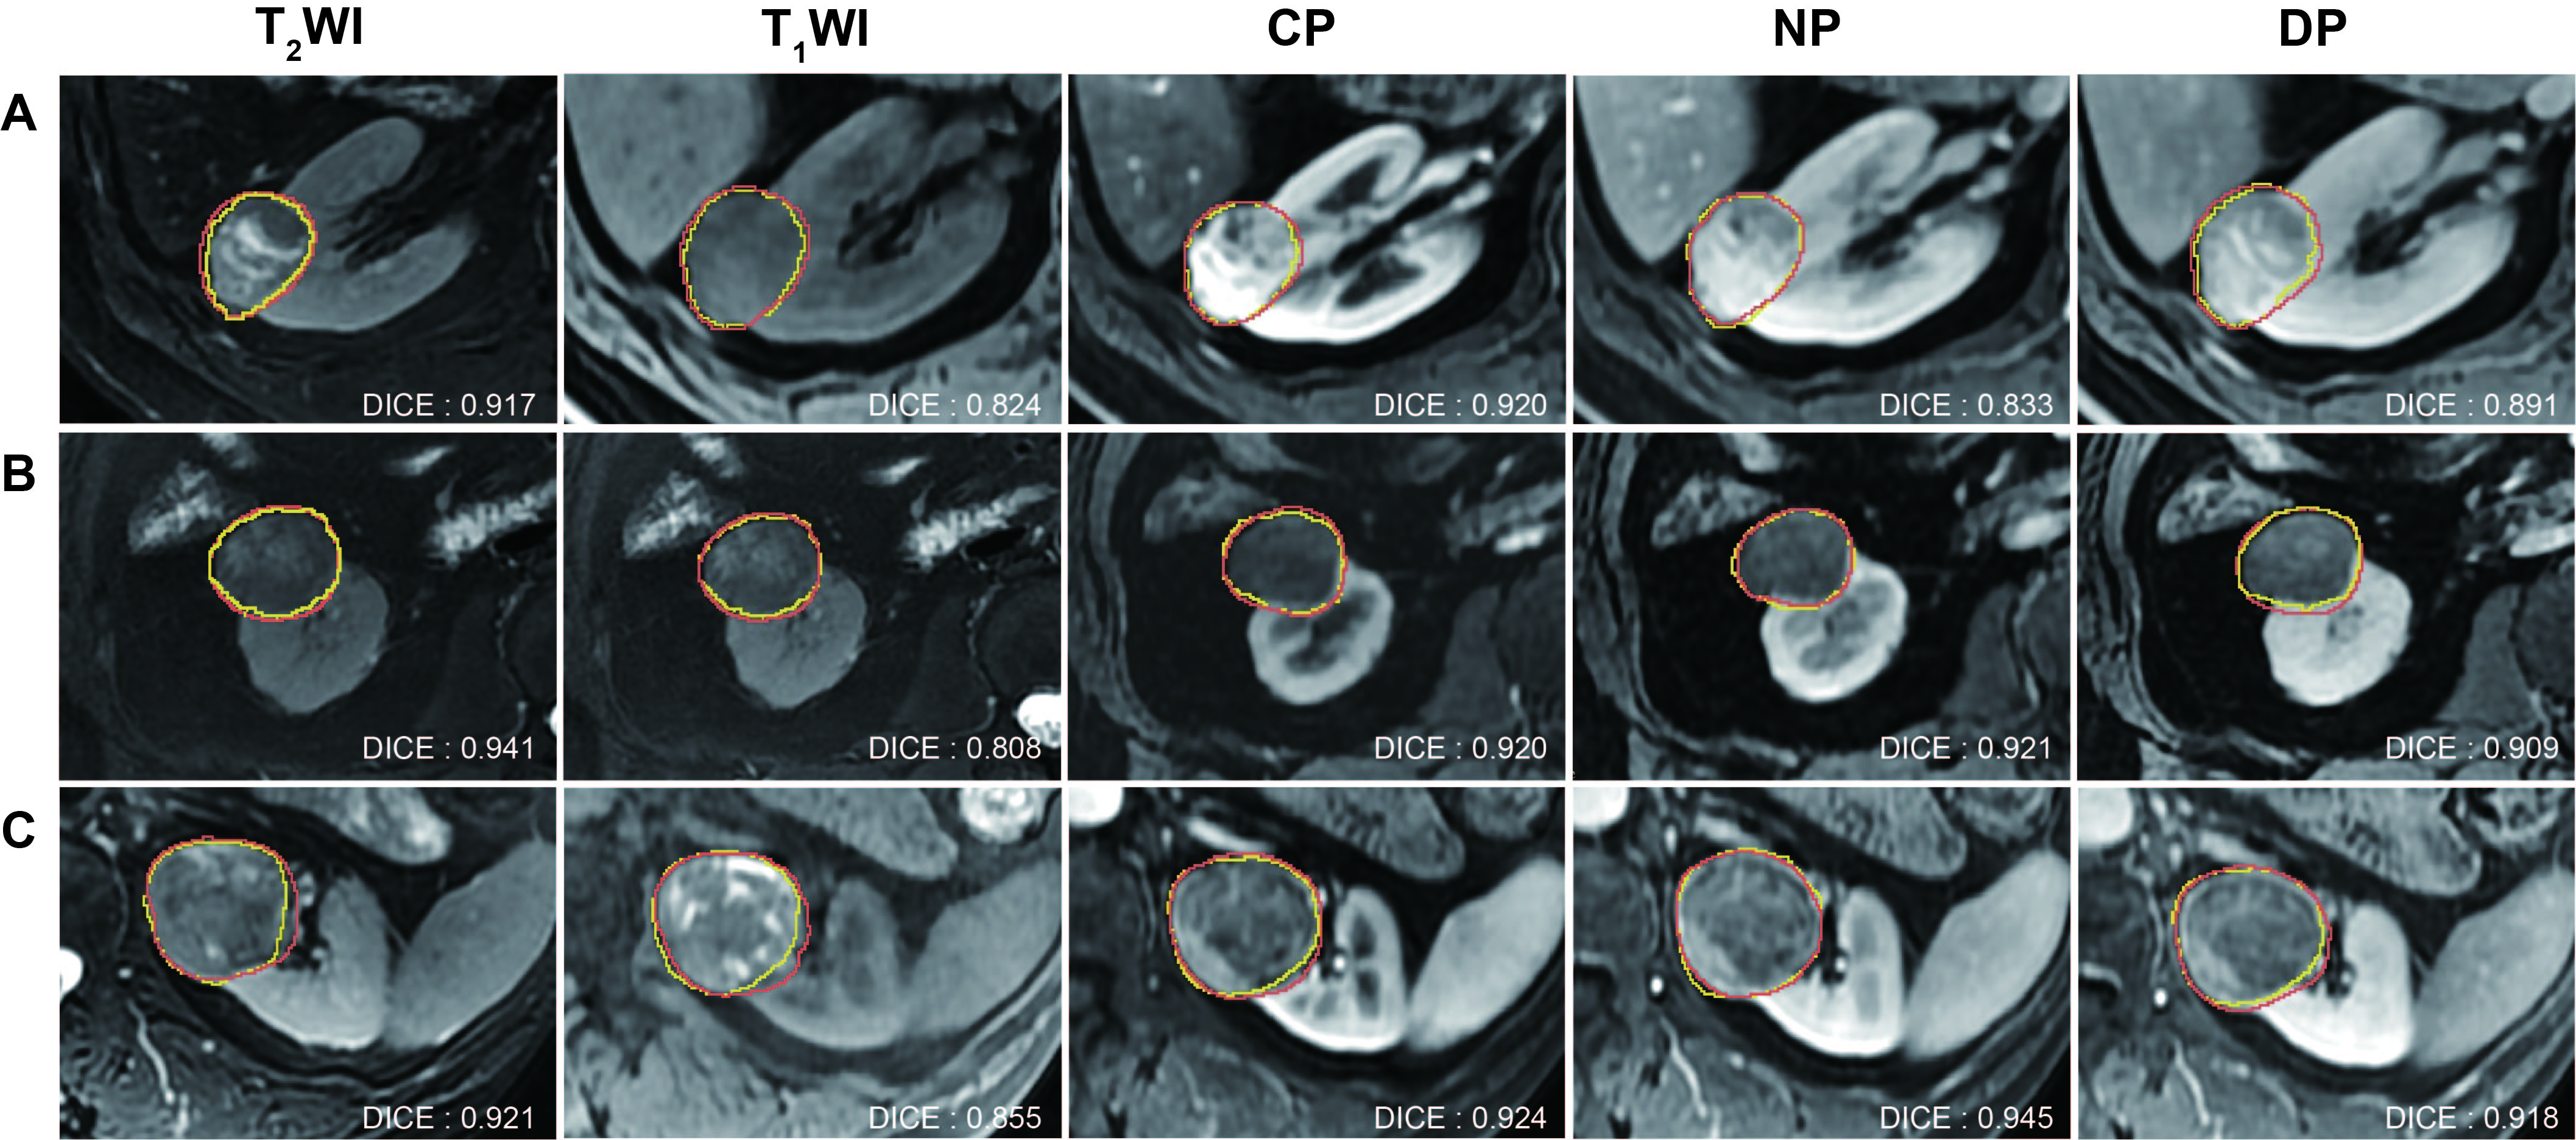
A total of 832 SRM patients were collected in Institution 1 and 81 in Institution 2 and 3. A training and internal test set was built on Institution 1, and external test set was built on Institution 2. Two trained radiologists, blinded to histopathological results, jointly performed segmentation. We adopted the 3D U-Net as the main network structure for each imaging sequence (T2WI, T1WI, corticomedullary phase [CP], nephrographic phase [NP], and delay phase [DP]). Moreover, the 5-fold cross-validation strategy was used to improve the generalization capability of these segmentation models. Subsequently, we employed the averaging ensemble strategy to combine the outputs of these five networks, producing the final segmentation results. The dice similarity coefficient (DSC) was used as evaluation metric. We evaluated the imaging features on the internal and external test sets, and multivariate analysis was performed using multiple linear regression to identify independent variables associated with segmentation performance.Results
1. Detection rateThese correct detection rates for T2WI, T1WI, CP, NP, and DP on the entire test set were found to be 97.2%, 86.1%, 94.4%, 95.0%, and 97.2%, respectively. Importantly, all cases in test set was correctly detection at least one sequence, ensuring the prevention of any missed tumor detections.
2. Segmentation accuracy
The overall median DSC value for the five sequences (T2WI, T1WI, CP, NP, DP) on the entire test set were as follows: 0.824, 0.769, 0.845, 0.847, and 0.855. Notably, no statistically significant differences in DSC scores were observed among the three participating institutions.
3. Imaging features and subgroup analysis
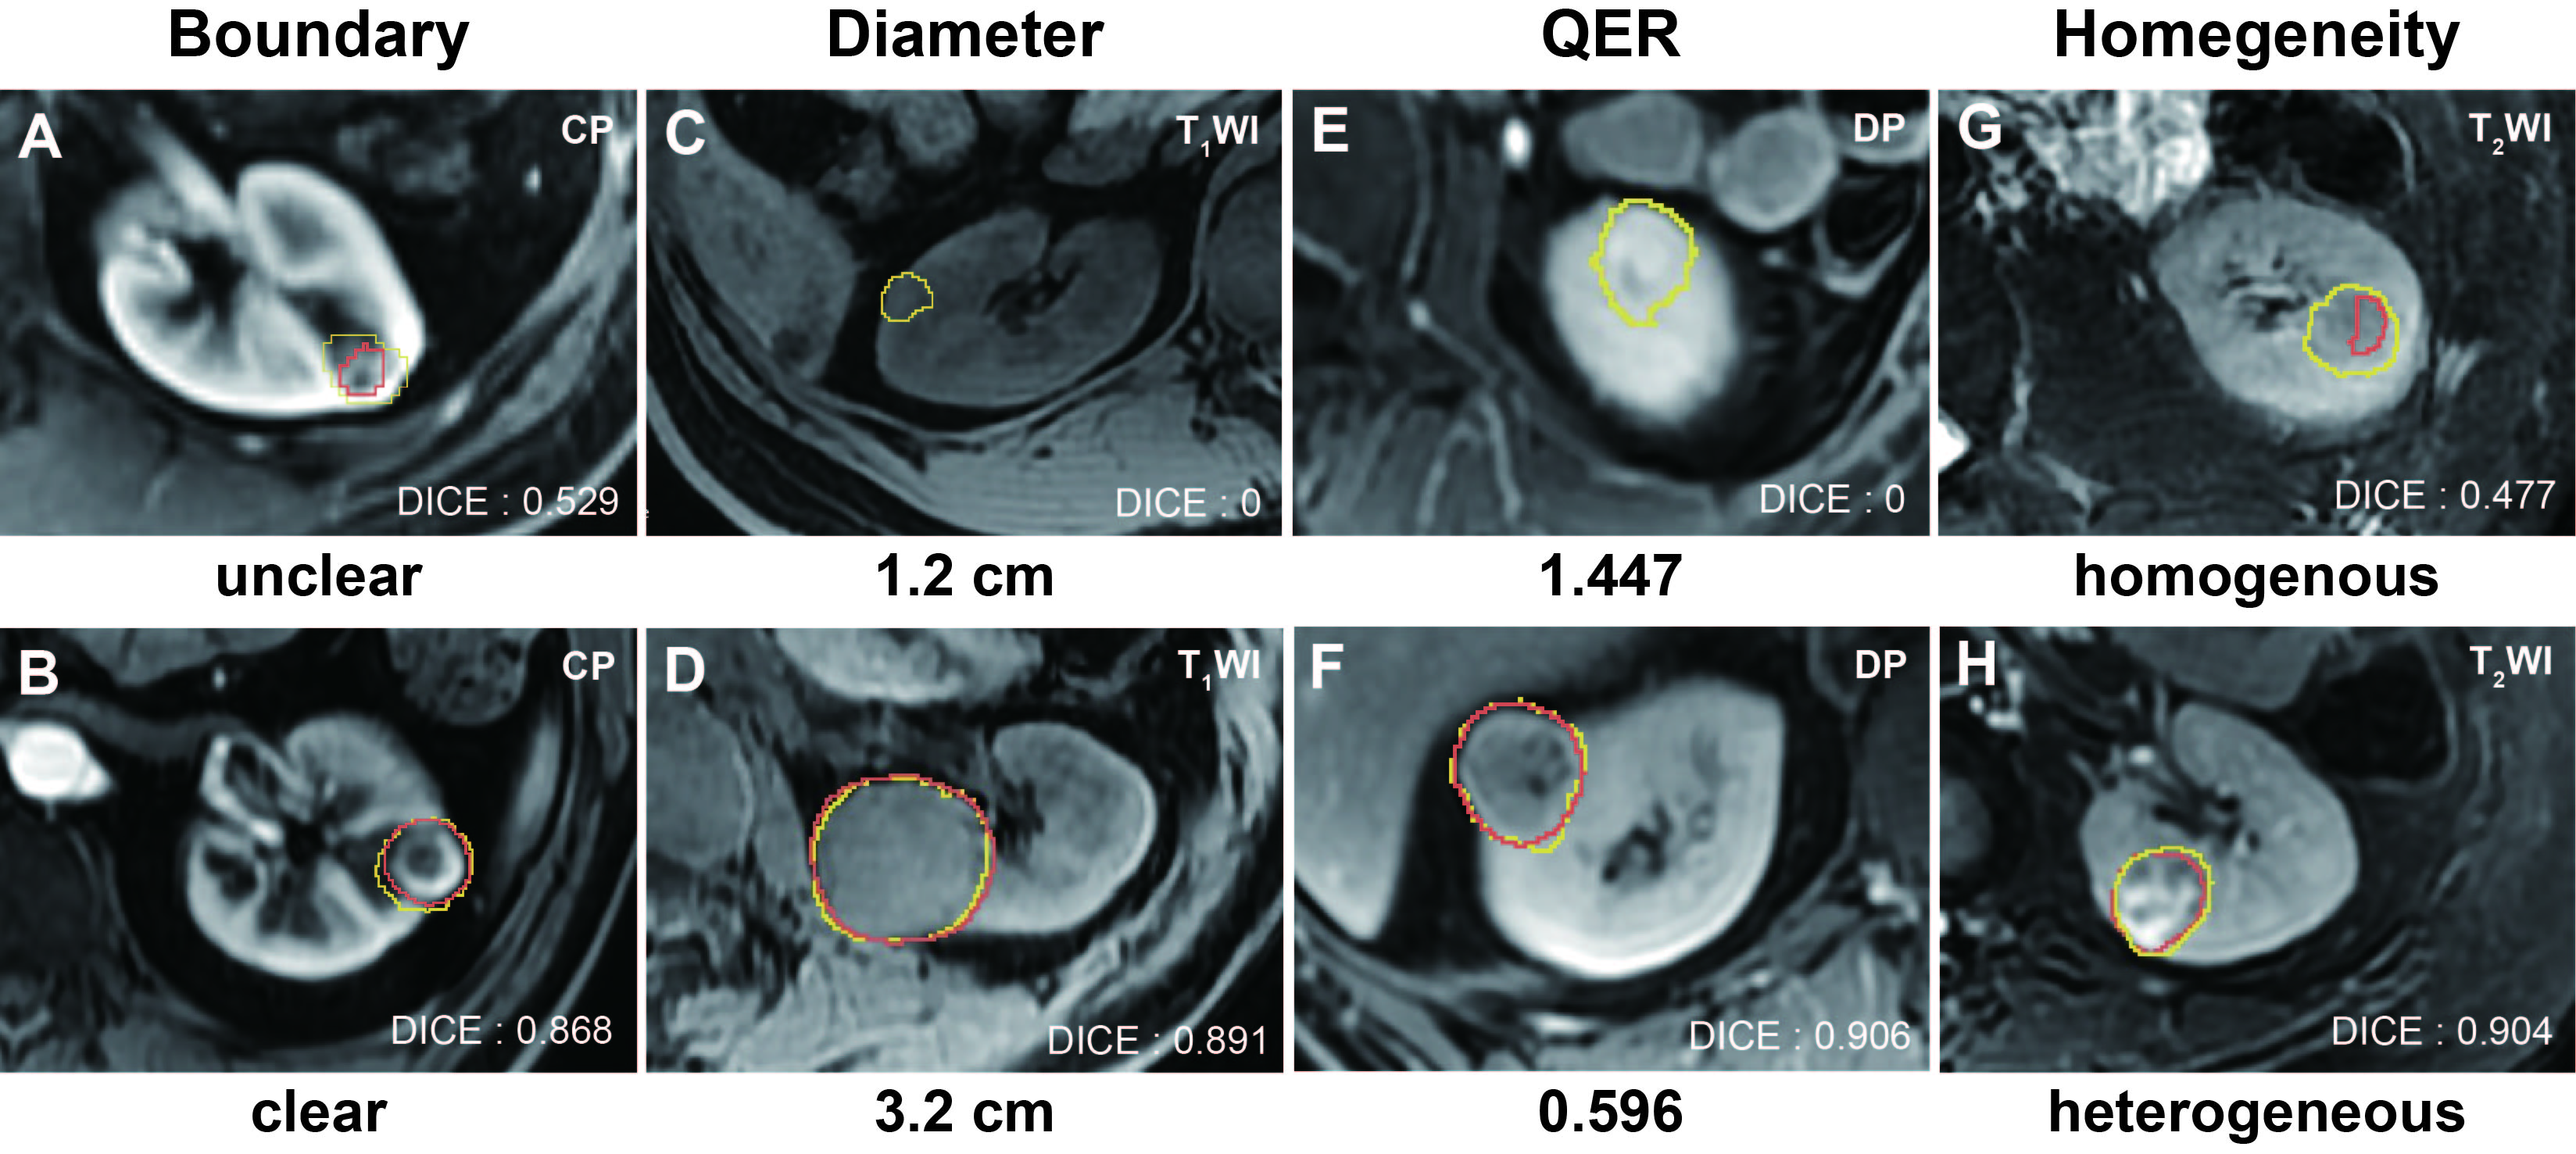
According to the multivariable linear regression model, homogeneity, tumor boundary, pseudo-capsule, growth pattern, tumor location, diameter, and QER (SItumor/SIcortex, SI represented signal intensity) were independent variables of DSC. There was no significant difference in segmentation performance in subgroups pathologic result, chief complaints, or gender.
Discussion
In this study, the automated segmentation method exhibited satisfactory performance in segmenting multi-sequences MRI, which could serve as a fundamental step for computer assisted diagnosis in SRM, contributing to reducing the misdiagnosis rate and alleviating radiologist’s workload.Several prior studies have highlighted that the effectiveness of CNNs model in the segmentation of renal tumor using CT images and singe sequence of MRI (DICE range: 0.526 ~ 0.851) 16-18. However, owing to the limited soft tissue contrast, CT exhibits moderate sensitivity in diagnosing renal tumors 19. In comparison, multi-sequences MRI offers superior soft tissue contrast and can serve as an alternative to biopsy for certain pathological types of renal tumors 20. Compared with previous studies, we used multi-sequences MRI rather than CT imaging or single sequence MRI and tested our method on multi-center images, and still obtained a comparable performance to the best result of previous studies. To our knowledge, this study included the largest SRM cohort currently.
The multivariable linear regression results revealed that tumor boundary, growth pattern, and diameter stood out as those occurring with the greatest frequency. tumor diameter was related to the segmentation performance on T1WI, CP, and NP. Meanwhile, it did not affect the performance on T2WI and DP. Additionally, T2WI and DP exhibited relatively few independent variables compared to T1WI, CP, and NP. These findings suggest that the automated segmentation method using T2WI could be considered as a reliable screening and active surveillance tool in clinical practice for SRM patients.
Conclusion
The automated segmentation method for solid SRM based on multi-sequences MRI presents a promising result in SRM detection and segmentation.Acknowledgements
We acknowledge the patients whose samples/data provided the foundation for this study, and are grateful to the multidisciplinary team of urology in the Chinese PLA General.This work was supported by the National Natural Science Foundation of China (Grant 81971580 and 82271951) and Beijing Natural Science Foundation (7222167).References
1. Gill IS, Aron M, Gervais DA, Jewett MA. Clinical practice. Small renal mass. N Engl J Med. 2010;362(7):624-34.
2. Johnson DC, Vukina J, Smith AB, et al. Preoperatively misclassified, surgically removed benign renal masses: a systematic review of surgical series and United States population level burden estimate. J Urol. 2015;193(1):30-5.
3. Wang ZJ, Westphalen AC, Zagoria RJ. CT and MRI of small renal masses. The British Journal of Radiology. 2018;91(1087):20180131.
4. Li X, Ma Q, Tao C, et al. A CT-based radiomics nomogram for differentiation of small masses (< 4 cm) of renal oncocytoma from clear cell renal cell carcinoma. Abdom Radiol (NY). 2021;46(11):5240-9.
5. Yang R, Wu J, Sun L, et al. Radiomics of small renal masses on multiphasic CT: accuracy of machine learning-based classification models for the differentiation of renal cell carcinoma and angiomyolipoma without visible fat. European radiology. 2020;30(2):1254-63.
6. Feng Z, Rong P, Cao P, et al. Machine learning-based quantitative texture analysis of CT images of small renal masses: Differentiation of angiomyolipoma without visible fat from renal cell carcinoma. Eur Radiol. 2018;28(4):1625-33.
7. Tanaka T, Huang Y, Marukawa Y, et al. Differentiation of Small (≤ 4 cm) Renal Masses on Multiphase Contrast-Enhanced CT by Deep Learning. AJR Am J Roentgenol. 2020;214(3):605-12.
8. Haji-Momenian S, Lin Z, Patel B, et al. Texture analysis and machine learning algorithms accurately predict histologic grade in small (< 4 cm) clear cell renal cell carcinomas: a pilot study. Abdom Radiol (NY). 2020;45(3):789-98.
9. Chiappiniello A, Tarducci R, Muscio C, et al. Automatic multispectral MRI segmentation of human hippocampal subfields: an evaluation of multicentric test-retest reproducibility. Brain Struct Funct. 2021;226(1):137-50.
10. Zhao B. Understanding Sources of Variation to Improve the Reproducibility of Radiomics. Frontiers in oncology. 2021;11:633176.
11. Woznicki P, Siedek F, van Gastel MDA, et al. Automated Kidney and Liver Segmentation in MR Images in Patients with Autosomal Dominant Polycystic Kidney Disease: A Multicenter Study. Kidney360. 2022;3(12):2048-58.
12. Simms RJ, Doshi T, Metherall P, et al. A rapid high-performance semi-automated tool to measure total kidney volume from MRI in autosomal dominant polycystic kidney disease. Eur Radiol. 2019;29(8):4188-97.
13. Sharbatdaran A, Romano D, Teichman K, et al. Deep Learning Automation of Kidney, Liver, and Spleen Segmentation for Organ Volume Measurements in Autosomal Dominant Polycystic Kidney Disease. Tomography. 2022;8(4):1804-19.
14. Gottlich HC, Gregory AV, Sharma V, et al. Effect of Dataset Size and Medical Image Modality on Convolutional Neural Network Model Performance for Automated Segmentation: A CT and MR Renal Tumor Imaging Study. J Digit Imaging. 2023;36(4):1770-81.
15. Schieda N, Davenport MS, Silverman SG, et al. Multicenter Evaluation of Multiparametric MRI Clear Cell Likelihood Scores in Solid Indeterminate Small Renal Masses. Radiology. 2022;303(3):590-9.
16. Kim T, Lee KH, Ham S, et al. Active learning for accuracy enhancement of semantic segmentation with CNN-corrected label curations: Evaluation on kidney segmentation in abdominal CT. Sci Rep. 2020;10(1):366.
17. Lin Z, Cui Y, Liu J, et al. Automated segmentation of kidney and renal mass and automated detection of renal mass in CT urography using 3D U-Net-based deep convolutional neural network. Eur Radiol. 2021;31(7):5021-31.
18. Liu J, Yildirim O, Akin O, Tian Y. AI-Driven Robust Kidney and Renal Mass Segmentation and Classification on 3D CT Images. Bioengineering (Basel). 2023;10(1).
19. Woo S, Suh CH, Cho JY, Kim SY, Kim SH. Diagnostic Performance of CT for Diagnosis of Fat-Poor Angiomyolipoma in Patients With Renal Masses: A Systematic Review and Meta-Analysis. AJR Am J Roentgenol. 2017;209(5):W297-W307.
20. Wilson MP, Patel D, Murad MH, et al. Diagnostic Performance of MRI in the Detection of Renal Lipid-Poor Angiomyolipomas: A Systematic Review and Meta-Analysis. Radiology. 2020;296(3):511-20.
Figures