0780
Monitoring diabetic kidney disease progression with DTI and tractography1The University of Sheffield, Sheffield, United Kingdom, 2Antaros Medical AB, Mölndal, Sweden, 3Department of Biomedical Imaging Sciences, University of Leeds, Leeds, United Kingdom, 4University of Exeter Medical School, Exeter, United Kingdom, 5Leeds Teaching Hospitals NHS Trust, Leeds, United Kingdom, 6Department of Clinical Sciences, Lund University Diabetes Centre, Malmö, Sweden
Synopsis
Keywords: Kidney, Kidney
Motivation: Previous studies have shown that DTI and tractography may act as early indicator of DKD.
Goal(s): The aim of this study was to identify DTI biomarkers that may be sensitive to changes over a relatively short 2-year time frame in early-stage DKD.
Approach: Thirteen type-2 diabetic patients were scanned two times during a two-year period on a 3T MRI scanner using a free-breathing diffusion protocol. 180 biomarkers from DTI and tractography were calculated with DIPY.
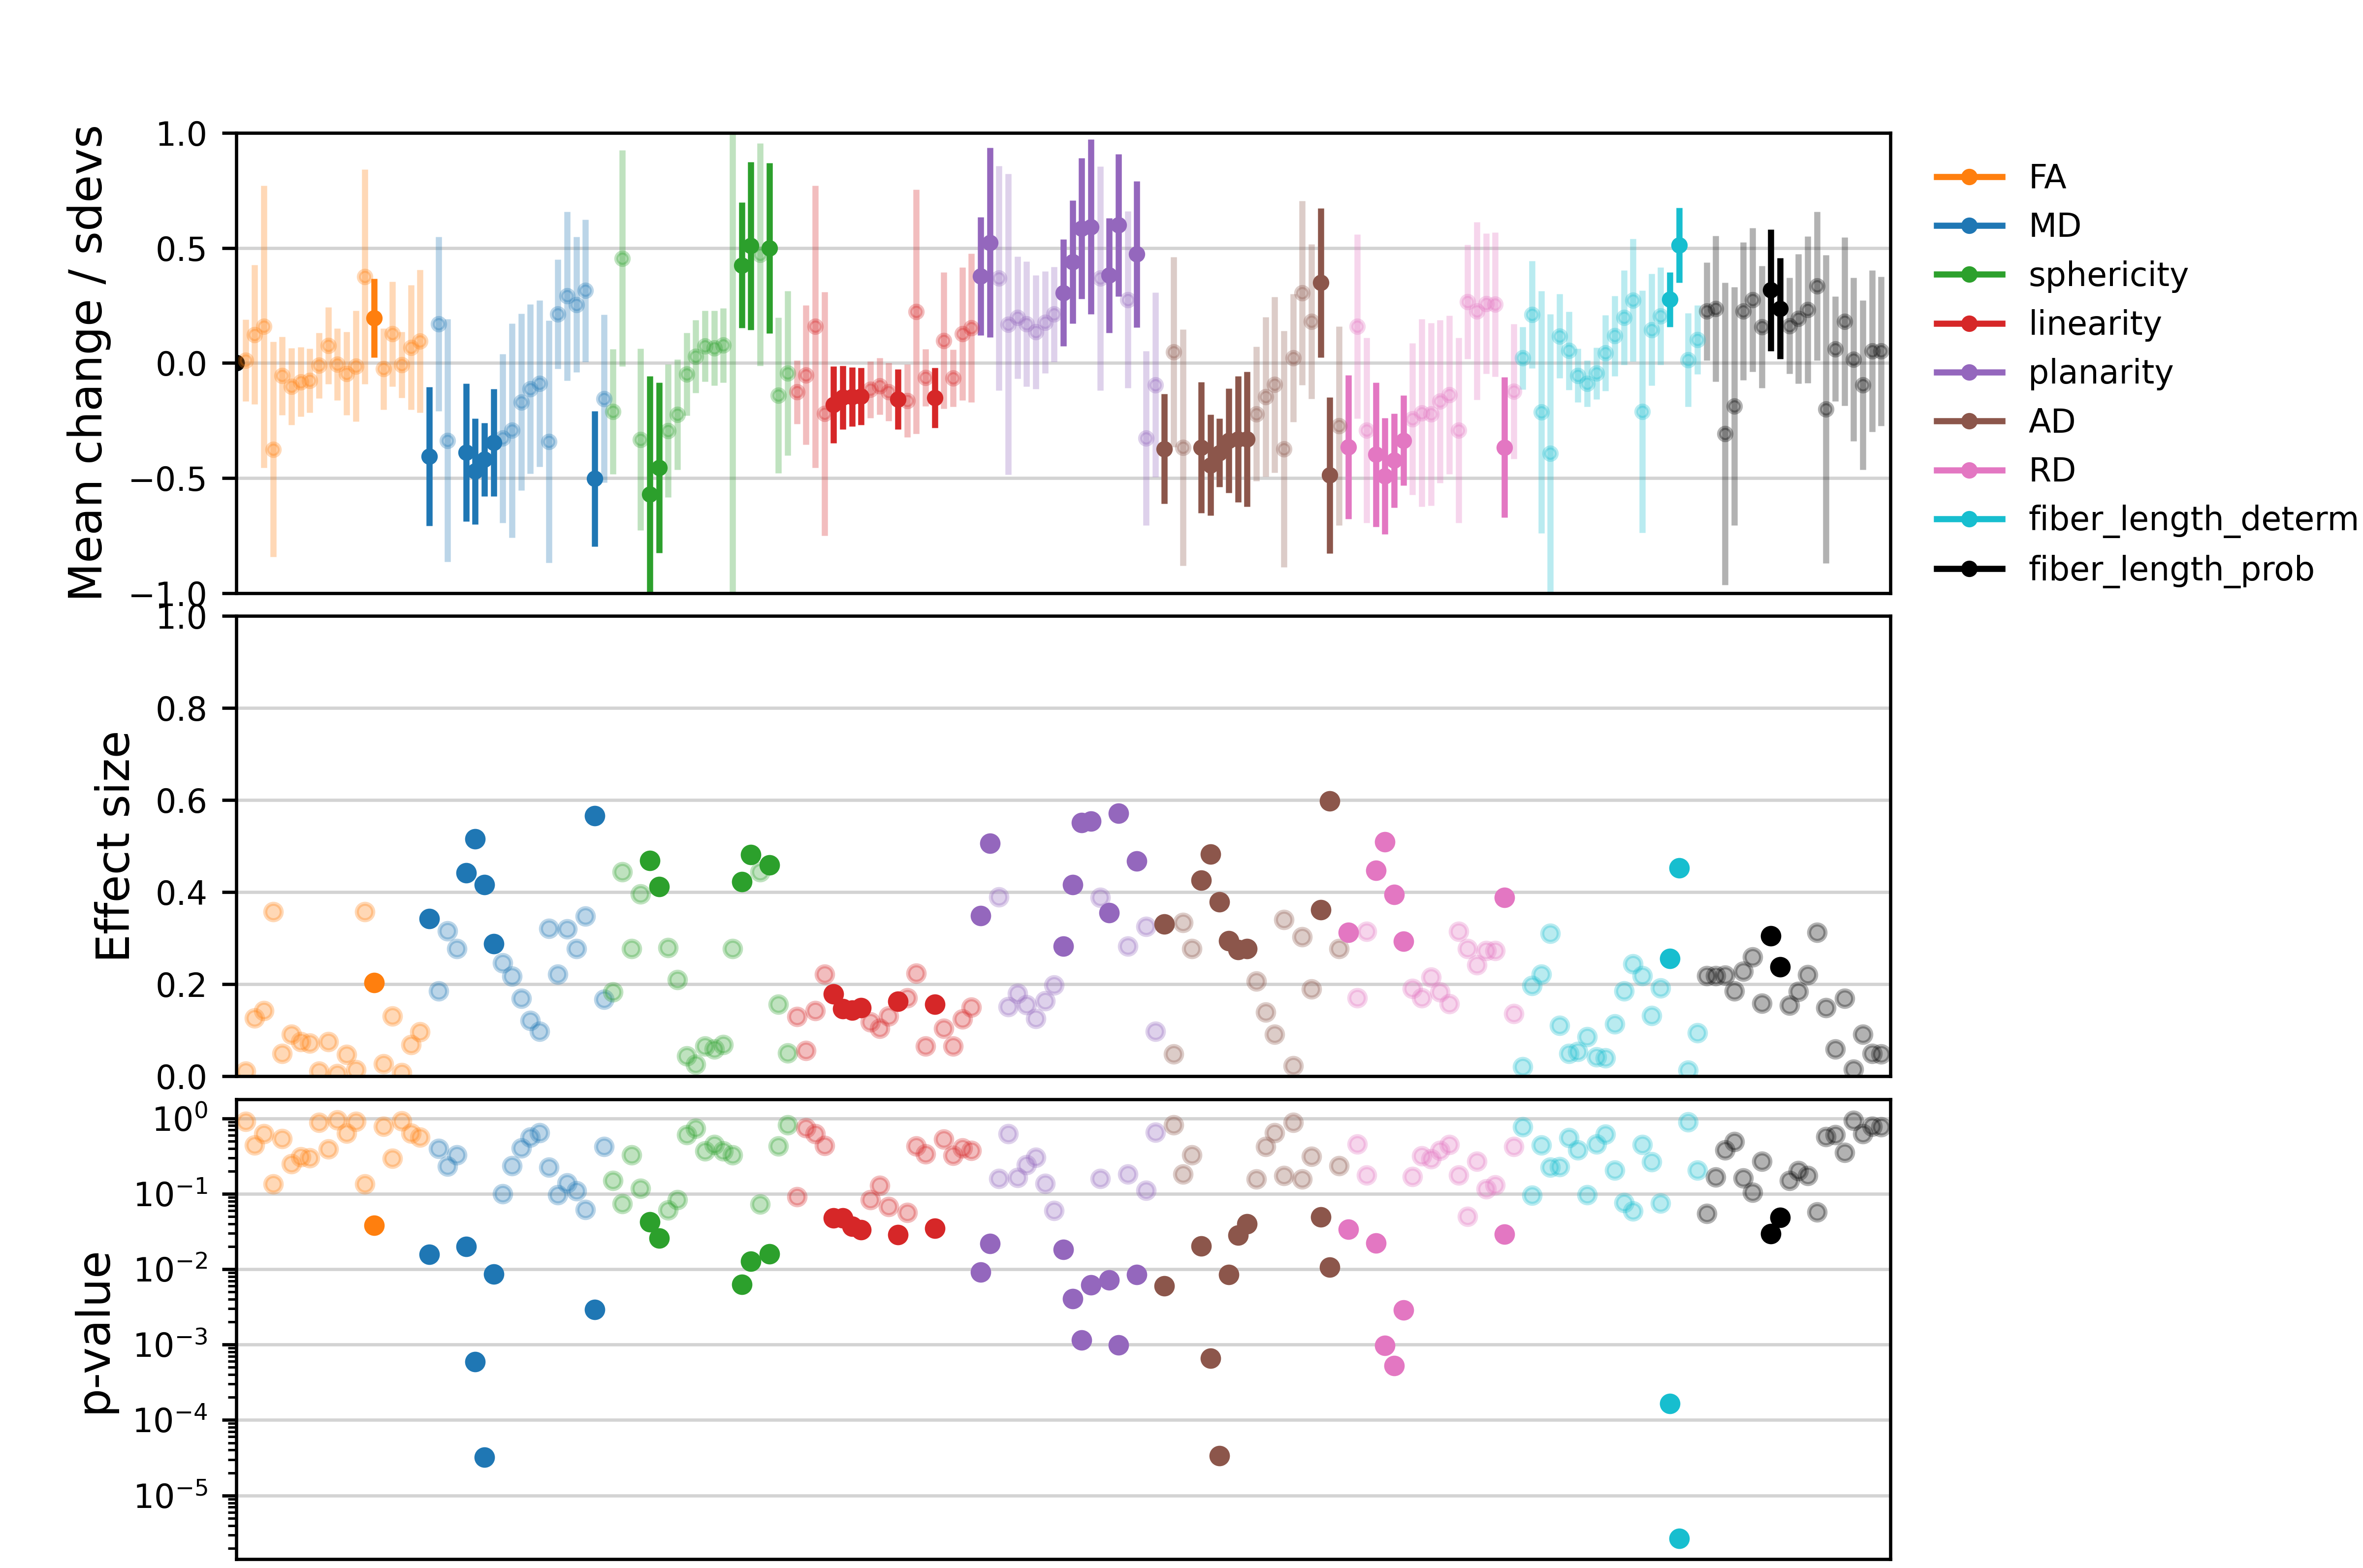
Results: 46 biomarkers showed a significant change over the 2 years, with mean changes that reach over ½ of a standard-deviation and cohen-d effect-sizes up to 0.6
Impact: DTI biomarkers show strong changes in early-stage diabetic kidney disease over 2-years, a time frame where clinical biomarkers are typically stable. This finding may have significant implications for clinical practice if confirmed in the larger population.
Introduction
Progression of diabetic kidney disease (DKD) is currently monitored with clinical markers eGFR (estimated glomerular filtration rate) and UACR (urine albumin-creatinine ratio). Unfortunately these only respond in advanced stages of the disease, when the management options for reducing the rate of decline are more limited. A wide array of novel blood- and urine biomarkers have been proposed to pick up disease progression earlier, but these have so far failed to deliver in patients [1].Previous studies have shown that diffusion tensor imaging (DTI) and tractography may act as early indicator of DKD, correlate with pathological measures of fibrosis and predict the decline of kidney function in chronic kidney disease [2-7]. The aim of this study was to identify DTI biomarkers that may be sensitive to changes over a relatively short 2-year time frame in early stage DKD.
Methods
Data acquisition: Thirteen type 2 diabetic patients with eGFR greater or equal to 30 mL/min/1.73m2 were scanned two times during a two-year period on MAGNETOM Prisma 3T MRI (Siemens Healthcare GmbH, Erlangen, Germany) using the MRI protocol of the iBEAt study [8]: free-breathing single-shot EPI readout (TE=70ms, TR=5100ms, GRAPPA=2, 30 slices) with a pulsed-gradient spin-echo (PGSE), consisting of two diffusion-weighting shells (number of directions) of b = 100 s/mm2 (24 directions), 600 s/mm2 (122 directions) with 3 non-diffusion-weighted volumes (~ 0 s/mm2). All patients arrived fasted (>8hrs) and were provided with standardized meal and fluid prior to the MRI scan.Image processing: Images were processed using DIPY open-source python library, in two different ways: (1) Using reconst.dti function library from DIPY: mean diffusivity (MD), fraction anisotropy (FA), axial diffusivity (AD), radial diffusivity (RD), sphericity, planarity and linearity were calculated from the DWI images. (2) Tractography: fibres were reconstructed using a deterministic (deterministic maximum direction getter) and a probabilistic fibre tracking (probabilistic direction getter) algorithm from DIPY tracking function library. A minimum FA threshold of 0.10 and a maximum turning angle of 55° between two adjacent voxels were used. Fibre lengths were extracted from the two tracking methods.
Image analysis: Whole kidney ROIs were placed over the left and right kidney for baseline and follow-up scans. For each of the 9 parameters 20 metrics were extracted: mean, standard-deviation, median, minimum, maximum, percentiles (2.5%, 5%, 10%, 25%, 75%, 90%, 95% and 97.5%), inter-quartile range, range, 90% range, coefficient of variation, heterogeneity, kurtosis, and skewness, leading to a total of 180 biomarkers to be evaluated. A pairwise t-test was performed to identify the biomarkers that change between baseline and follow-up. For biomarkers with p-value<0.05, errors in individual measurements were estimated from a prior repeatability study in healthy volunteers, and applied to determine whether the changes in individuals are consistent with measurement uncertainty.
Results
As depicted in Figure 1, visual inspection of images as in conventional radiology would not yield substantial information. The changes are subtle and diffuse, more in-depth analysis is required to detect changes between baseline and follow-up visit. Figure 2 shows the relative mean change for each of the 180 biomarkers along with its 95%CI; the cohen-d coefficient that reflects effect size for each biomarker; and the p-value of the pairwise t-test. 46 biomarkers showed a significant change over the 2 years, with mean changes that reach over ½ of a standard deviation and cohen-d effect sizes up to 0.6. Figure 3 displays the top 25 significant biomarkers ranked by the mean change, along with their uncertainty estimates. The figure highlights individual changes that are consistent with real tissue progression.Discussion
The results suggest that DTI picks up microstructural changes over 2 years, a potentially significant finding considering clinical changes in this population of relatively early stage DKD are expected to be small. Tensor shape biomarkers planarity and sphericity accounted for 7 of the 10 most substantial changes, and 5 biomarkers related to MD appear in the top 25. The largest significant change in tractography markers is associated to the deterministic model – heterogeneity of the fibre length distribution. Considering the small sample size and the large number of biomarkers screened, these findings should be treated as hypotheses that are to be validated in the larger population. Data collection for this larger study is underway and more conclusive testing of these hypotheses is expected in the course of 2024.Conclusion
DTI biomarkers show strong changes in early-stage diabetic kidney disease over 2 years, a time frame where clinical biomarkers are typically stable. This indicates that DTI picks up subclinical changes in renal microstructure, a finding that may have significant implications for clinical practice if confirmed in the larger population.Acknowledgements
This project has received funding from the Innovative Medicines Initiative 2 Joint Undertaking under grant agreement No 115974. The JU receives support from the European Union’s Horizon 2020 research and innovation programme and EFPIA and JDRF.
Any dissemination of results reflects only the author's view; the JU is not responsible for any use that may be made of the information it contains.
References
[1] - Heinzel, Andreas, et al. "Validation of plasma biomarker candidates for the prediction of eGFR decline in patients with type 2 diabetes." Diabetes care 41.9 (2018): 1947-1954.
[2] - Caroli, Anna, et al. "Diffusion-weighted magnetic resonance imaging to assess diffuse renal pathology: a systematic review and statement paper." Nephrology Dialysis Transplantation 33.suppl_2 (2018): ii29-ii40.
[3] - Lu, Lan, et al. "Use of diffusion tensor MRI to identify early changes in diabetic nephropathy." American journal of nephrology 34.5 (2011): 476-482.
[4] - Inoue, Tsutomu, et al. "Noninvasive evaluation of kidney hypoxia and fibrosis using magnetic resonance imaging." Journal of the American Society of Nephrology: JASN 22.8 (2011): 1429.
[5] - Hueper, Katja et al. “Diffusion tensor imaging and tractography for assessment of renal allograft dysfunction-initial results.” European radiology vol. 21,11 (2011): 2427-33. doi:10.1007/s00330-011-2189-0
[6] - Delgado, Jorge, et al. "Pilot study on renal magnetic resonance diffusion tensor imaging: are quantitative diffusion tensor imaging values useful in the evaluation of children with ureteropelvic junction obstruction?." Pediatric Radiology 49 (2019): 175-186.
[7] - Berchtold, Lena, et al. "Diffusion-magnetic resonance imaging predicts decline of kidney function in chronic kidney disease and in patients with a kidney allograft." Kidney international 101.4 (2022): 804-813.
[8] - Gooding, Kim M et al. “Prognostic imaging biomarkers for diabetic kidney disease (iBEAt): study protocol.” BMC nephrology vol. 21,1 242. 29 Jun. 2020, doi:10.1186/s12882-020-01901-x
Figures
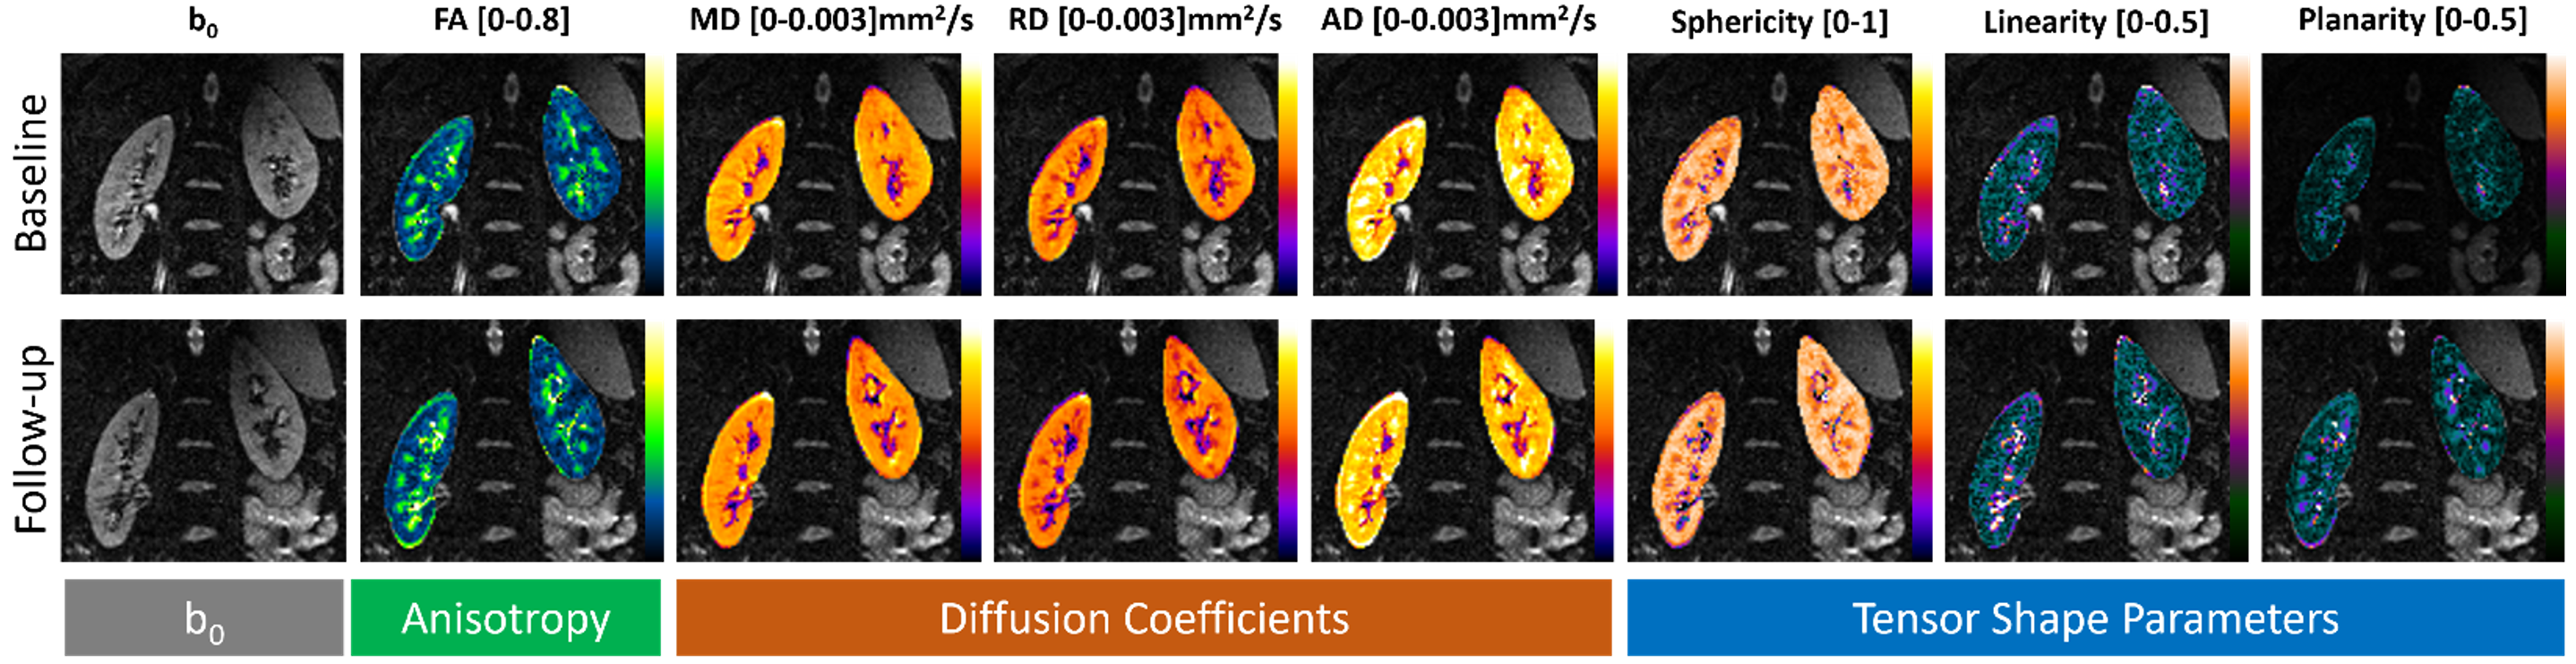
Figure 1: Calculated DTI maps. b0 image was used as the background for all the calculated DTI maps: FA, directionality, MD, AD, RD, sphericity, planarity, and linearity. Top row DTI maps calculated from baseline visit, bottom row DTI maps from follow-up visit.
Visual inspection of images as in conventional radiology would not yield substantial information. The changes are subtle and diffuse, more in-depth analysis is required to detect changes between baseline and follow-up visit