0778
Noninvasive assessment of renal function and pathology of CKD using amide proton transfer weighted imaging and diffusion kurtosis imaging1Department of Radiology, Tongji Hospital, Tongji Medical College, Huazhong University of Science and Technology, Wuhan, China, 2MR Research Collaborations, Siemens Healthineers Ltd., Shanghai, China
Synopsis
Keywords: Kidney, Kidney, Amide Proton Transfer; Diffusion kurtosis imaging; Chronic kidney disease; Renal function; Renal pathology
Motivation: To explore a noninvasive and sensitive method for detecting the renal insufficiency and pathological abnormality of chronic kidney disease (CKD).
Goal(s): To investigate the potential of amide proton transfer-weighted imaging (APTWI) and diffusion kurtosis imaging (DKI) as viable tools for assessing renal function and pathology of CKD.
Approach: To analyze the differences and diagnostic performances of MRI metrics between different renal dysfunction and pathological injury groups.
Results: Both APTWI and DKI can be feasible tools for the noninvasive assessment of renal functional and pathological changes associated with CKD. APT exhibits superior diagnostic efficacy than MD in detecting early renal dysfunction and pathological abnormalities.
Impact: The study suggests that APTWI and DKI provide valuable information regarding the renal function and pathology, which has great significance in guiding risk stratification and longitudinal follow-up of CKD.
Introduction
Early identification and regular monitoring of the renal insufficiency and pathological abnormality of chronic kidney disease (CKD), followed by risk stratification and therapeutic interventions, has the potential to prevent or slow disease deterioration significantly [1].Recently, advanced functional magnetic resonance imaging (fMRI) technologies exhibit the capability of quantifying renal pathophysiological processes [2]. As a special diffusion-weighted imaging (DWI) model that describes the non-Gaussian diffusion behavior of water molecules [3], diffusion kurtosis imaging (DKI) can more accurately reflect the microstructural complexity and heterogeneity in vivo tissues [4, 5]. Amide proton transfer weighted imaging (APTWI) can obtain metabolic information by detecting the content of mobile proteins and peptides in tissues. It’s an extensively used subtype of chemical exchange saturation transfer (CEST) imaging technique based on the exchange between the saturated amide protons of proteins or peptides and the hydrogen protons of bulk water [6]. At present, there are few systematic studies of APTWI in detecting renal pathological injury and the differential or combined value with DKI is not yet to be explored.
The purpose of this study is to explore the capability of APTWI and DKI in assessing the renal functional and pathological alterations in patients with CKD and to provide new insights for guiding treatment decision-making and longitudinal follow-up.
Methods
A total of 45 CKD patients and 15 healthy volunteers were enrolled in this study, and all of them underwent magnetic resonance imaging (MRI) examination, including DKI with a reduced field of view and APTWI on a 3T MAGNETOM Skyra (Siemens Healthcare, Erlangen, Germany). Five b-values (0, 500, 1000, 1500, and 2000s/mm2) in 4-directional diffusion-weighting gradient were used. A single-layer frequency-stabilized CEST sequence using turbo-spin-echo (TSE) readout was used to obtain coronal APTWI images. Based on the estimated glomerular filtration rate (eGFR), all patients were separated into stable (eGFR ≥ 60ml/min/1.73m2) and impaired (eGFR < 60 ml/min/1.73m2) renal function groups. Besides, all patients underwent renal biopsy and they were divided into mild (≤ 9 scores) and moderate-severe (≥ 10 scores) renal injury groups according to the total pathological score. The renal parenchymal mean diffusivity (MD), mean kurtosis (MK), and APT values were compared among different groups. The correlations of all parameters with the eGFR and total pathological score were analyzed. The diagnostic performances of all parameters in distinguishing different degrees of renal dysfunction and pathological injury were evaluated.Results
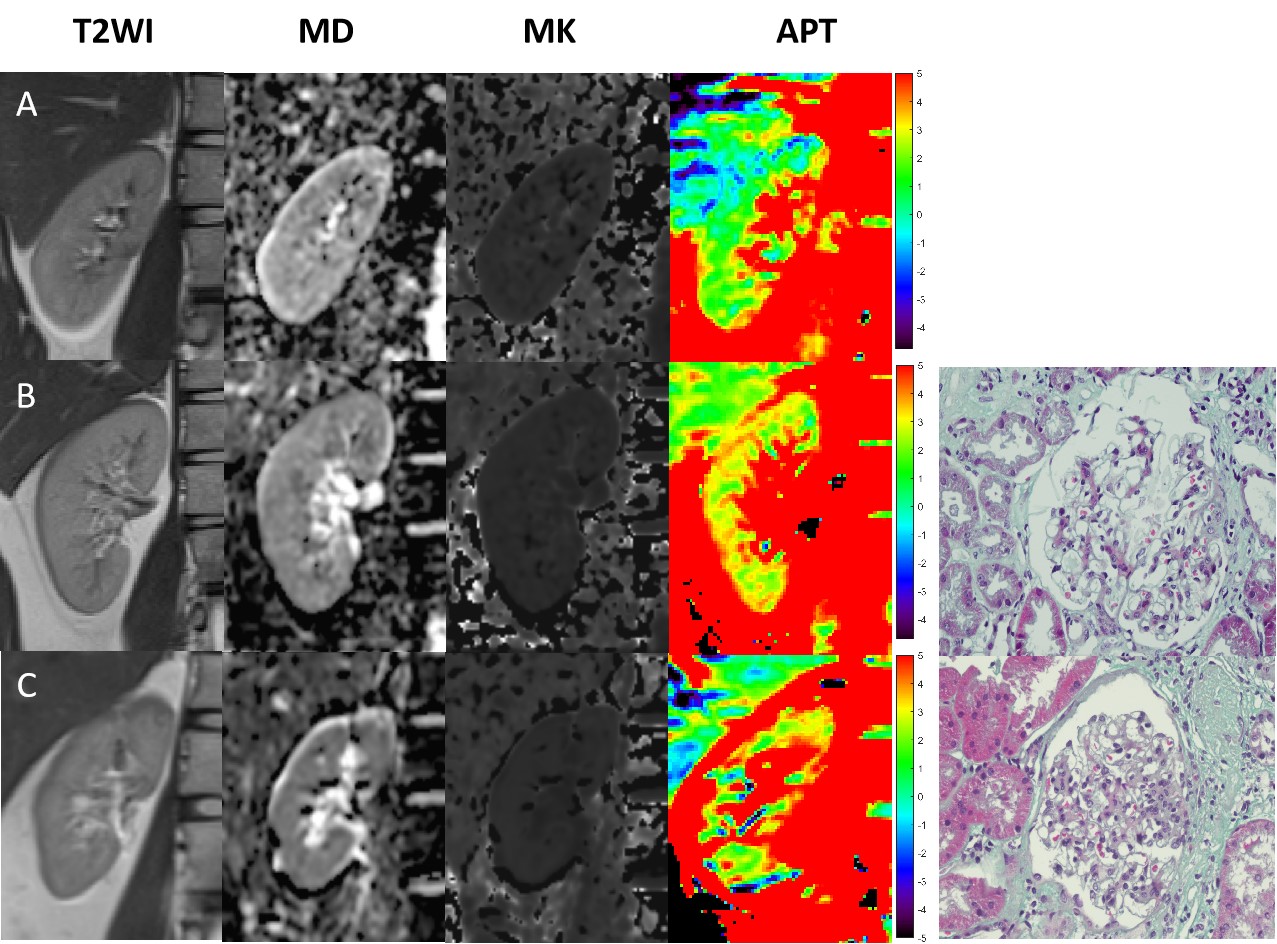
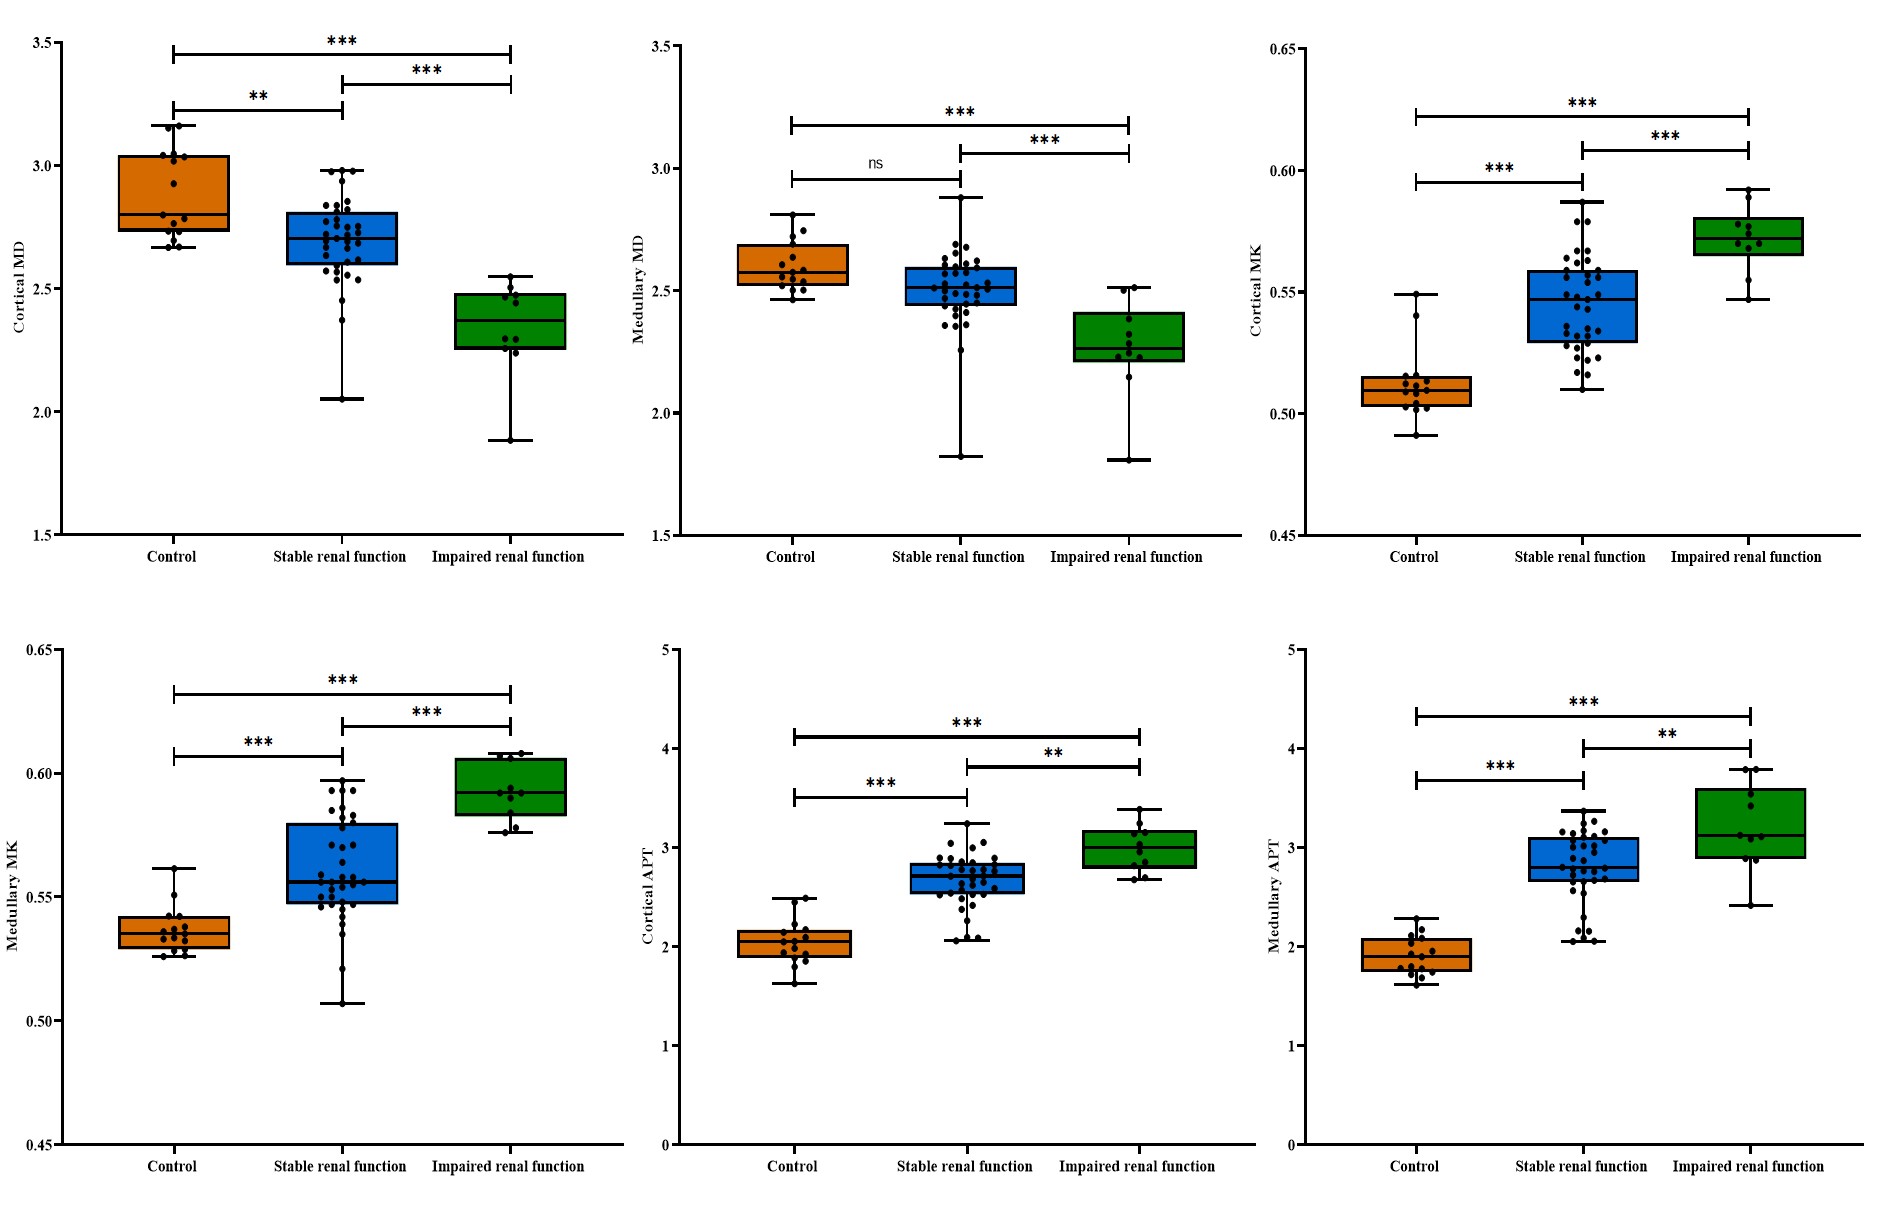
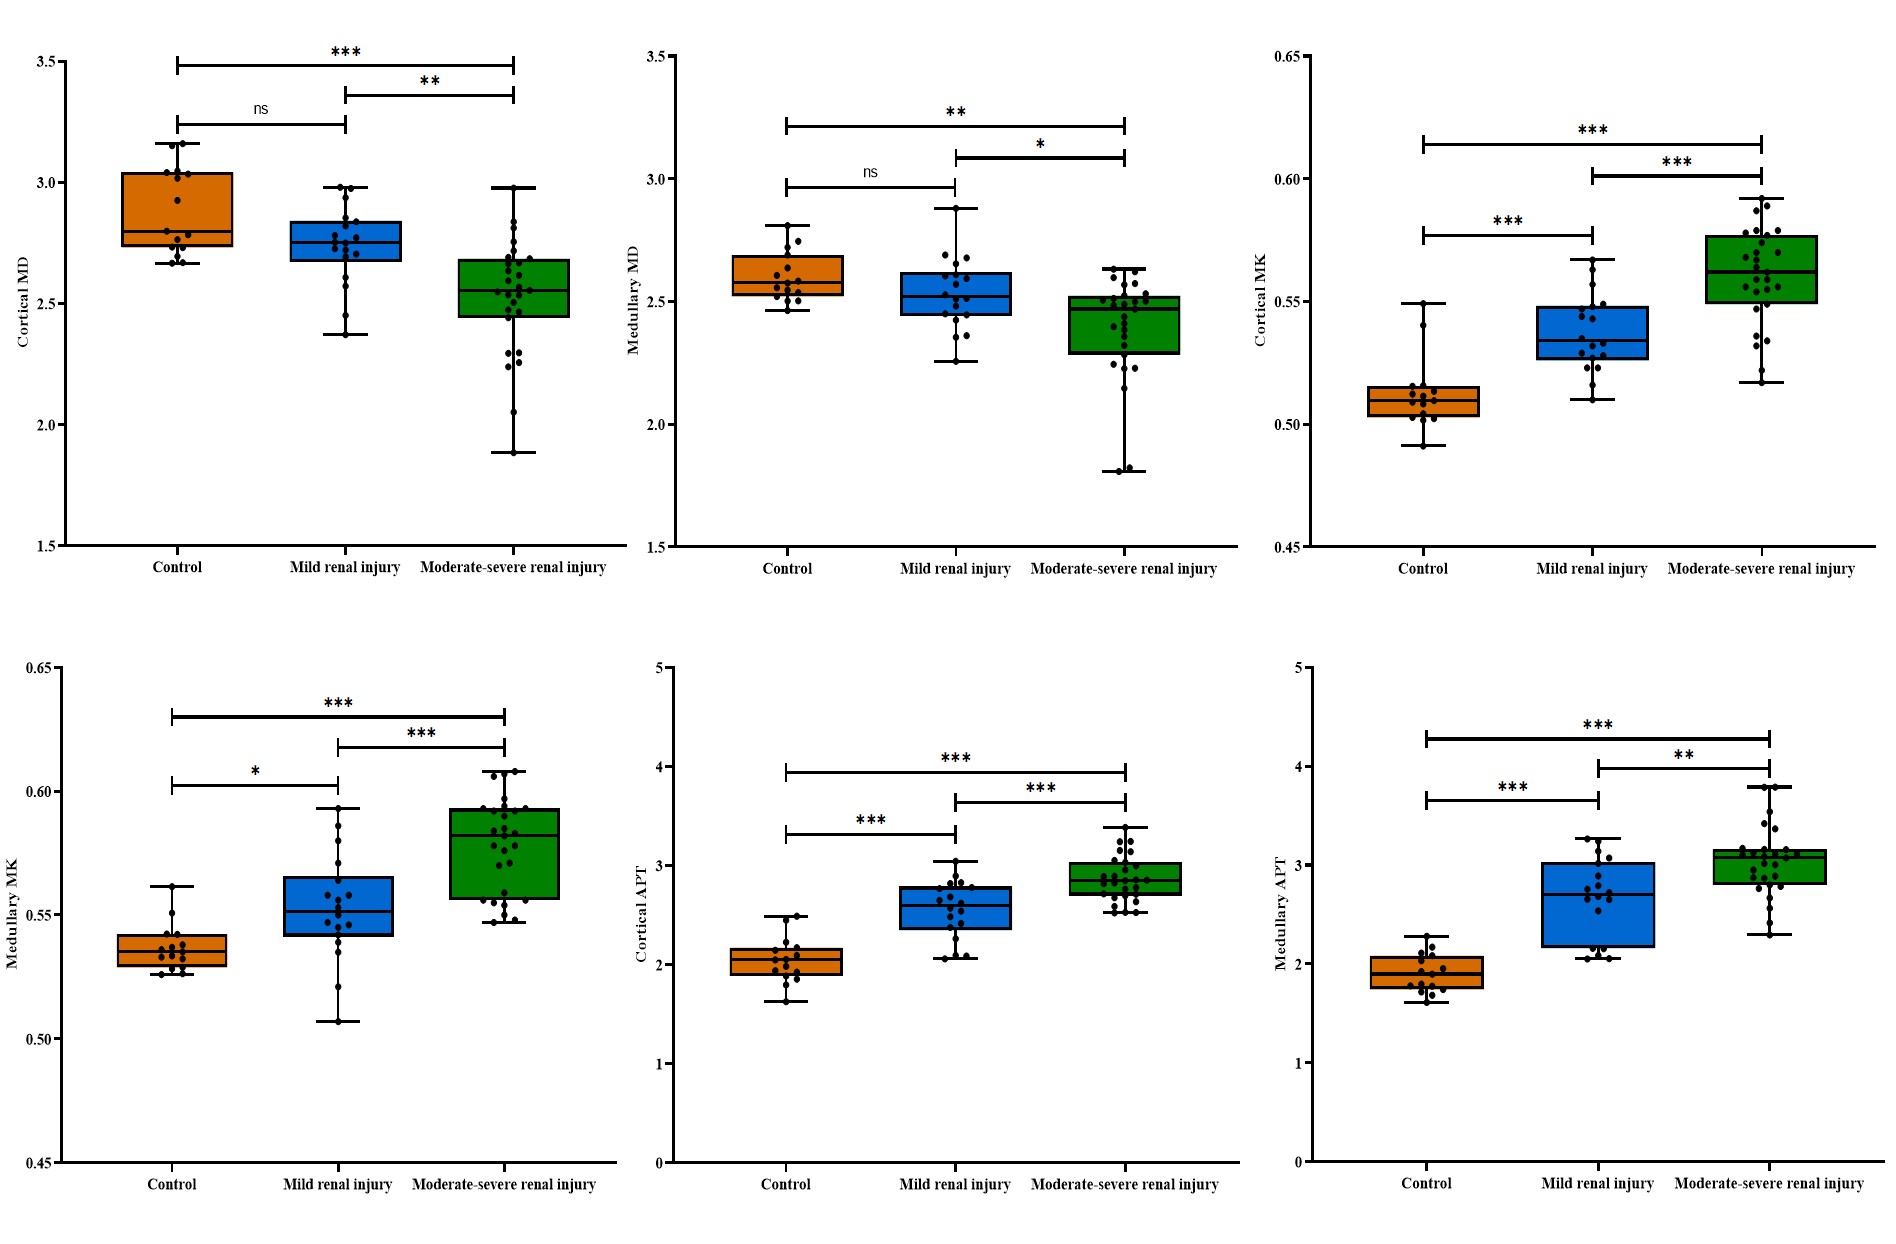
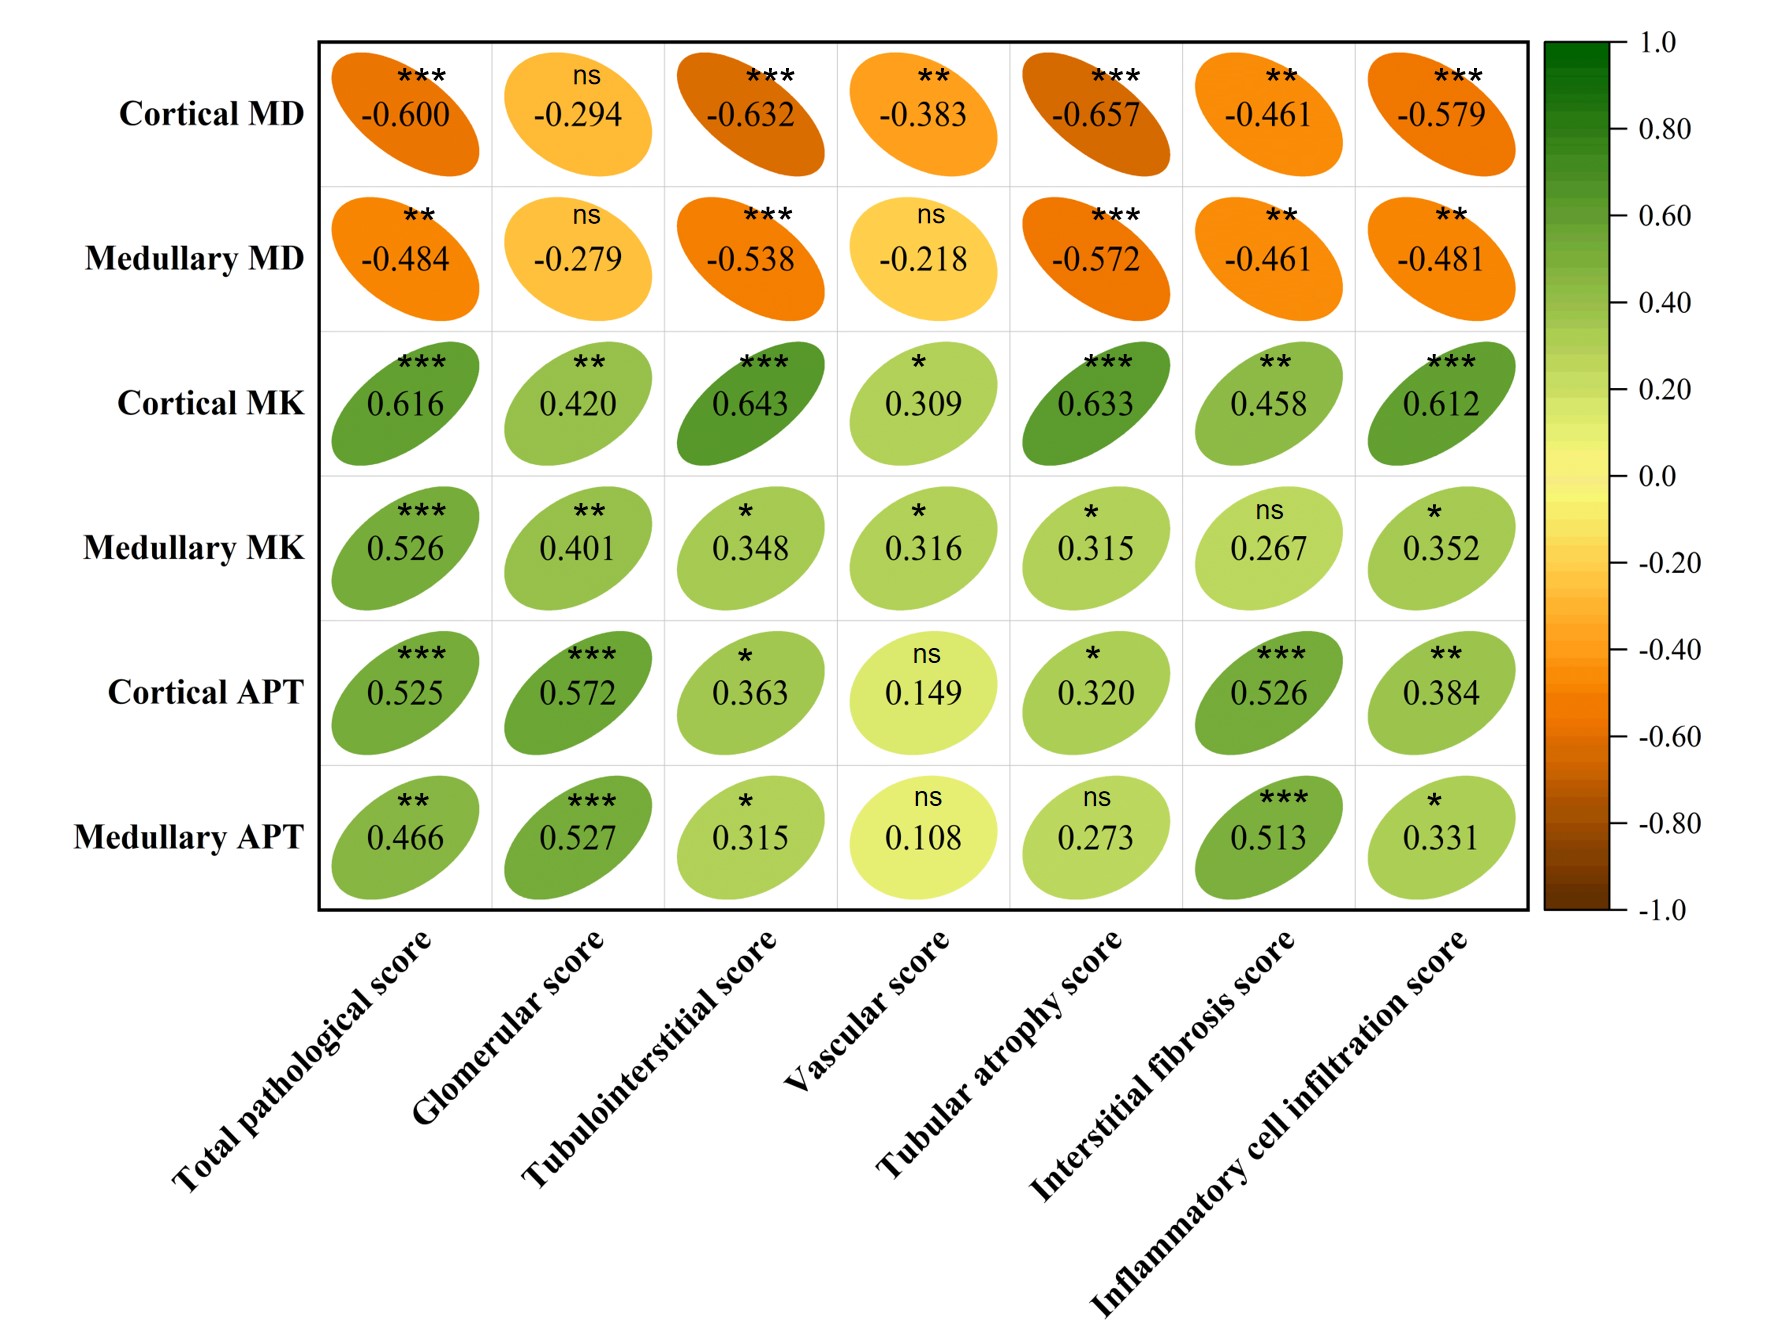
The T2-weighted imaging and representative parameter maps were depicted in Fig. 1. Significant differences were found in renal parenchymal MD, MK, and APT among the control, stable, and impaired renal function groups, as well as among the control, mild, and moderate-severe renal injury groups (all P < 0.01) (Fig.2 and 3). The correlation between renal parenchymal MD, MK, and APT with various pathological scores were exhibited in Fig. 4. The cortical APT presented the strongest correlation with the interstitial fibrosis score (r = 0.526, P < 0.001). The medullary APT had the largest area under the curve (AUC) in differentiating the control from stable renal function group (AUC = 0.971) and in differentiating the control from mild renal injury group (AUC = 0.944), outperforming the MD (function: medullary APT vs cortical MD: P = 0.005; medullary APT vs medullary MD: P = 0.001; pathology: medullary APT vs cortical MD: P = 0.012; medullary APT vs medullary MD: P = 0.005). The cortical MK achieved the largest AUC in distinguishing the mild from moderate-severe renal injury group (AUC = 0.819) and combining the cortical APT with cortical MK showed better performance (AUC = 0.862), but it’s not statistically significant ( P = 0.290).Discussion/Conclusion
Both APTWI and DKI have potential as feasible tools for the quantitative and noninvasive assessment of renal functional and pathological changes associated with CKD. APT outperformed MD in detecting early renal dysfunction and pathological abnormalities. A combination of cortical APT and cortical MK may exert a better effect in distinguishing different degrees of renal injury, which could to some extent assist clinical physicians in risk stratification and longitudinal follow-up. Besides, APT value may serve as a promising imaging biomarker for evaluating renal interstitial fibrosis.Acknowledgements
No acknowledgement found.References
1. Shlipak MG, Tummalapalli SL, Boulware LE, Grams ME, Ix JH, Jha V, et al. The case for early identification and intervention of chronic kidney disease: conclusions from a Kidney Disease: Improving Global Outcomes (KDIGO) Controversies Conference. Kidney Int. 2021;99(1):34-47.
2. Zhang J, Zhang LJ. Functional MRI as a Tool for Evaluating Interstitial Fibrosis and Prognosis in Kidney Disease. Kidney Dis (Basel). 2020;6(1):7-12.
3. Rosenkrantz AB, Padhani AR, Chenevert TL, Koh DM, De Keyzer F, Taouli B, et al. Body diffusion kurtosis imaging: Basic principles, applications, and considerations for clinical practice. Journal of magnetic resonance imaging : JMRI. 2015;42(5):1190-202.
4. Li A, Yuan G, Hu Y, Shen Y, Hu X, Hu D, et al. Renal functional and interstitial fibrotic assessment with non-Gaussian diffusion kurtosis imaging. Insights Imaging. 2022;13(1):70.
5. Zheng X, Li M, Wang P, Li X, Zhang Q, Zeng S, et al. Assessment of chronic allograft injury in renal transplantation using diffusional kurtosis imaging. BMC Med Imaging. 2021;21(1):63.
6. Zhou J, Payen JF, Wilson DA, Traystman RJ, van Zijl PC. Using the amide proton signals of intracellular proteins and peptides to detect pH effects in MRI. Nat Med. 2003;9(8):1085-90.
Figures