0777
Native T1-mapping as a Predictor of Progressive Renal Function Decline in Chronic Kidney Disease Patients1Affiliated Hospital of Nantong University, Nantong, China, 2Nantong University Medical School, Nantong, China, 3GE Healthcare, Beijing, China
Synopsis
Keywords: Kidney, Kidney
Motivation: Chronic kidney disease (CKD) is recognized as a global public health problem. Thus, there is a pressing need for a non-invasive method to predicting the evolution of CKD.
Goal(s): This study aimed to investigate the potential of Native T1-mapping in predicting the prognosis of patients with CKD.
Approach: In our study of 119 CKD patients, there was a statistically significant difference in prognosis between the high and low T1 groups in terms of the occurrence of kidney endpoint events.
Results: Native T1-mapping has the potential to significantly improve the identification of CKD patients with a higher risk of progressing to end-stage renal disease.
Impact: CKD is increasingly recognized as a global public health problem. Traditional examination methods, such as renal biopsy, have many limitations. Therefore, we need to find a non-invasive, alternative method to evaluate the prognosis of CKD.
Introduction
Kidney fibrosis, characterized by excessive deposition of extracellular matrix, is a key driver of chronic kidney disease (CKD) progression1. Currently, the histopathological evaluation of renal tissue obtained through percutaneous renal biopsy is the gold standard for assessing the degree of renal fibrosis. However, it is invasive, difficult to repeat, and has limitations in tissue sampling2. T1 mapping, as a quantitative MRI technique, can reflect the degree of tissue fibrosis and may be an alternative approach. In a prior study, we discovered that Native T1 mapping might offer strong diagnostic capabilities in assessing renal function and in the non-invasive detection of chronic glomerulonephritis fibrosis3. Therefore, the primary objective of this research was to determine if the renal T1 value could predict a progressive decline in renal function among CKD patients.Methods
SubjectsWe enrolled 119 CKD patients as the study subjects and included 20 healthy volunteers (HVs) as the control group, with follow-ups extending until October 2022. The definition and staging criteria for CKD follow the K/DOQI guidelines4. Participants were excluded based on the following criteria: 1) Contraindications for MRI examination, such as the presence of metal objects in the body or an inability to cooperate with the examination; 2) Detection of renal abnormalities during the MRI examination, including large renal cysts, solitary kidneys, hydronephrosis, tumors, or other renal anomalies; 3) Poor image quality. Out of these patients, 63 underwent kidney biopsy measurements. Both clinical information and biopsy pathological scores were collected.
MRI experiment
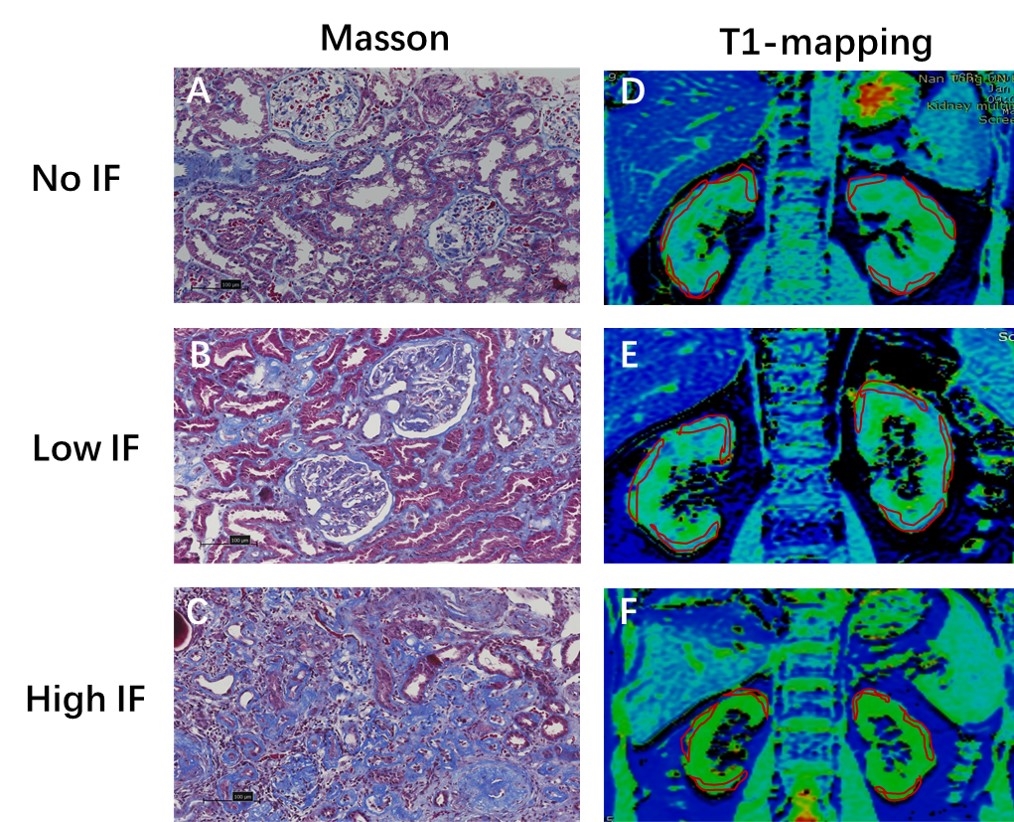
SMART T1 examinations were performed within one week before the kidney biopsy. The scan parameters applied were: slice thickness = 5 mm, spacing = 1 mm, the number of slices = 8, field of view = 32*32cm^2, matrix = 192×128, number of excitations (NEX) = 1, and acceleration factor = 2. Respiration triggering was also adopted, with a scan time of 2 minutes. Data analysis Using vendor-provided post-processing software on the GE workstation, the coronal renal T1 maps were automatically generated. On the resultant T1 maps, a senior radiologist manually drew three regions of interest (ROIs) on the upper, middle, and lower parts of the renal cortex (Fig.1).
Statistical analysis
Data were analyzed using SPSS 25.0 software. The Spearman correlation coefficient evaluated the relationship between T1 values and pathological scores. Kaplan-Meier survival curves analyzed the probability of no kidney endpoint events occurring between the high and low T1 groups over time. Binary logistic regression explored the association between T1 mapping, clinical indices, and the occurrence of kidney endpoint events. Receiver operating characteristic (ROC) curves evaluated the accuracy of different variables in predicting renal endpoint events. A p-value <0.05 was deemed statistically significant in all analyses.
Results
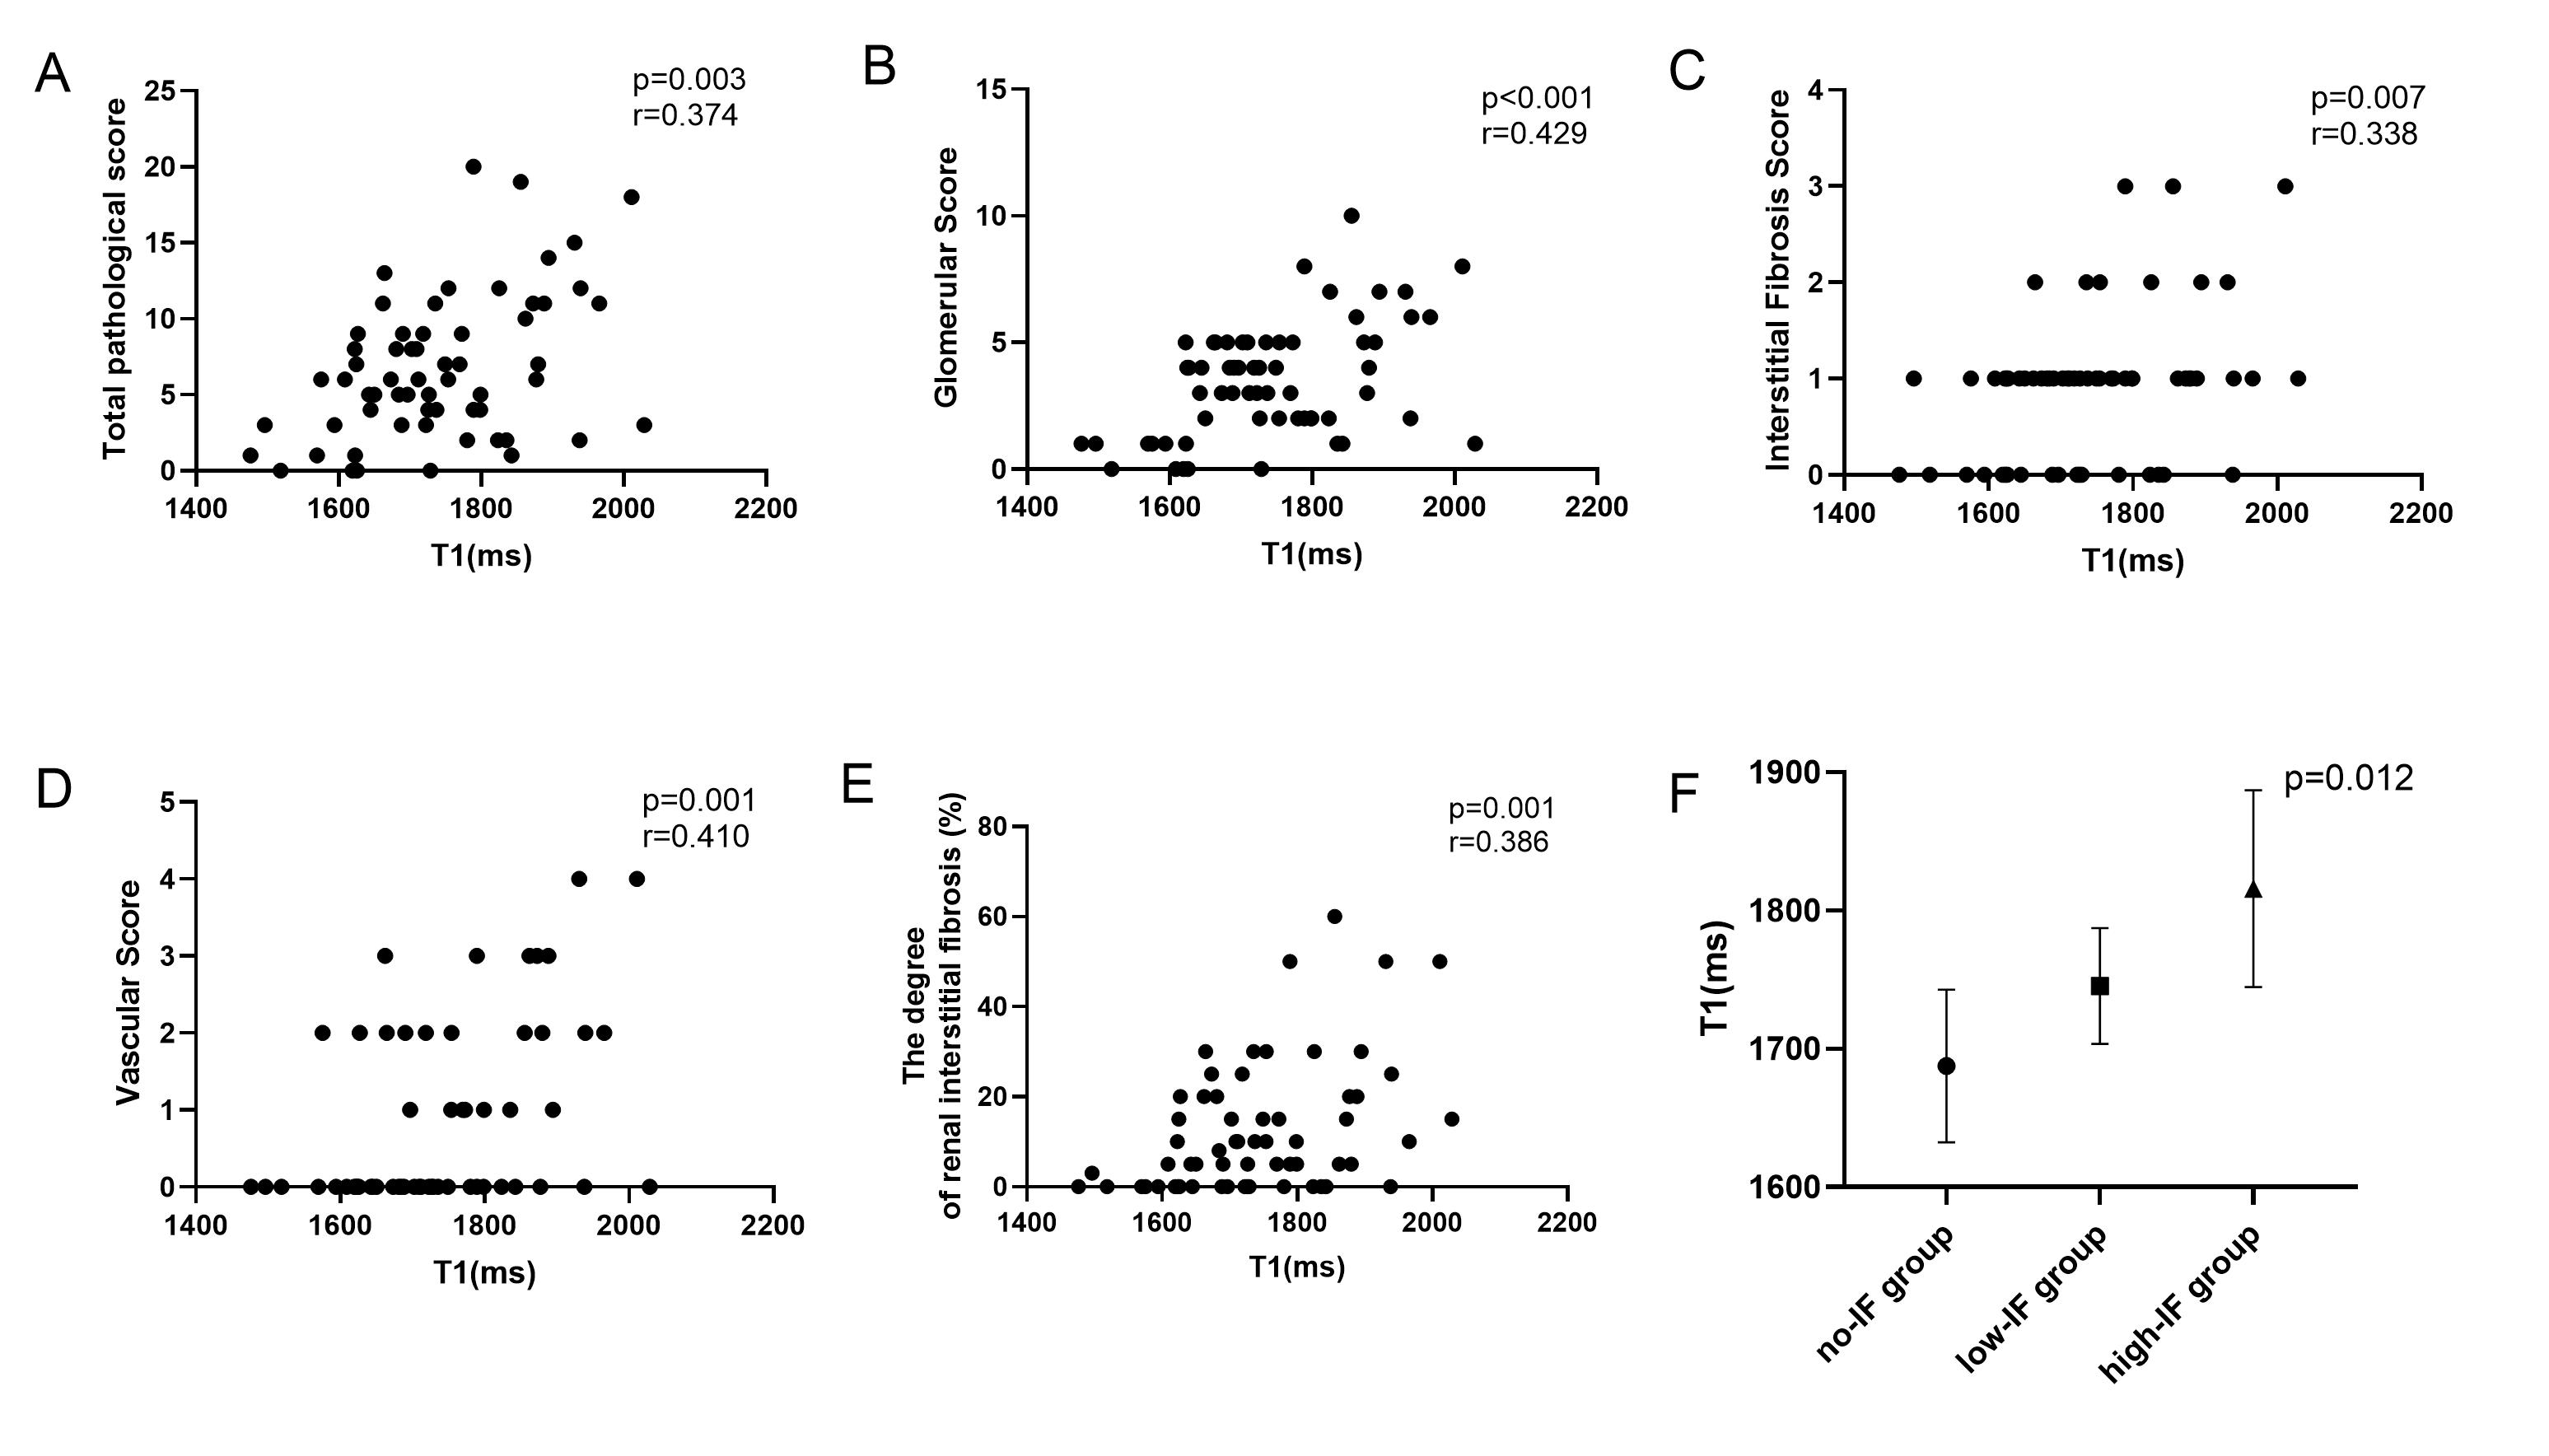
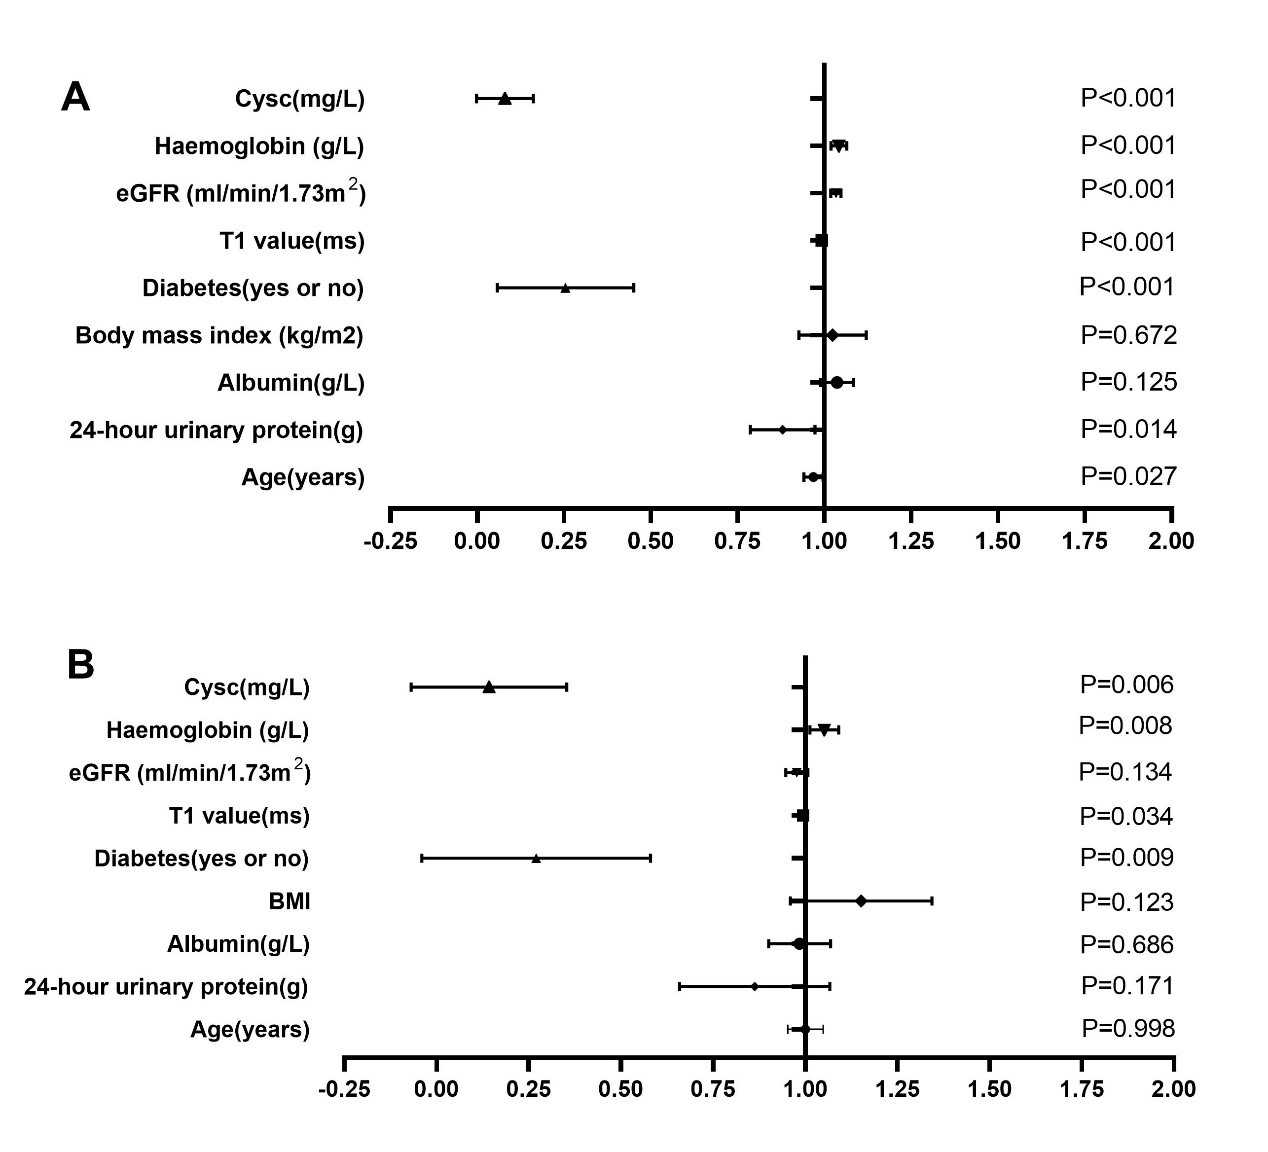
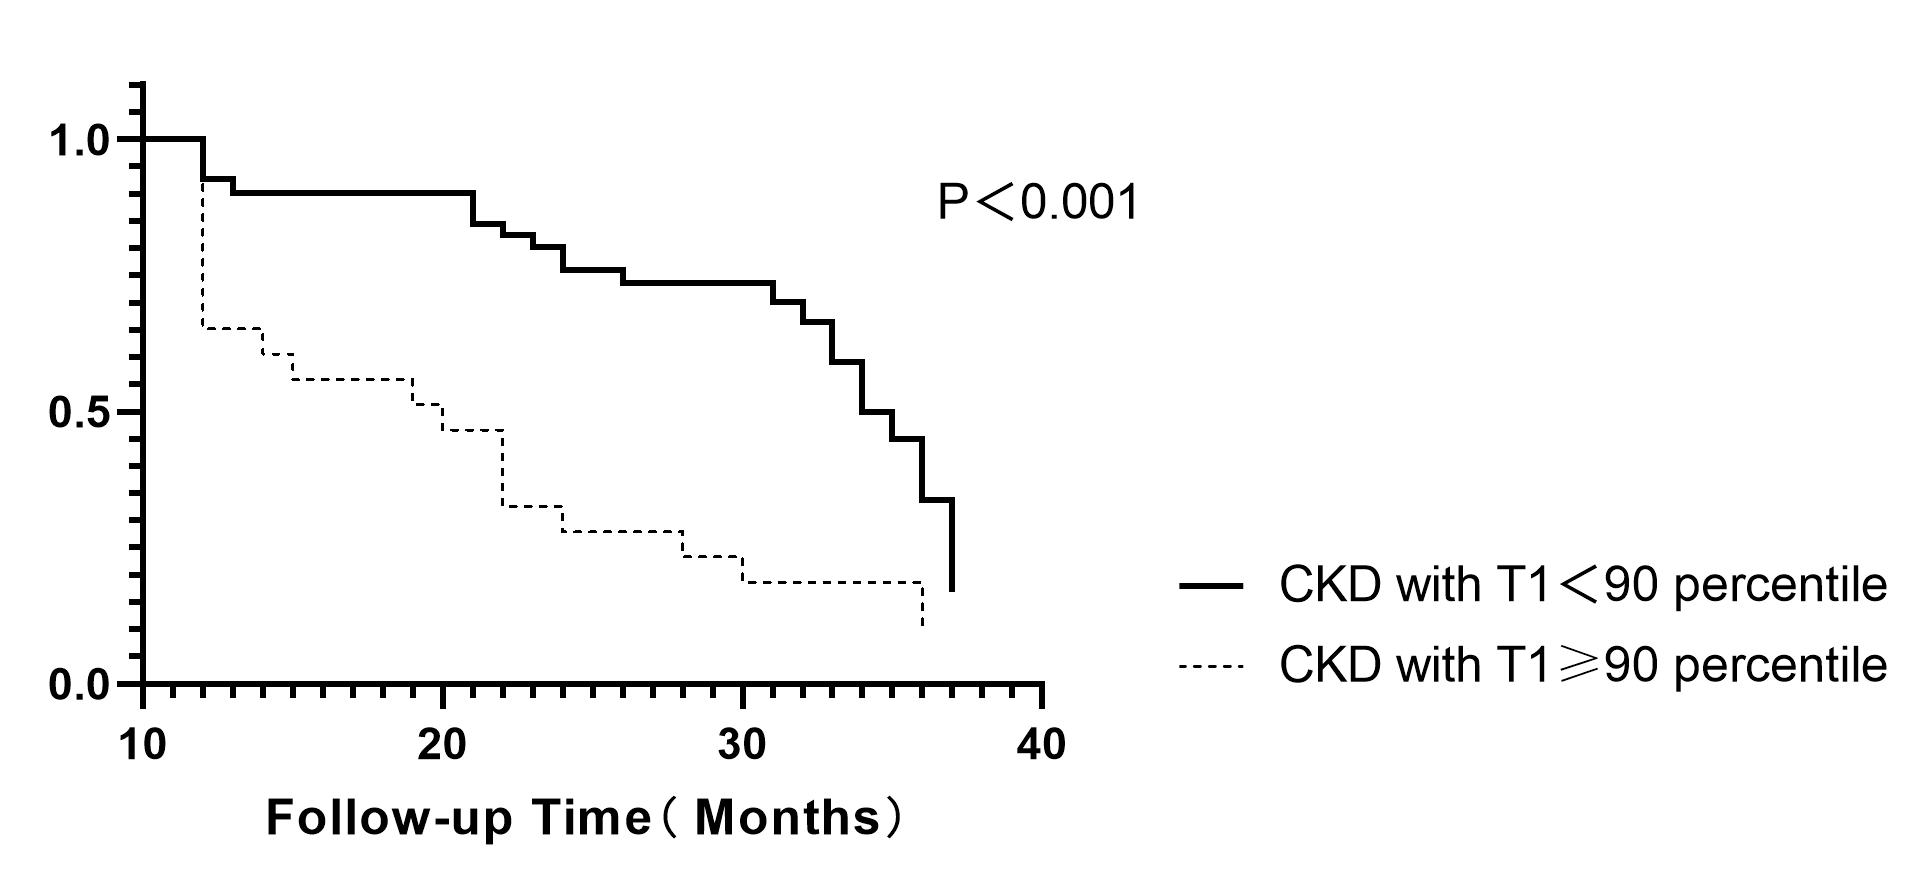
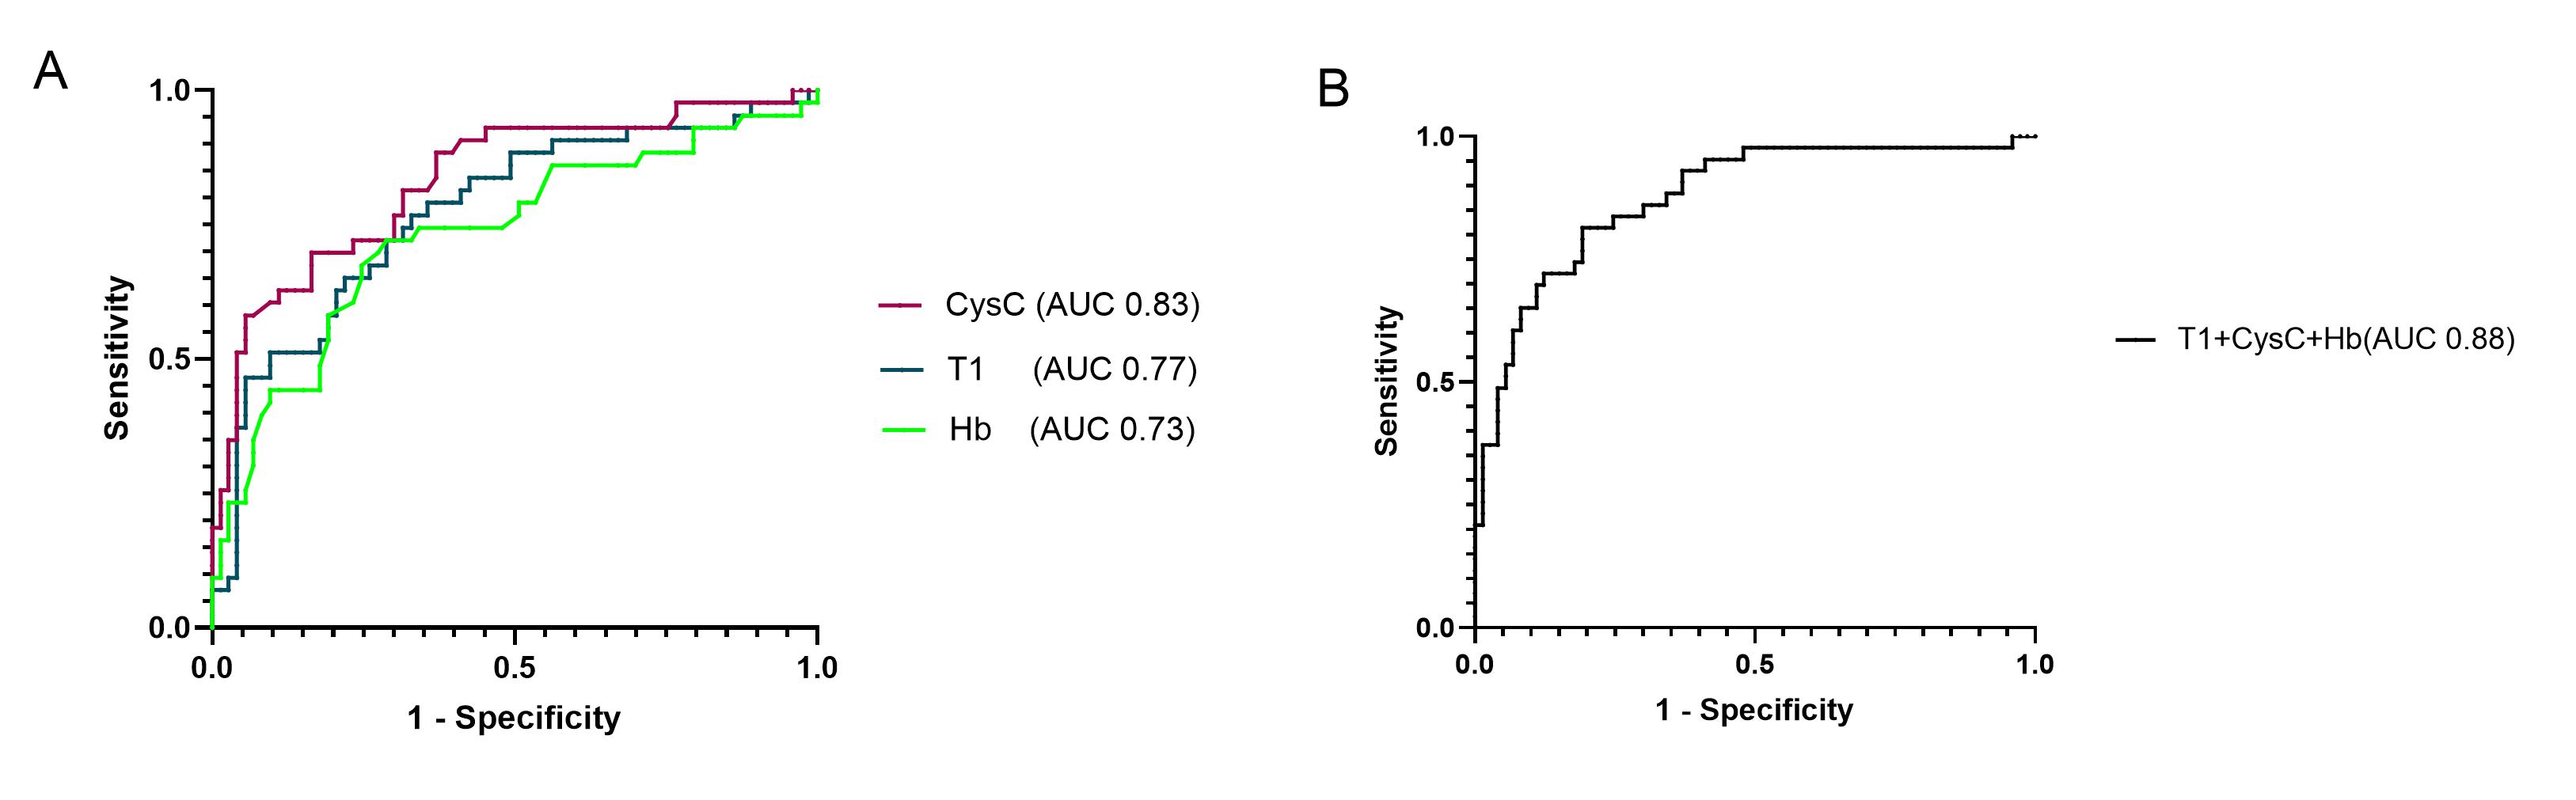
T1 values exhibited positive correlations with total pathological scores, glomerular scores, renal fibrosis scores, vascular scores, and renal fibrosis percentages (all p<0.05). T1 values across varying fibrosis degree groups showed statistical significance (F=4.772, P<0.05) (Fig.2). Binary logistic regression analysis was conducted with the occurrence of endpoint events as the dependent variable. Univariate analysis revealed associations between endpoint events and factors such as age, diabetes, baseline eGFR, 24-hour urine protein, T1 value, CysC, Hb, and hypertension (P<0.05). A fully adjusted multivariate analysis indicated associations between endpoint events and diabetes, CysC, Hb, and T1 value (P<0.05) (Fig.3). Kaplan-Meier survival analysis revealed a significantly higher likelihood of kidney endpoint events in the high T1 group compared to the low T1 value group (P<0.001) (Fig.4). The ROC curves for variables (Cysc, T1, Hb) tied to kidney endpoint events demonstrated AUCs of 0.83 (95%CI: 0.75-0.91) for Cysc, 0.77 (95%CI: 0.68-0.86) for T1, and 0.73 (95%CI: 0.63-0.83) for Hb. Combining these variables elevated the AUC to 0.88 (95%CI: 0.81-0.94) (Fig.5).Discussion and conclusions
Our study results suggest a robust correlation between T1 values and various pathological scores, as well as the occurrence of adverse renal events. Elevated cortical T1 values in CKD patients correlate with a poorer prognosis and an increased likelihood of adverse renal events. This indicates that native T1 mapping might serve as a non-invasive biomarker for evaluating fibrosis and predicting prognosis in CKD patients.Acknowledgements
No acknowledgement found.References
1.Klinkhammer BM, Goldschmeding R, Floege J, Boor P. Treatment of Renal Fibrosis-Turning Challenges into Opportunities. Adv Chronic Kidney Dis. 2017 Mar;24(2):117-29.
2.Luciano RL, Moeckel GW. Update on the Native Kidney Biopsy: Core Curriculum 2019. Am J Kidney Dis. 2019 Mar;73(3):404-415.
3.Wu J, Shi Z, Zhang Y, Yan J, Shang F, Wang Y, et al. Native T1 Mapping in Assessing Kidney Fibrosis for Patients With Chronic Glomerulonephritis. Front Med (Lausanne). 2021;8:772326.
4. Stevens PE, Levin A, Kidney Disease: Improving Global Outcomes Chronic Kidney Disease Guideline Development Work Group M: Evaluation and management of chronic kidney disease: synopsis of the kidney disease: improving global outcomes 2012 clinical practice guideline. Ann Intern Med 2013, 158(11):825-830.
Figures