0776
Simultaneous Multiparametric Quantitative MRI for Abdominal Imaging in a Single Breath-hold with MRF-EPTI1Radiology and Biomedical Imaging, University of California, San Francisco, San Francisco, CA, United States
Synopsis
Keywords: Kidney, New Trajectories & Spatial Encoding Methods, Abdomen
Motivation: Multiparametric mapping is essential in the assessment of renal physiology and
physiopathology, while the conventional quantitative MR methods requires long acquisition
time and multiple breath-hold periods.
Goal(s): To develop an efficient simultaneous multiparametric quantification method for abdomen imaging.
Approach: MRF-EPTI technique was applied for quantitative abdomen imaging. The repeatability was evaluated by in-vivo scans on two healthy volunteers. Motion sensitivity was evaluated with/without breath-hold.
Results: Simultaneous multiparametric quantification of T1, T2, T2*, proton density and quantitative susceptibility mapping including susceptibility source separation for abdominal imaging was achieved in a single breath-hold time (16s).
Impact: We acquired simultaneous multiparametric quantification of T1, T2, T2*, proton density and quantitative susceptibility mapping including susceptibility source separation, and generated high-quality multi-contrast synthetic images for abdominal imaging in a single breath-hold with MRF-EPTI technique.
Introduction
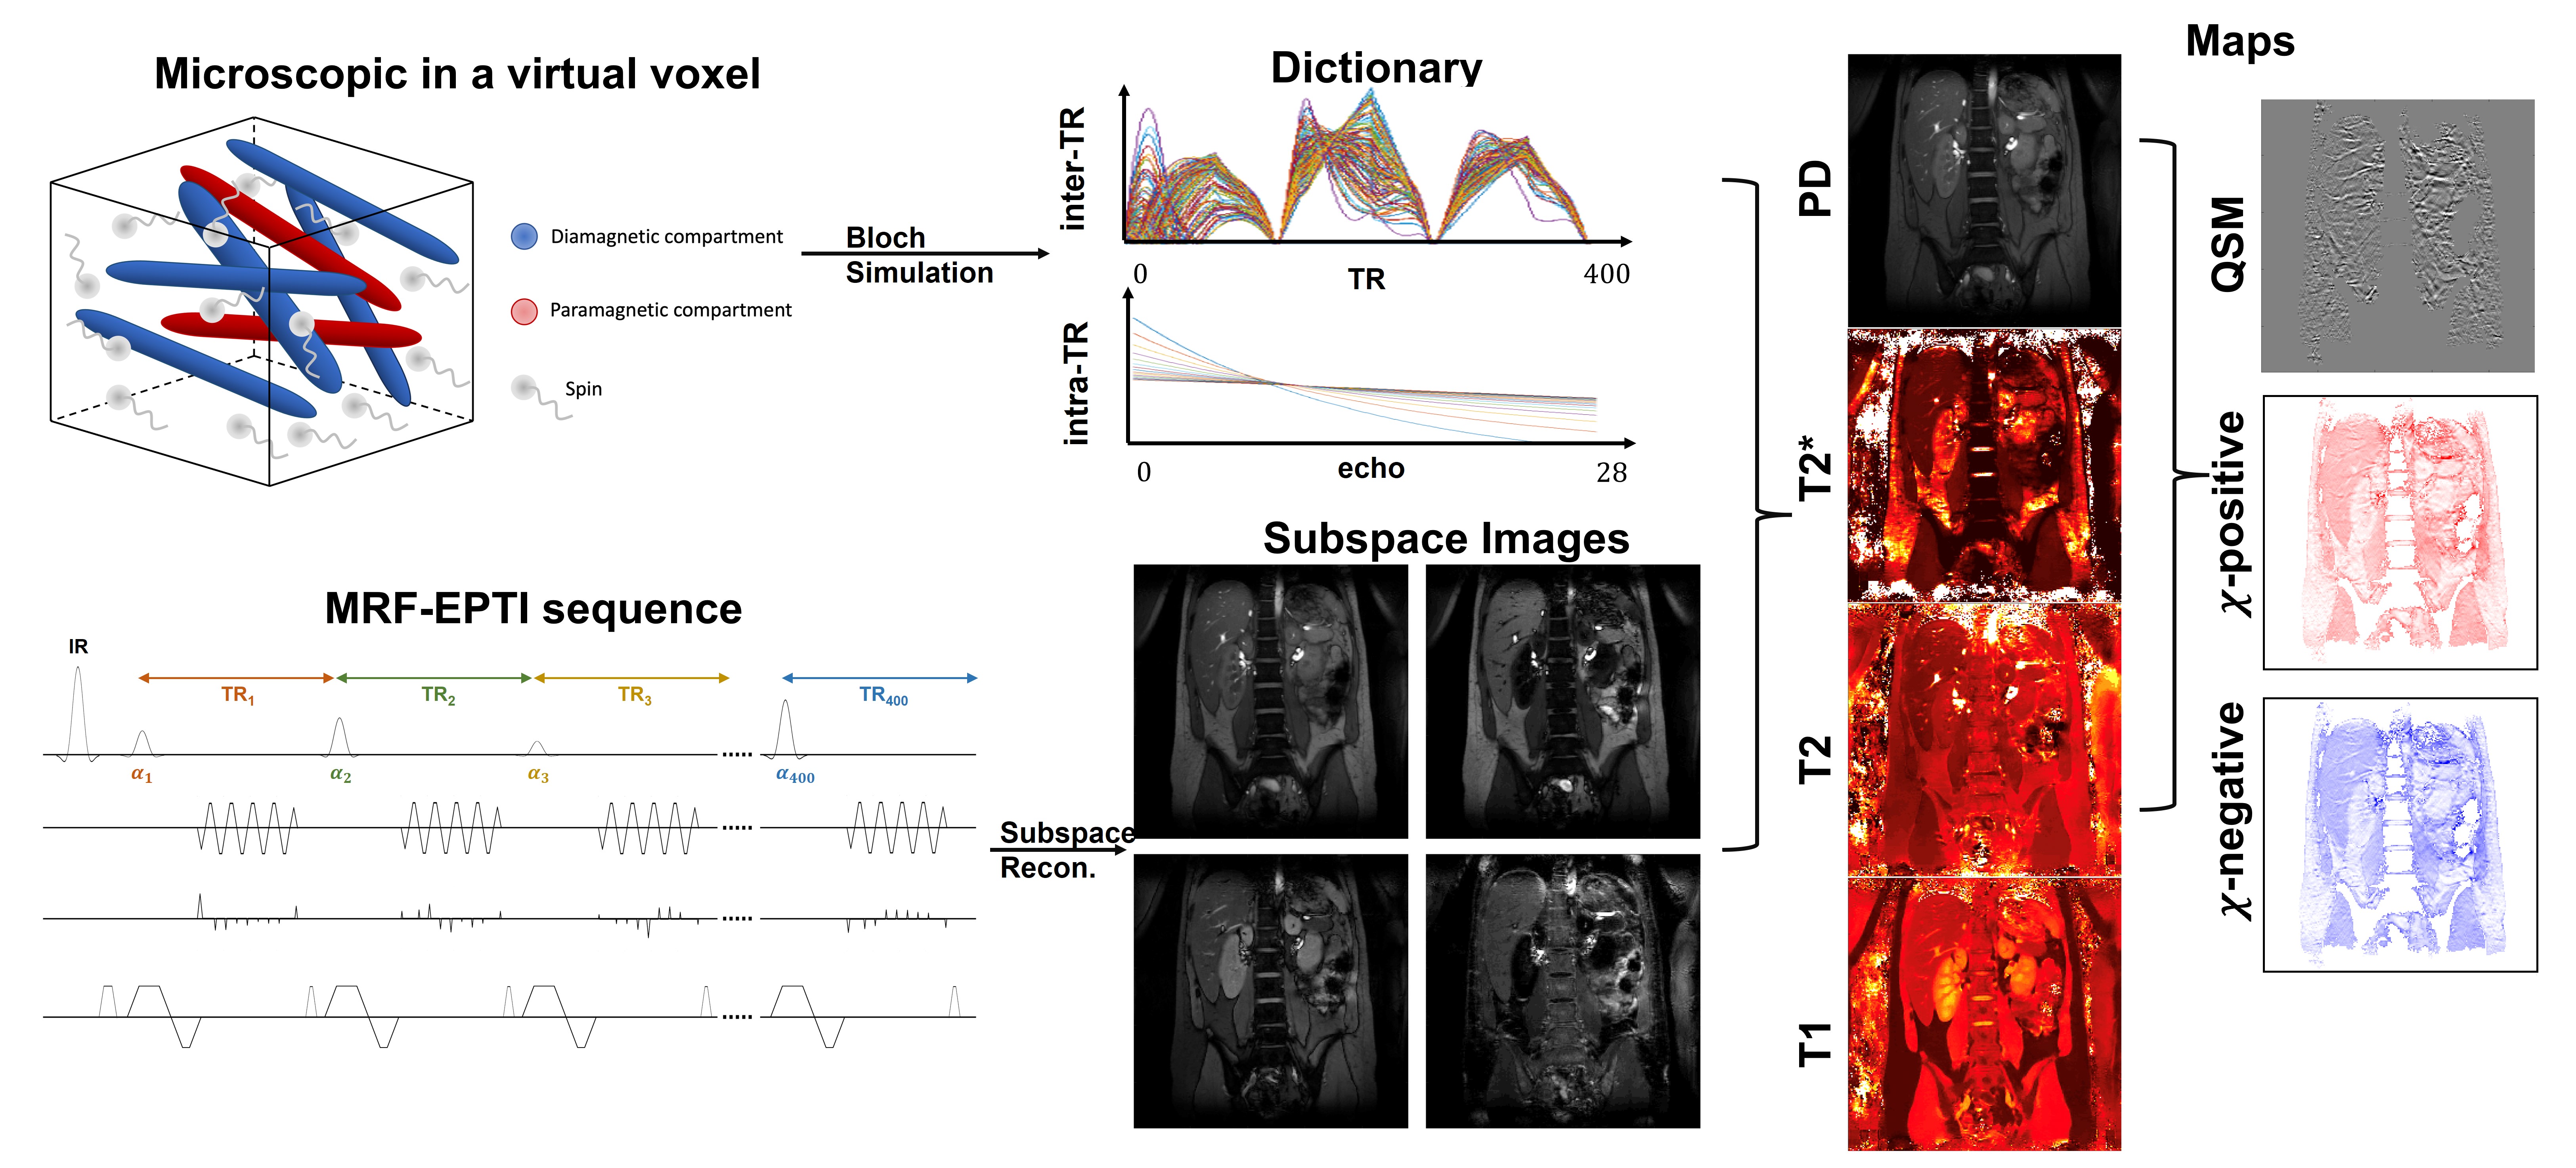
Multiparametric quantitative MRI is potentially an important tool allowing non-invasive assessment of abdominal physiology and physiopathology. Several studies have shown that fibrosis can be characterized by T1 mapping and inflammation can be characterized by both T1 and T2 mapping1. In addition, the oxygenation can be assessed by T2* mapping and quantitative susceptibility mapping (QSM)2. However, the conventional multiparametric mapping protocols, often requiring multiple breath-hold acquisitions, are challenged by the long acquisition time and respiratory motion. Furtherly, there is no explicit model for non-rigid motion in abdominal imaging, so the accuracy is limited by the registration among multiple breath-holds in a single quantitative acquisition and the co-registration among different quantitative maps. Therefore, in this study, we applied the magnetic resonance fingerprinting-echo planar time-resolved imaging (MRF-EPTI) technique3–5 for abdominal imaging to simultaneously quantify T1, T2, T2* and QSM maps in a single breath-hold and provide synthetic weighted images.Methods
To decompose T2 and T2* quantification, the MRF-EPTI pulse sequence is based on an inversion recovery unbalanced steady state free precession (SSFP) sequence with Poisson sampling EPI readout, as shown in the sequence diagram in Figure 1. Due to the nature that intra-TR T2* decay is independent to inter-TR T1 and T2 weighted signal evolution, acquired temporal signal can be represented by these two parts, enabling the simultaneous quantification of T2 and T2*. Time-resolved subspace reconstruction was performed according to the signal representation. In multi-parametric quantification5, inter-TR signals were used to map T1, T2 and proton density (PD), and intra-TR signals were used to map T2*. The STAR-QSM method6 was performed to estimate the QSM and APART-QSM method7 was performed for susceptibility source separation resulting in positive and negative susceptibility maps.All the scans were performed on a GE 3T scanner (MR750, Waukesha, WI) with a 32-channel Torso coil. Other parameters included: TR = 40ms, coronal FOV = 400x400 mm2, resolution = 1.67x1.67x5mm3, echo train length (ETL) = 28, and echo spacing = 0.8ms. The scan time is 16s/slice, achieving the multiparametric quantitative scan within a breath-hold.
Results
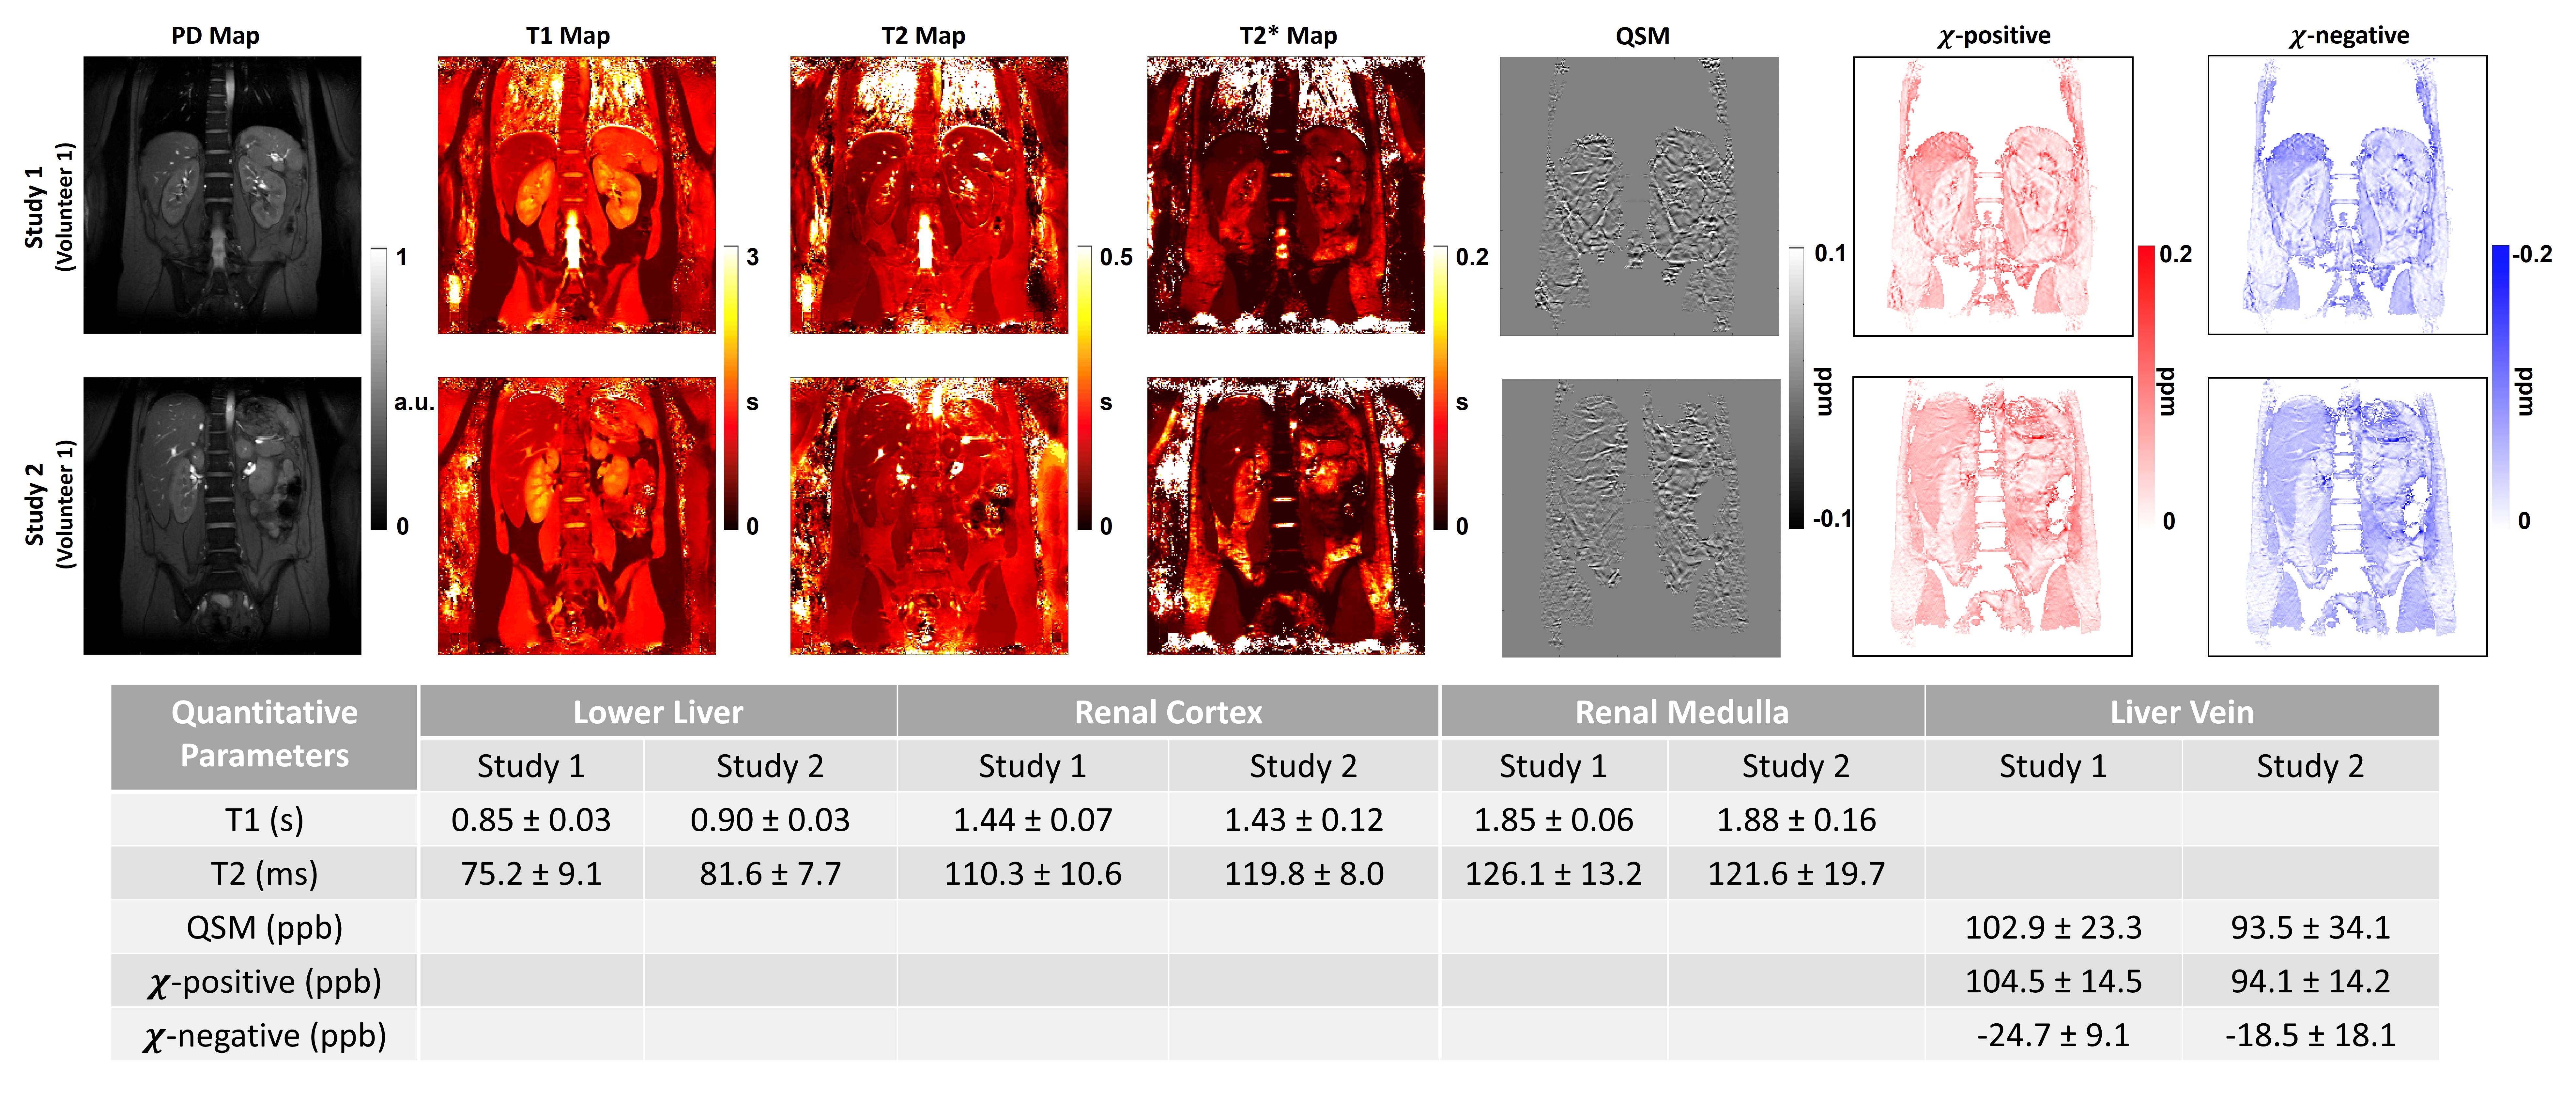
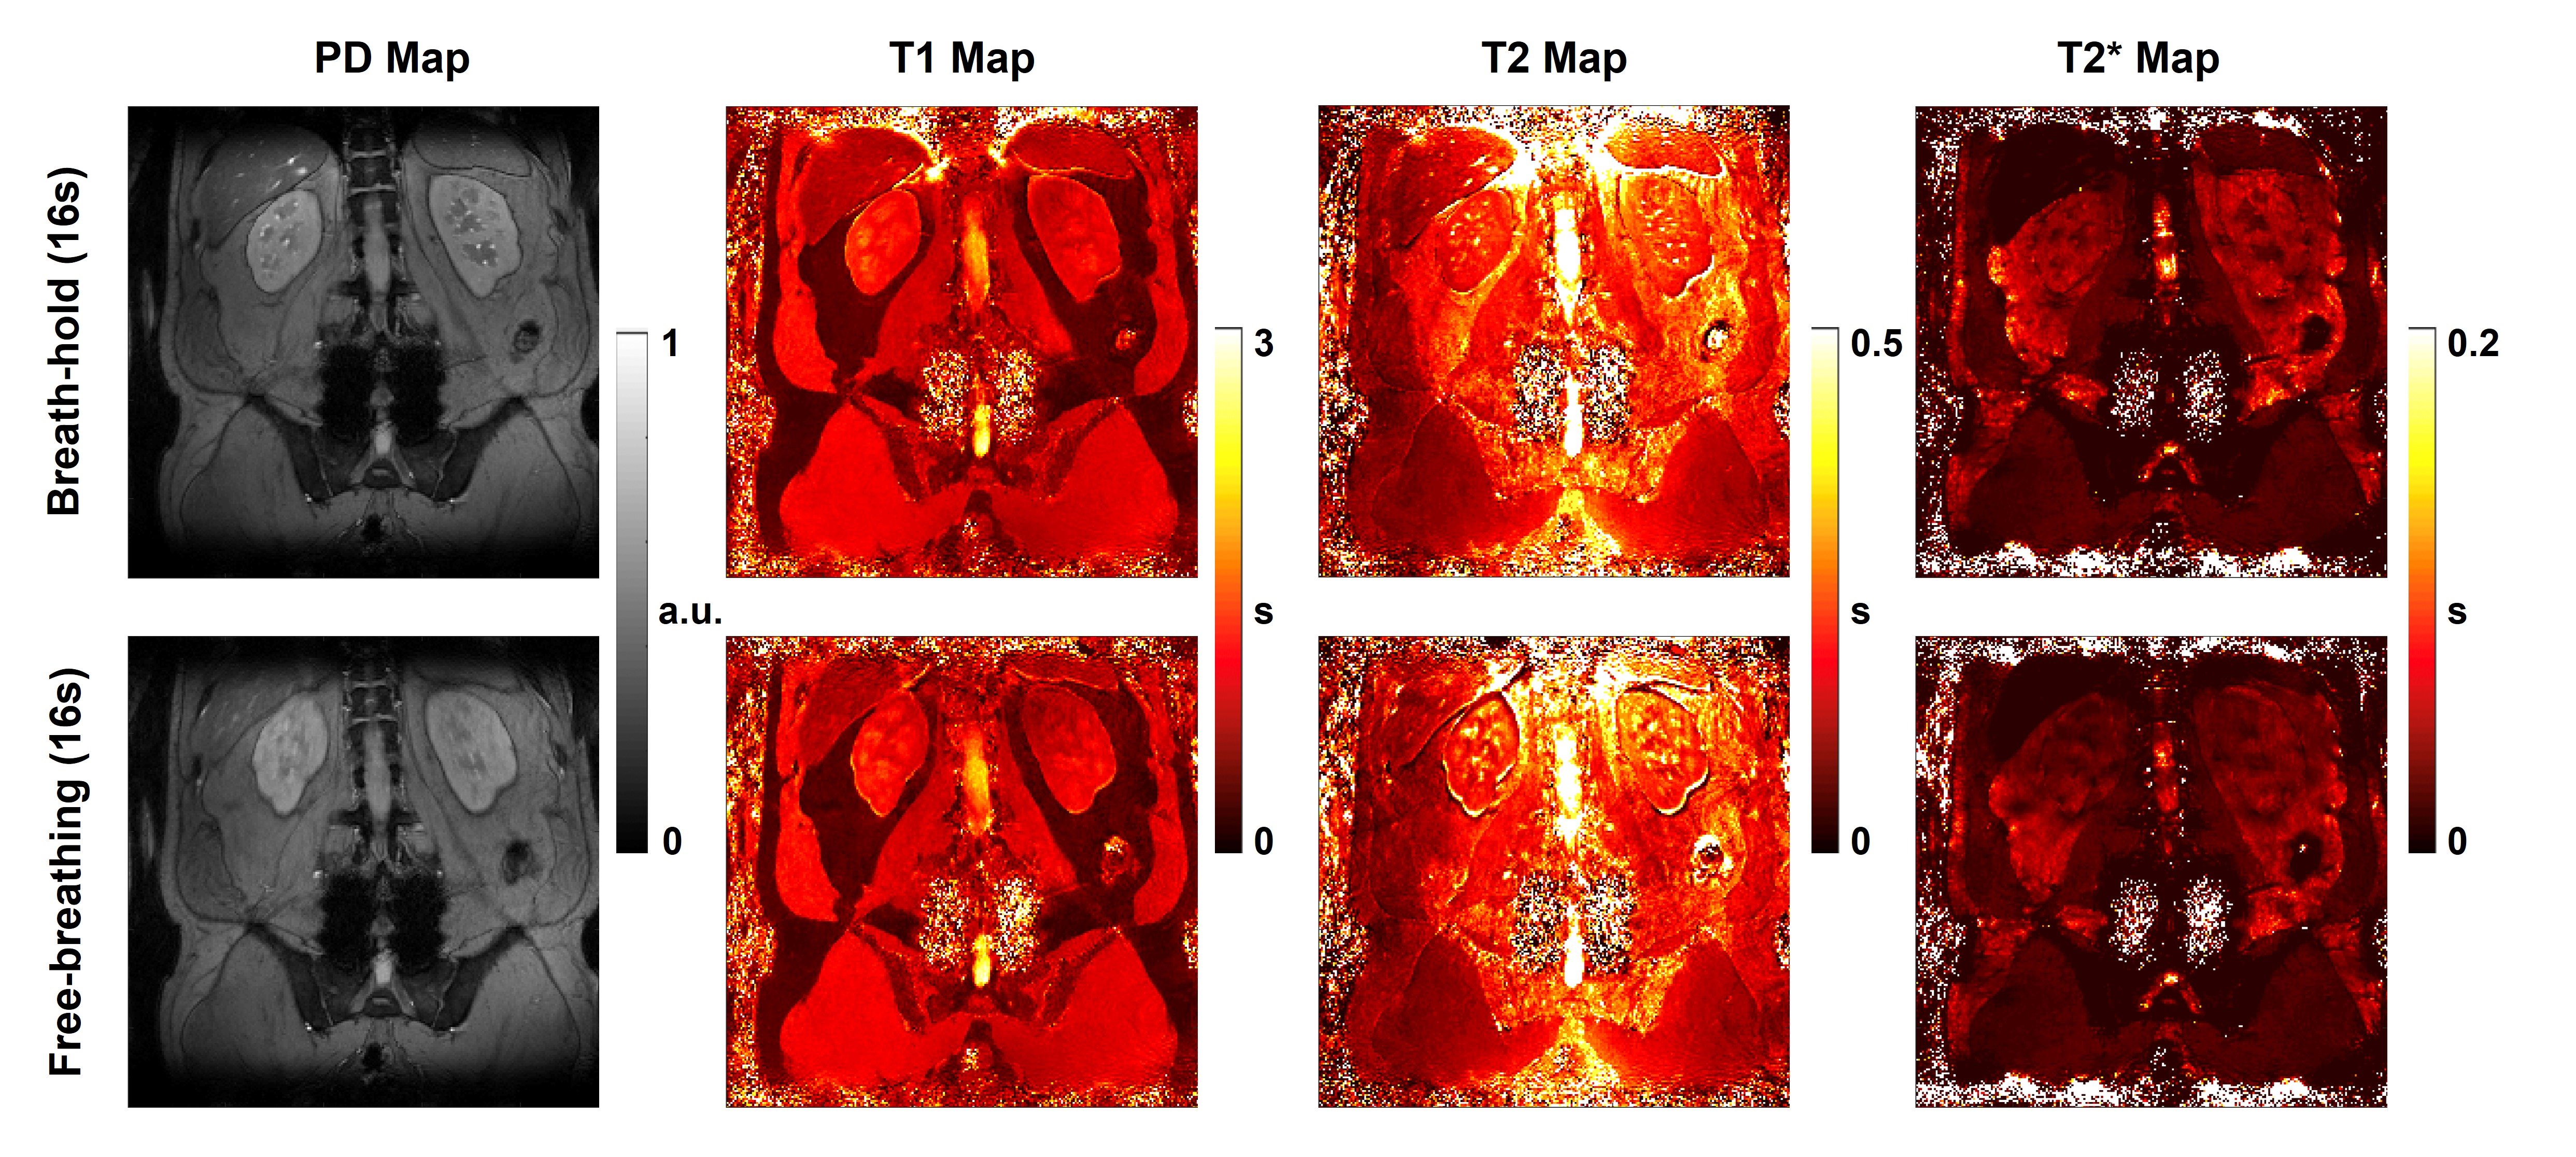
One volunteer was scanned in two separate studies to evaluate the repeatability, shown in Figure 2. The table in Figure 2 shows the measured quantitative parameters from the region-of-interest (ROI) of lower liver, renal cortex and renal medulla in both studies. In both studies, the T1, T2, and susceptibility had similar values. Though T2* relaxation times were different between studies, potentially caused by the different breath-holding stages in two studies, renal cortex showed longer T2* relaxation than renal medulla and liver in both studies. Notably, the upper liver showed a higher susceptibility parameter in the first study, which was possibly caused by different breath-holding stages.Figure 3 compares the result with/without breath-hold during the acquisition with the same volunteer. With the free-breathing during the acquisition, all quantitative maps showed comparable values but with significant blurring artifacts compared to the breath-hold acquisition. It indicated our method is still sensitive to respiratory motion.
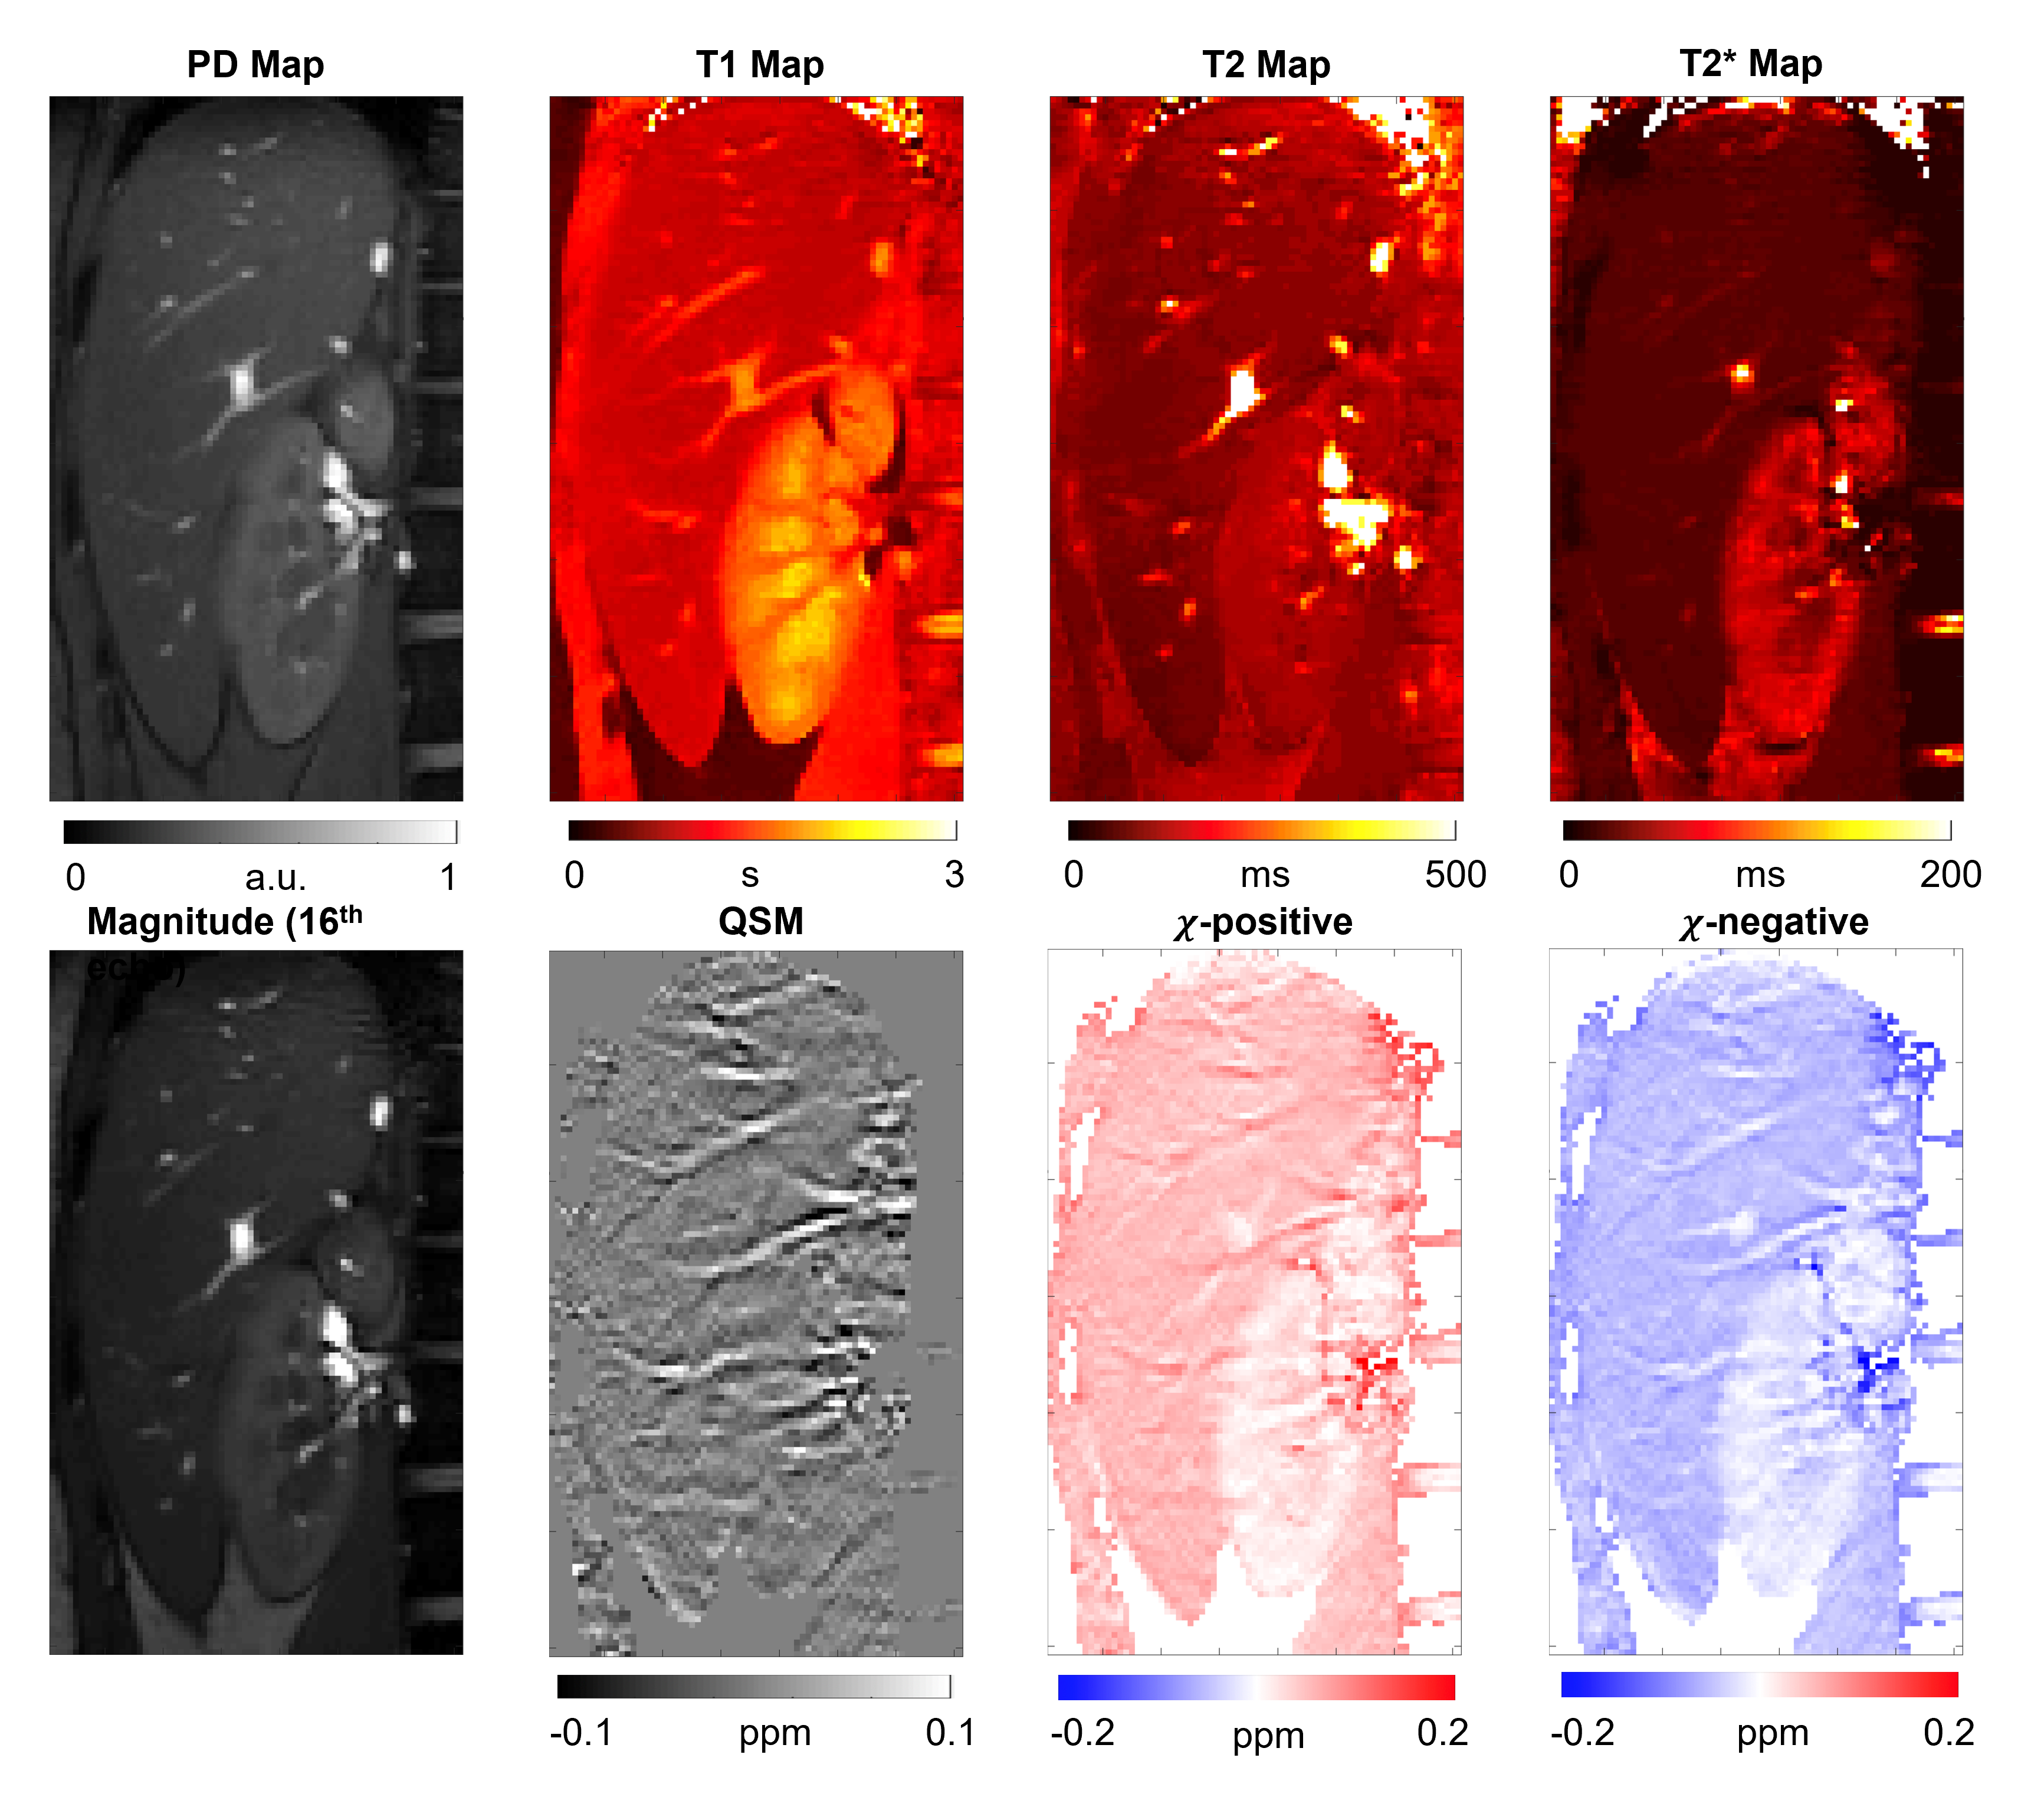
Figure 4 shows the zoomed-in multiparametric quantitative maps covering the liver and kidney from a volunteer. QSM showed both liver and kidney had small bulk susceptibility differences. However, susceptibility source separation showed significant positive and negative susceptibility maps in the liver. This is consistent with higher R2* due to local magnetic susceptibility but that the susceptibility sources cancel out and thus there is no bulk QSM shift in the liver. This is likely is due to hepatic iron concentrations in the liver. The kidneys, which do not have such high iron concentration, had smaller positive and negative susceptibility values. Due to the deoxygenated hemoglobin, the veins showed high positive susceptibility compared to liver tissue with little negative susceptibility.
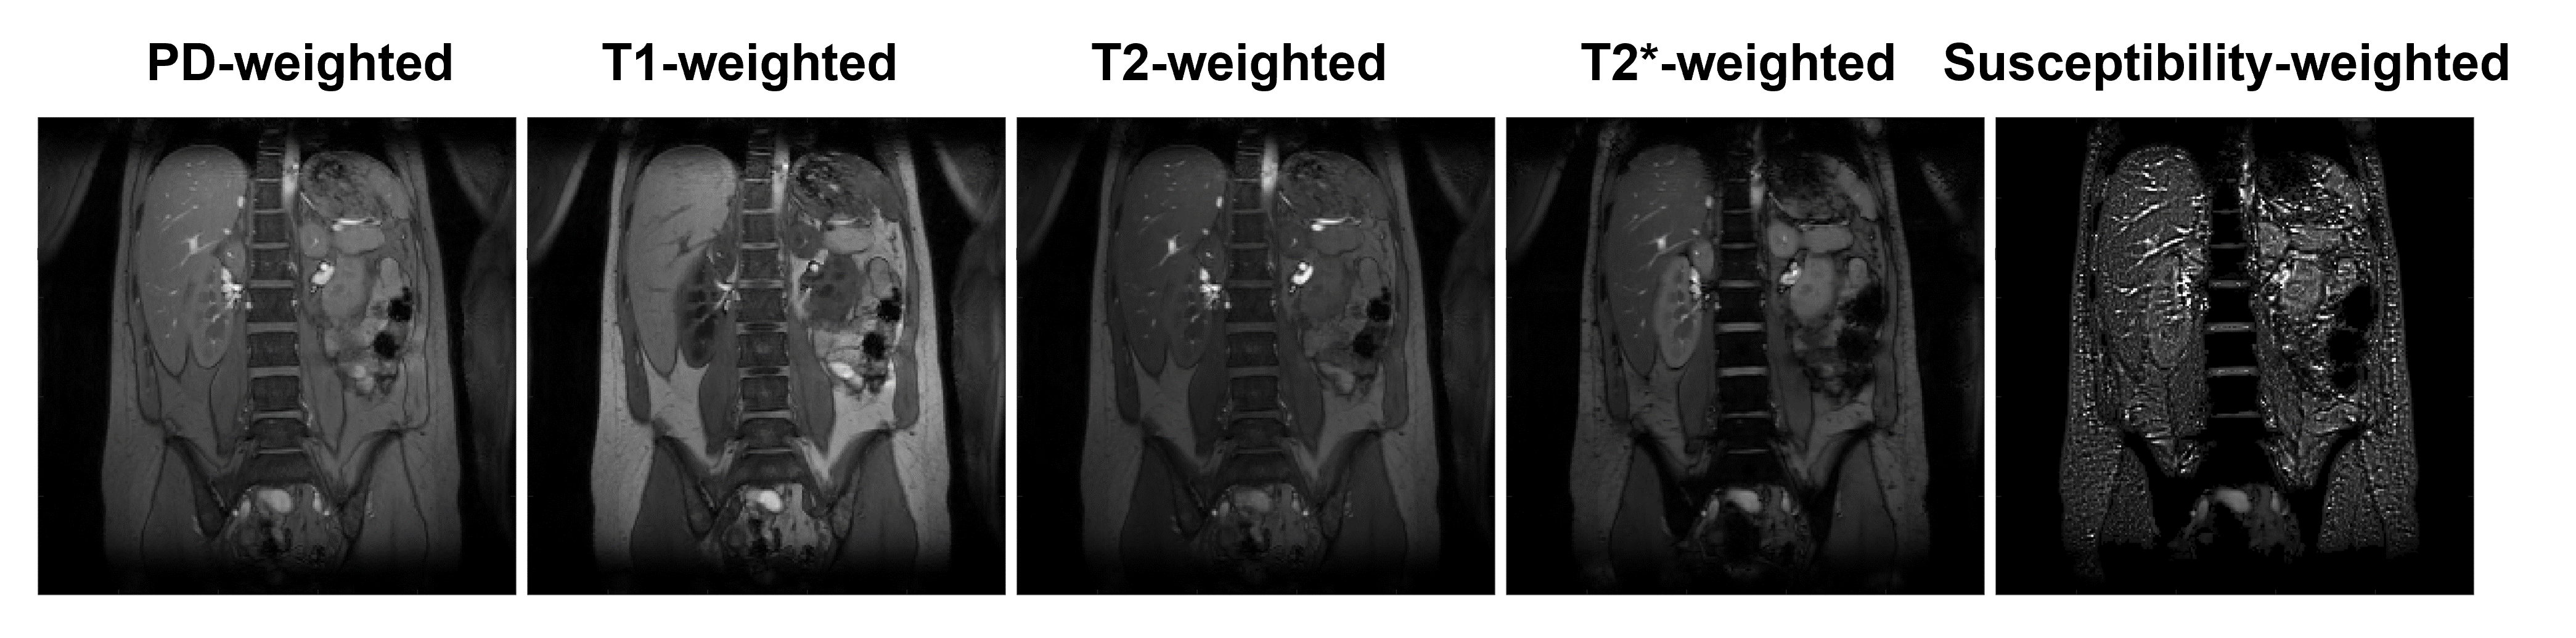
The synthetic PD-weighted, T1-weighted, T2-weighted, T2*-weighted and susceptibility-weighted images are shown in Figure 5, which were calculated from the subspace images. The quality of synthetic images is competitive to traditional contrast images, while the efficiency is much higher.
Discussion and Conclusion
In this study, we showed the feasibility of MRF-EPTI technique in abdominal imaging of the liver and kidneys. The repeatability was demonstrated by the two separate studies on the same volunteer. Our method provided high quality multiparametric quantifications including T1, T2, T2*, QSM, and susceptibility sources separation simultaneously in a single breath-hold acquisition. Further, multi-contrast images can be created from synthetic weighted images. This method is still sensitive to motion, but is also fast enough to be performed in a breath-hold. Our method has potential to provide a more efficient way for guidance of diagnosis and treatment for kidney and liver diseases, and could be applied across other abdomen organs.Acknowledgements
This work was supported by UCSF Department of Radiology & Biomedical Imaging Seed Grant #24-03 and NIH grants R01CA249099, R21DK130002. We thank Mary Frost, Heather Daniel and Kimberly Okamoto for assistance with the human study.References
1. Selby NM, Blankestijn PJ, Boor P, et al. Magnetic resonance imaging biomarkers for chronic kidney disease: a position paper from the European Cooperation in Science and Technology Action PARENCHIMA. Nephrol Dial Transplant. 2018;33(2):ii4-ii14. doi:10.1093/ndt/gfy152
2. Bane O, Seeliger E, Cox E, et al. Renal MRI: From Nephron to NMR Signal. Journal of Magnetic Resonance Imaging. Published online 2023. doi:10.1002/jmri.28828
3. Ma D, Gulani V, Seiberlich N, et al. Magnetic resonance fingerprinting. Nature. 2013;495(7440):187-192. doi:10.1038/nature11971
4. Wang F, Dong Z, Reese TG, et al. Echo planar time-resolved imaging (EPTI). Magn Reson Med. 2019;81(6):3599-3615. doi:10.1002/mrm.27673
5. Cui D, Liu X, Larson P, Xu D. Simultaneous T1 T2 T2* quantification using 2D EPI-MRF by shuffled sampling and compressed time-resolved reconstruction with B0 B1+ correction. In: International Society for Magnetic Resonance in Medicine. ; 2023:2190.
6. Li W, Wu B, Liu C. Quantitative susceptibility mapping of human brain reflects spatial variation in tissue composition. Neuroimage. 2011;55(4):1645-1656. doi:10.1016/j.neuroimage.2010.11.088
7. Li Z, Feng R, Liu Q, et al. APART-QSM: An improved sub-voxel quantitative susceptibility mapping for susceptibility source separation using an iterative data fitting method. Neuroimage. 2023;274. doi:10.1016/j.neuroimage.2023.120148
Figures