0775
Temporal response of T2 and adiabatic T1ρ and T2ρ relaxation times to acute ischemic injury to the femoral head: an in vivo piglet model study1Department of Veterinary Clinical Sciences, University of Minnesota, Saint Paul, MN, United States, 2Center for Magnetic Resonance Research, University of Minnesota, Minneapolis, MN, United States, 3Gillette Children's Specialty Healthcare, Saint Paul, MN, United States, 4Department of Orthopedic Surgery, University of Minnesota, Minneapolis, MN, United States
Synopsis
Keywords: Bone, Ischemia
Motivation: Relaxation time mapping may be clinically useful to inform the severity of ischemic injury to bone marrow in osteonecrosis of the femoral head.
Goal(s): To compare the temporal response of T2, adiabatic T1ρ, and adiabatic T2ρ mapping to acute ischemic injury to the femoral head.
Approach: 24 piglets were imaged using 3D relaxation time mapping at 3T MRI before and after surgical induction of unilateral femoral head ischemia. Corresponding cellular changes were evaluated histologically.
Results: T2 and adiabatic T2ρ were the most sensitive in detecting acute injury to the femoral head, as early as 24 hours after onset of ischemia.
Impact: T2 and/or adiabatic T2ρ relaxation time mapping can potentially address a clinical need for a non-contrast-enhanced imaging technique to establish the severity and extent of bone marrow necrosis in the earliest stages of osteonecrosis of the femoral head.
Introduction
Quantitative T2, T1ρ, adiabatic T1ρ (aT1ρ), and adiabatic T2ρ (aT2ρ) relaxation time mappings have recently been shown to be sensitive in detecting ischemic injury to the bone marrow and cartilage of the femoral head in a piglet model of Legg-Calvé-Perthes disease (LCPD).1-5 LCPD is a childhood hip disorder involving ischemic necrosis of the femoral head, which can lead to its deformation and early onset of hip osteoarthritis.6 Relaxation time mapping techniques may be clinically useful to evaluate early-stage LCPD (and osteonecrosis in general), including informing the severity and extent of ischemic injury and monitoring disease progression and the efficacy of treatments. These methods have been previously studied in the LCPD piglet model in vivo 7 days after onset of ischemia.4,5 The purpose of the current study was to compare the sensitivities of T2, aT1ρ, and aT2ρ mapping to detect acute injury to bone marrow 0 to 14 days after onset of ischemia in the LCPD piglet model. This study expands upon prior work by assessing the temporal response of the relaxation times to acute ischemia in piglets imaged both pre- and post-operatively with histological validation to identify cellular changes driving the relaxation time sensitivities.Methods
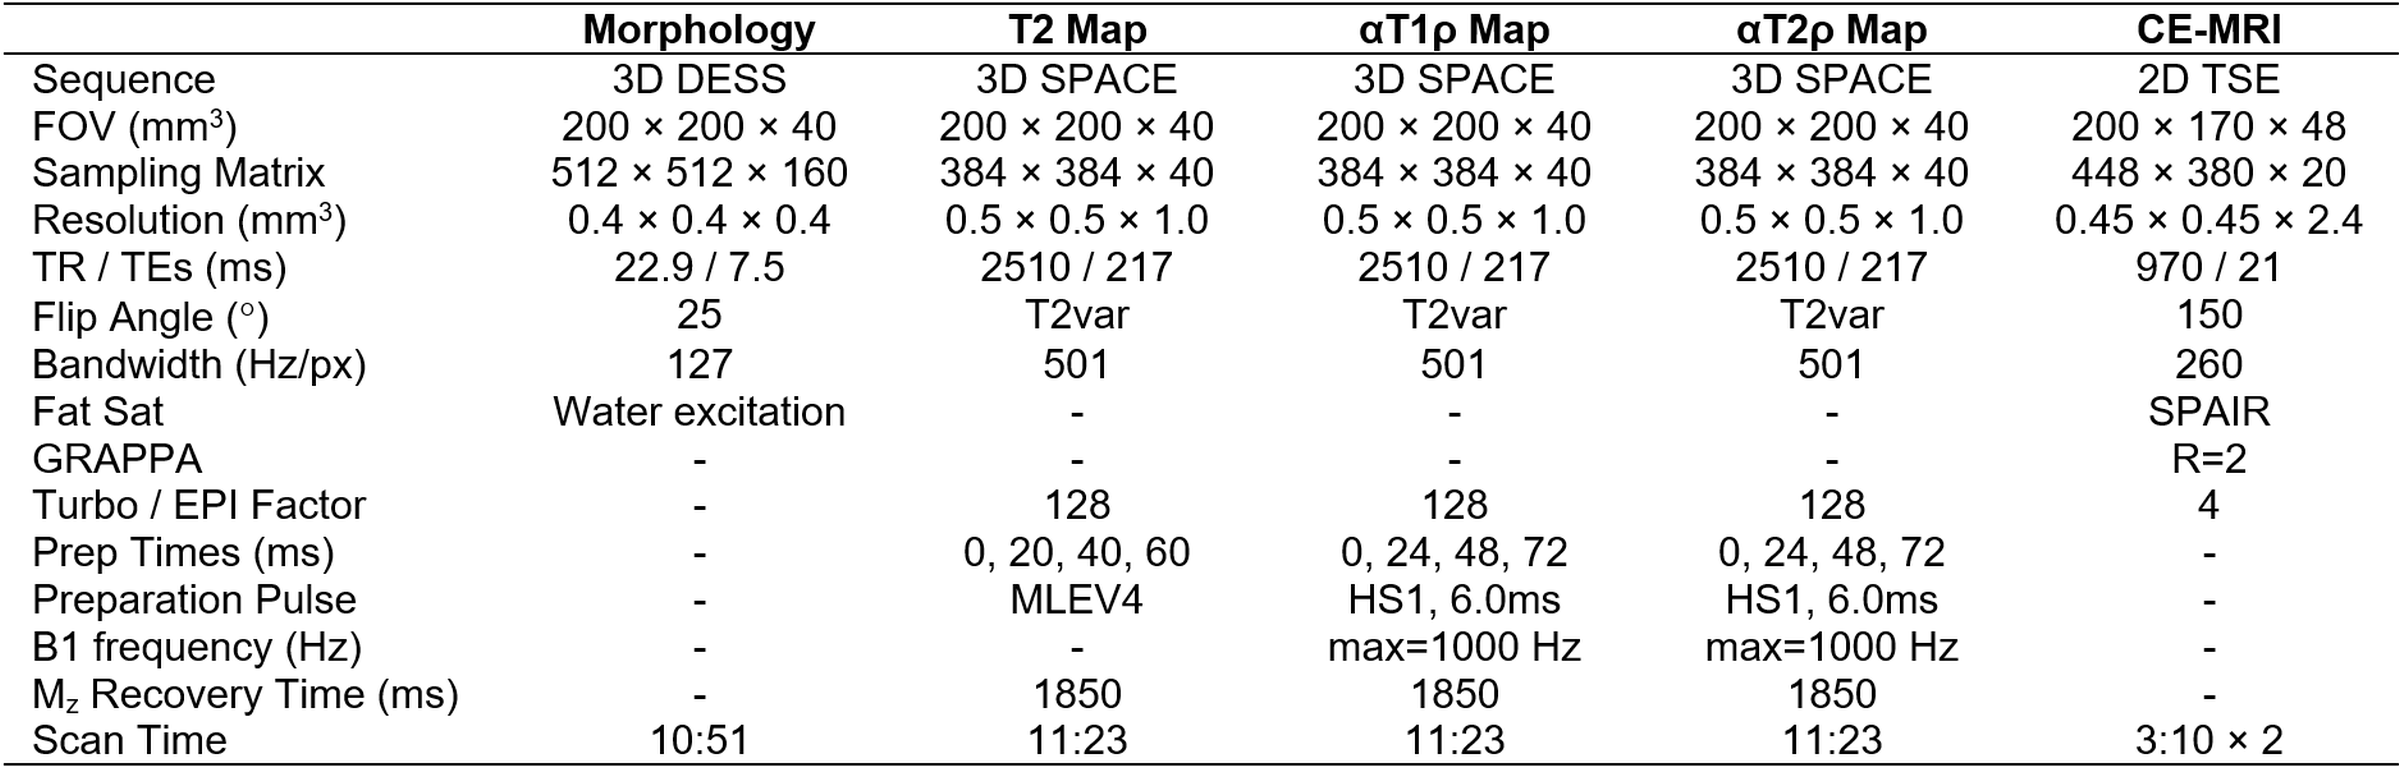
Animal Model: This study was approved by our institution’s IACUC. 24 piglets (12 male, 12 female) underwent surgery at six weeks of age to induce complete (100%) unilateral femoral head ischemia.7 The piglets were imaged in vivo at 3T MRI immediately before surgery and then either 0 (2hr), 1 (24hr), 2 (48hr), 4 (96hr), 7 (168hr), or 14 (336hr) days following onset of ischemia (n=4 piglets/timepoint). Piglets were euthanized following the post-operative MRI exam, and their femoral heads were harvested for histological evaluation.In Vivo 3T MRI: The bilateral hips of the piglets were imaged using a Siemens Prisma 3T MRI scanner and flex receiver arrays. The imaging protocol (Table 1) included: (i) 3D DESS morphological imaging for segmentation; and (ii) quantitative T2, aT1ρ, and aT2ρ mapping using a 3D magnetization-prepared SPACE sequence. Gadolinium contrast-enhanced MRI (acquired post-operatively) confirmed the successful induction of complete femoral head ischemia.
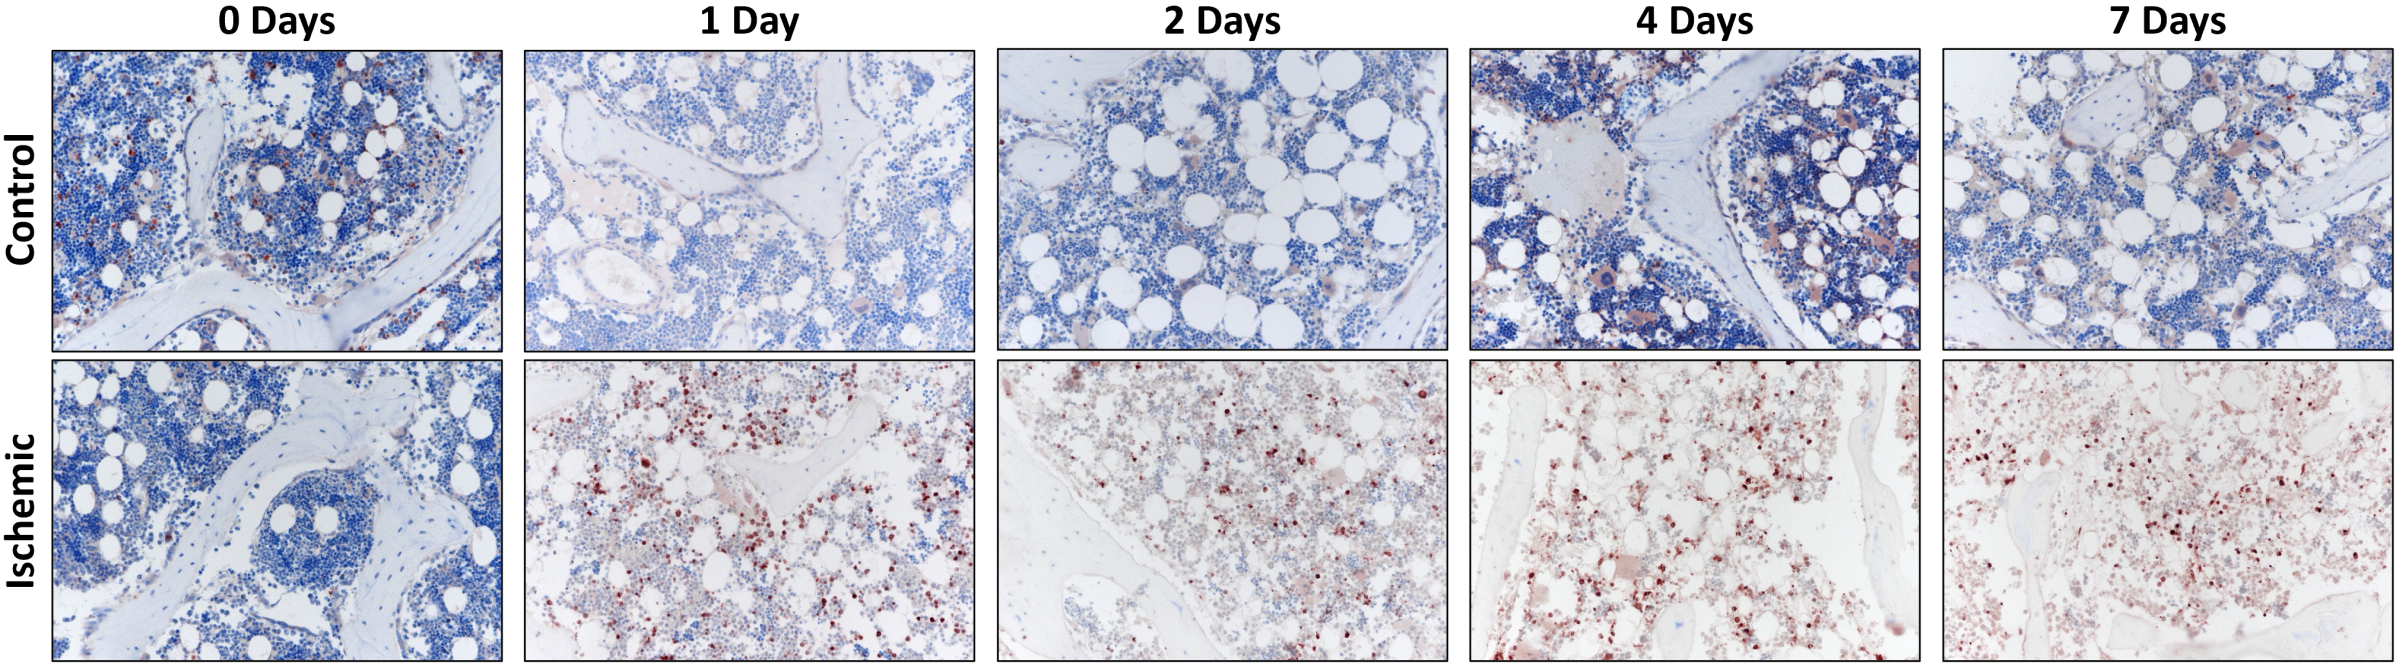
Histology: Femoral head specimens were bisected along the coronal plane, fixed, decalcified, and processed for H&E and caspase-3 IHC staining. The histological sections were evaluated to determine the severity of injury to the bone marrow and bone cells.
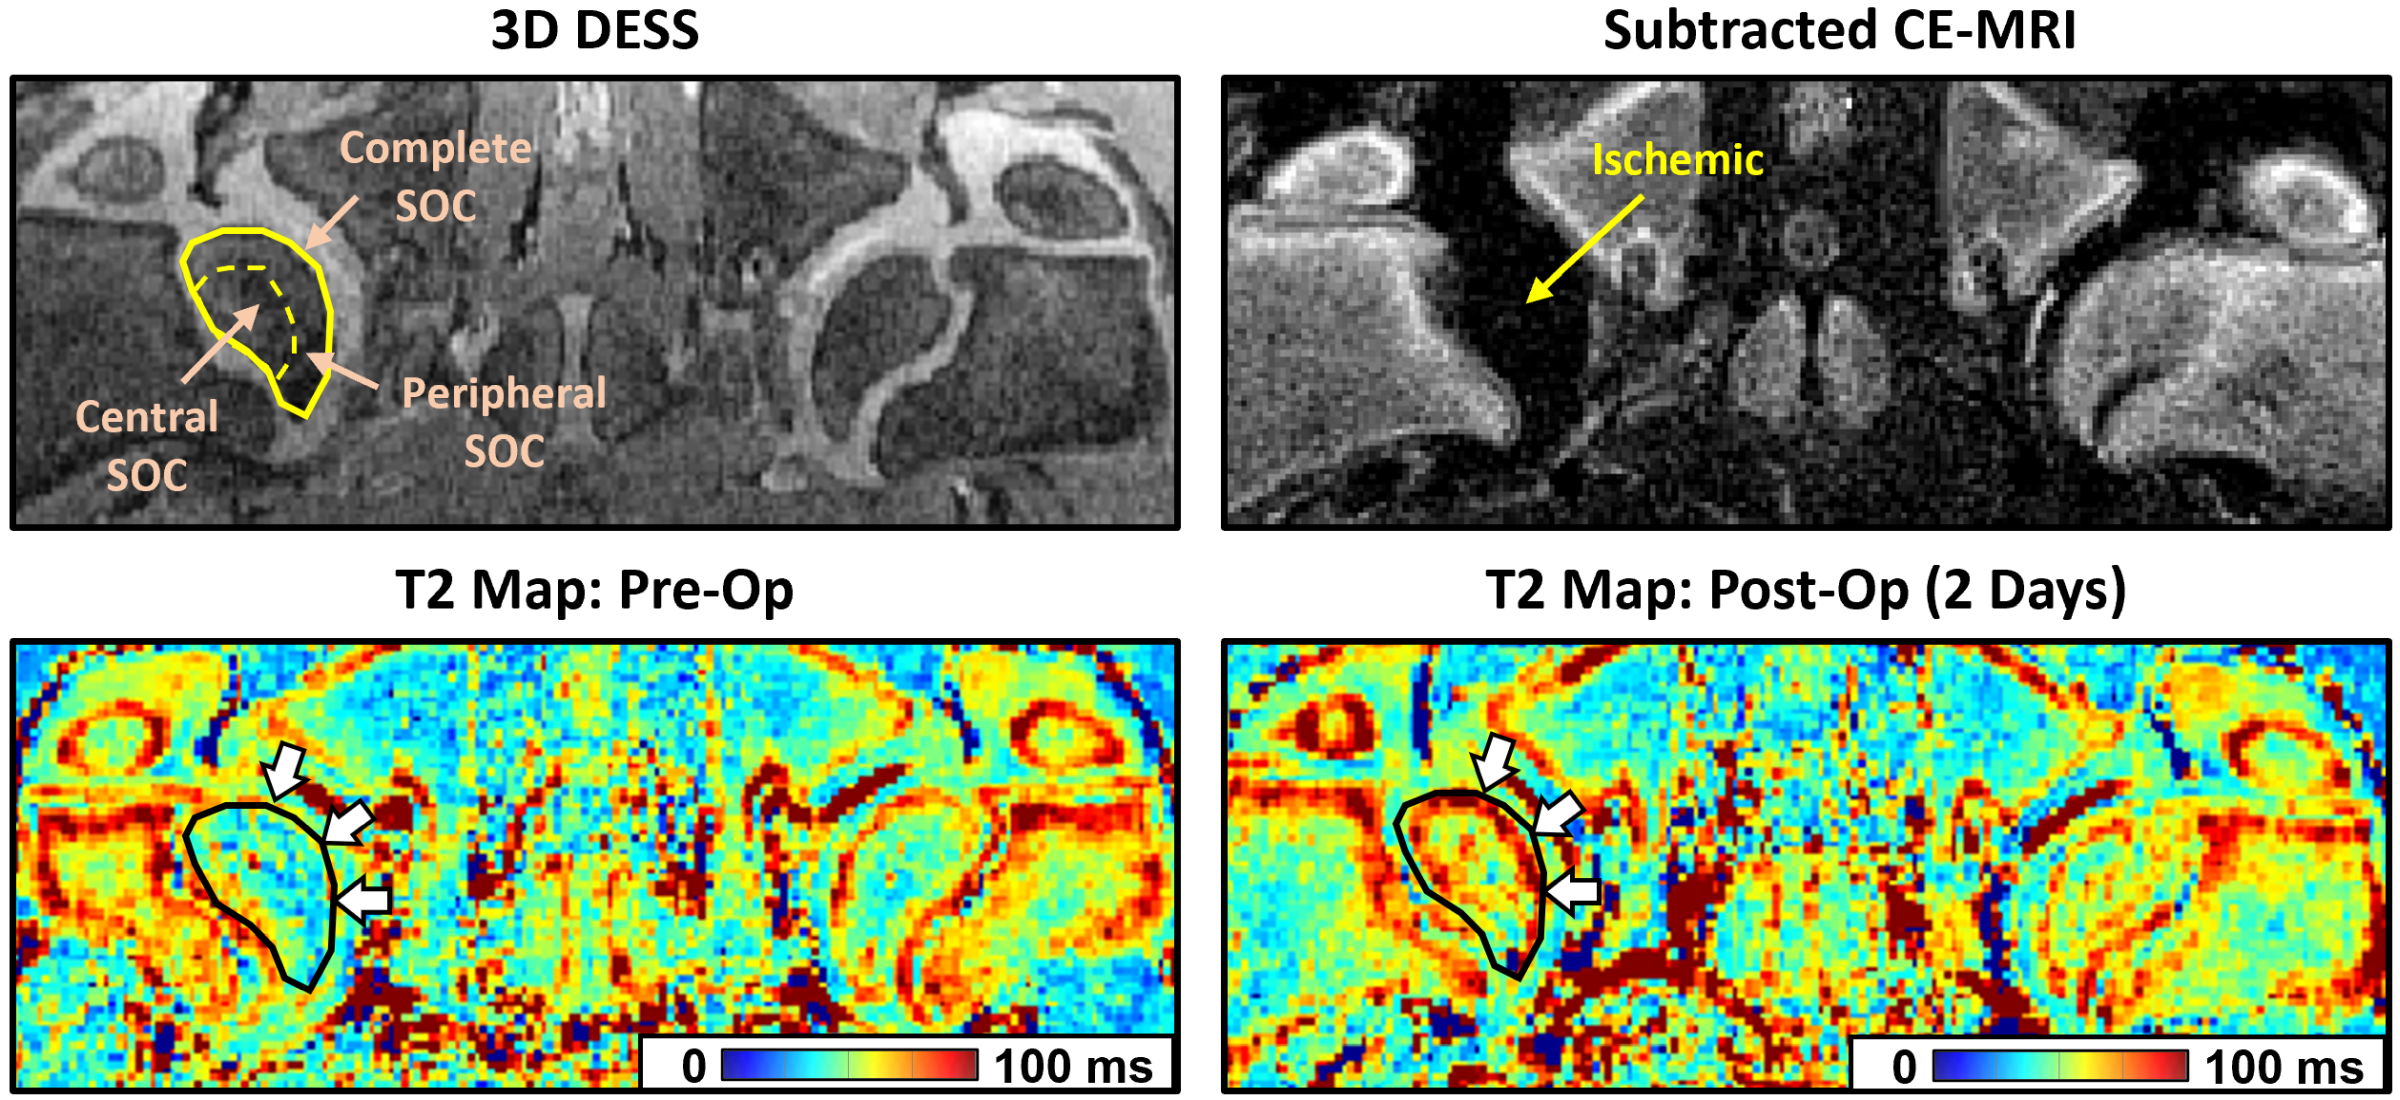
Data Analysis: The relaxation time maps were generated offline using MATLAB and denoised using TNORDIC.8 The secondary ossification center (SOC: the region of trabecular bone and bone marrow of the femoral head) was manually segmented for each hip on the 3D DESS images using ITK-SNAP. The complete SOC region of interest (ROI) was then subdivided into central (mature bone) and peripheral (new bone) subregions, which have been shown to have different responses to early ischemic injury.5 The quantitative maps were spatially co-registered to the 3D DESS images, and the segmentation masks were applied to calculate the median T2, aT1ρ, and aT2ρ values in each 3D ROI. Differences in ROI values were then compared between the pairs of post- and pre-operative scans for the ischemic femoral head of each piglet.
Results
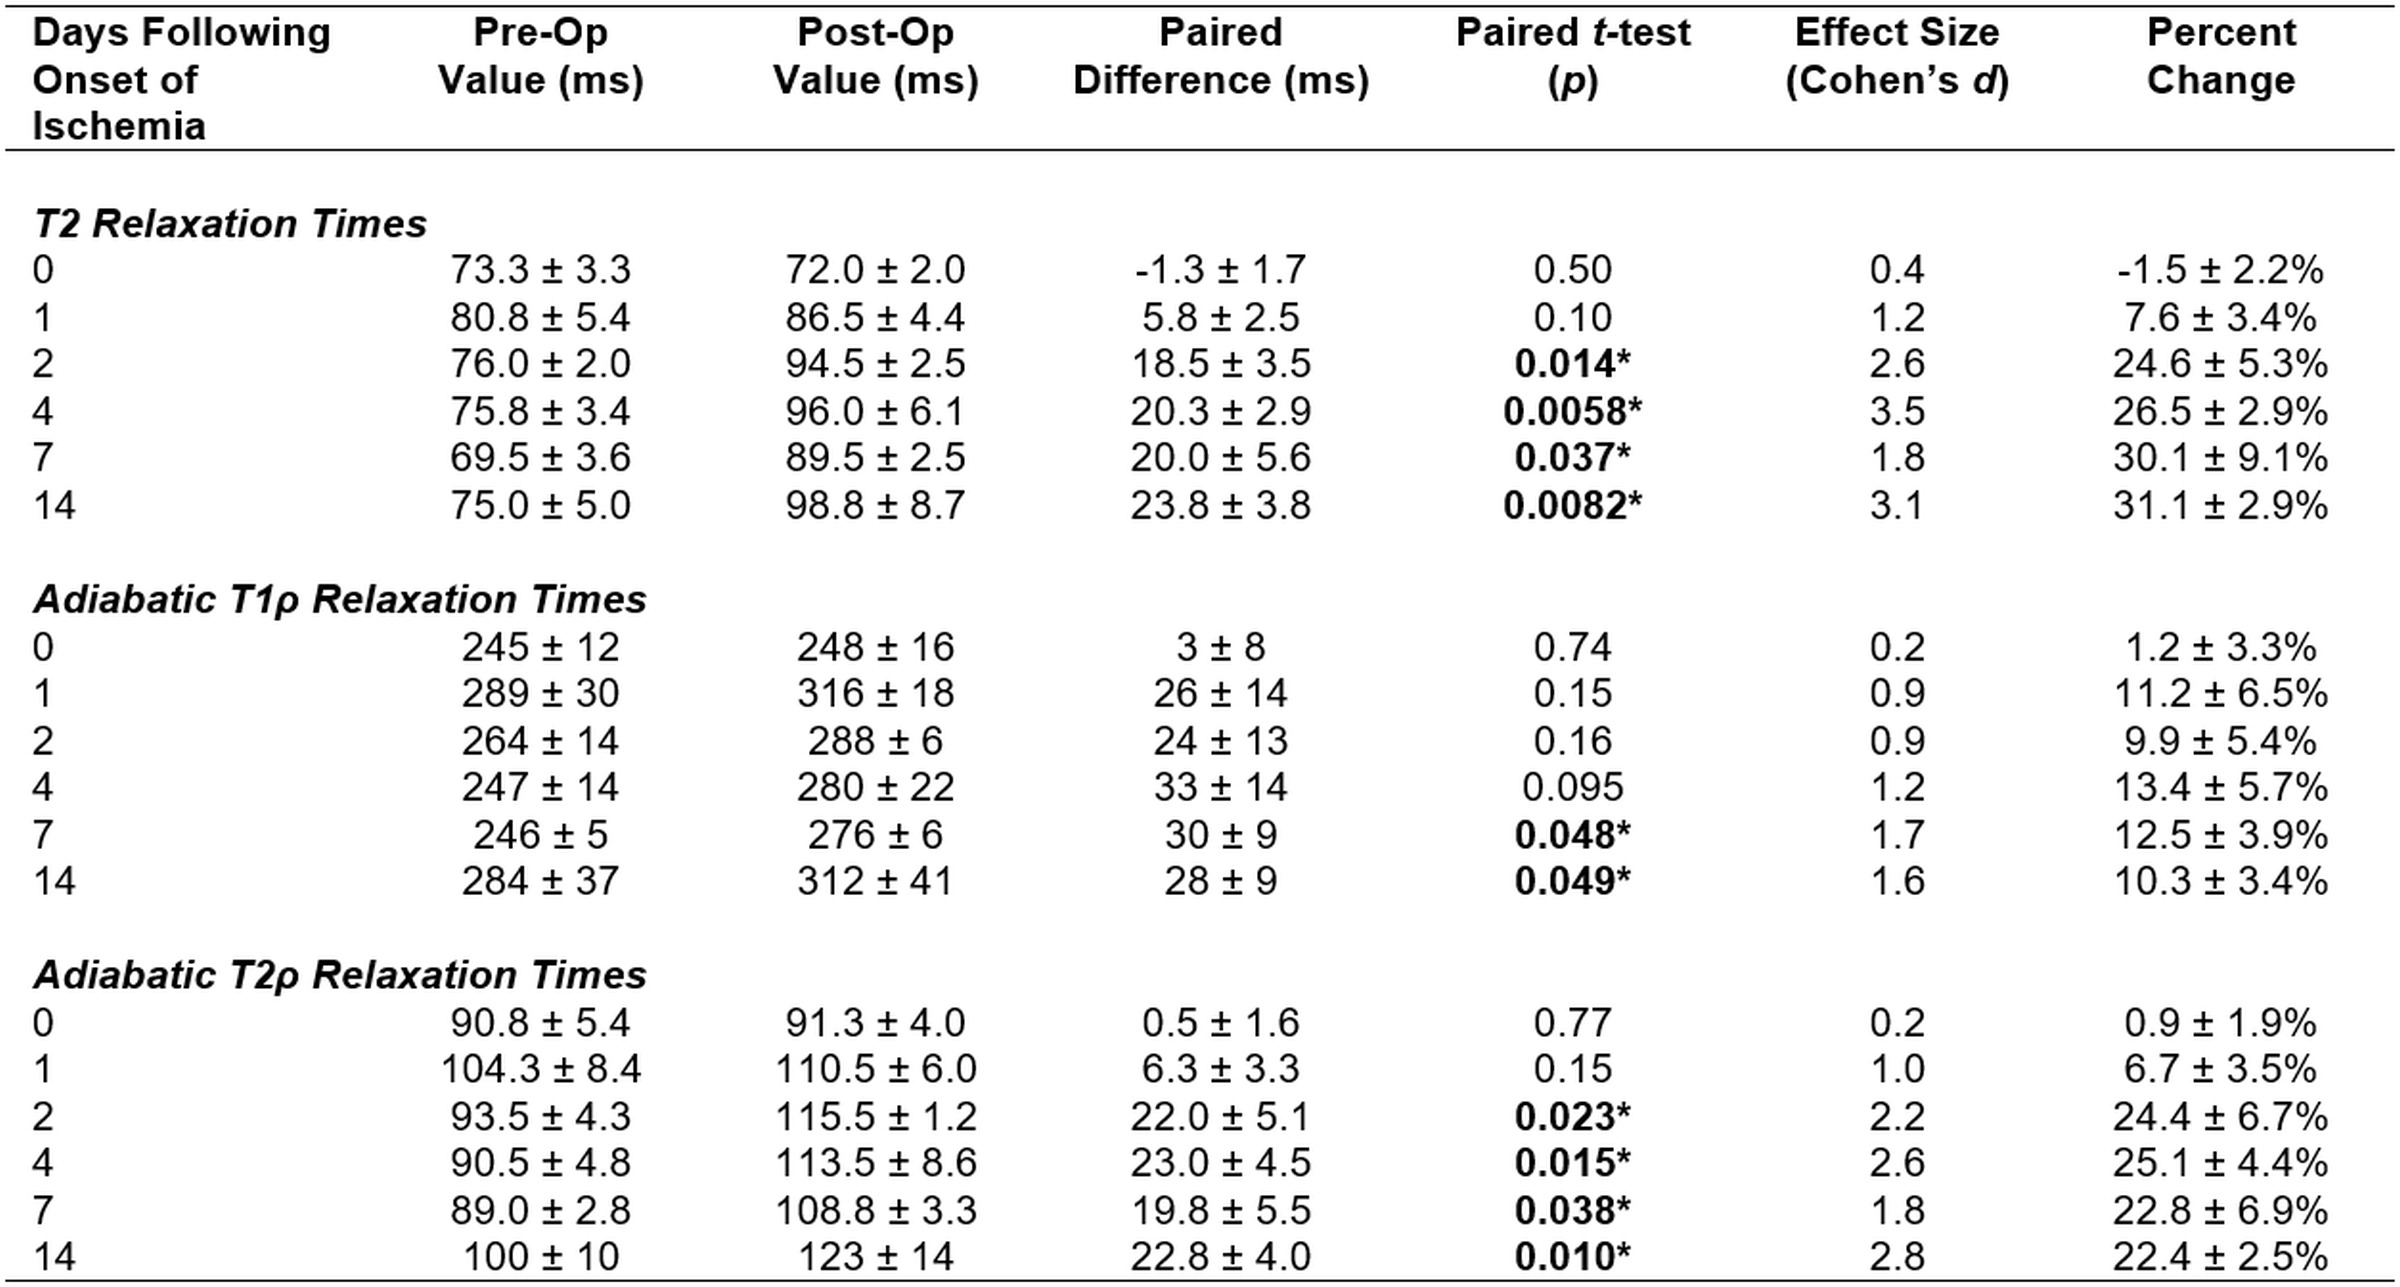
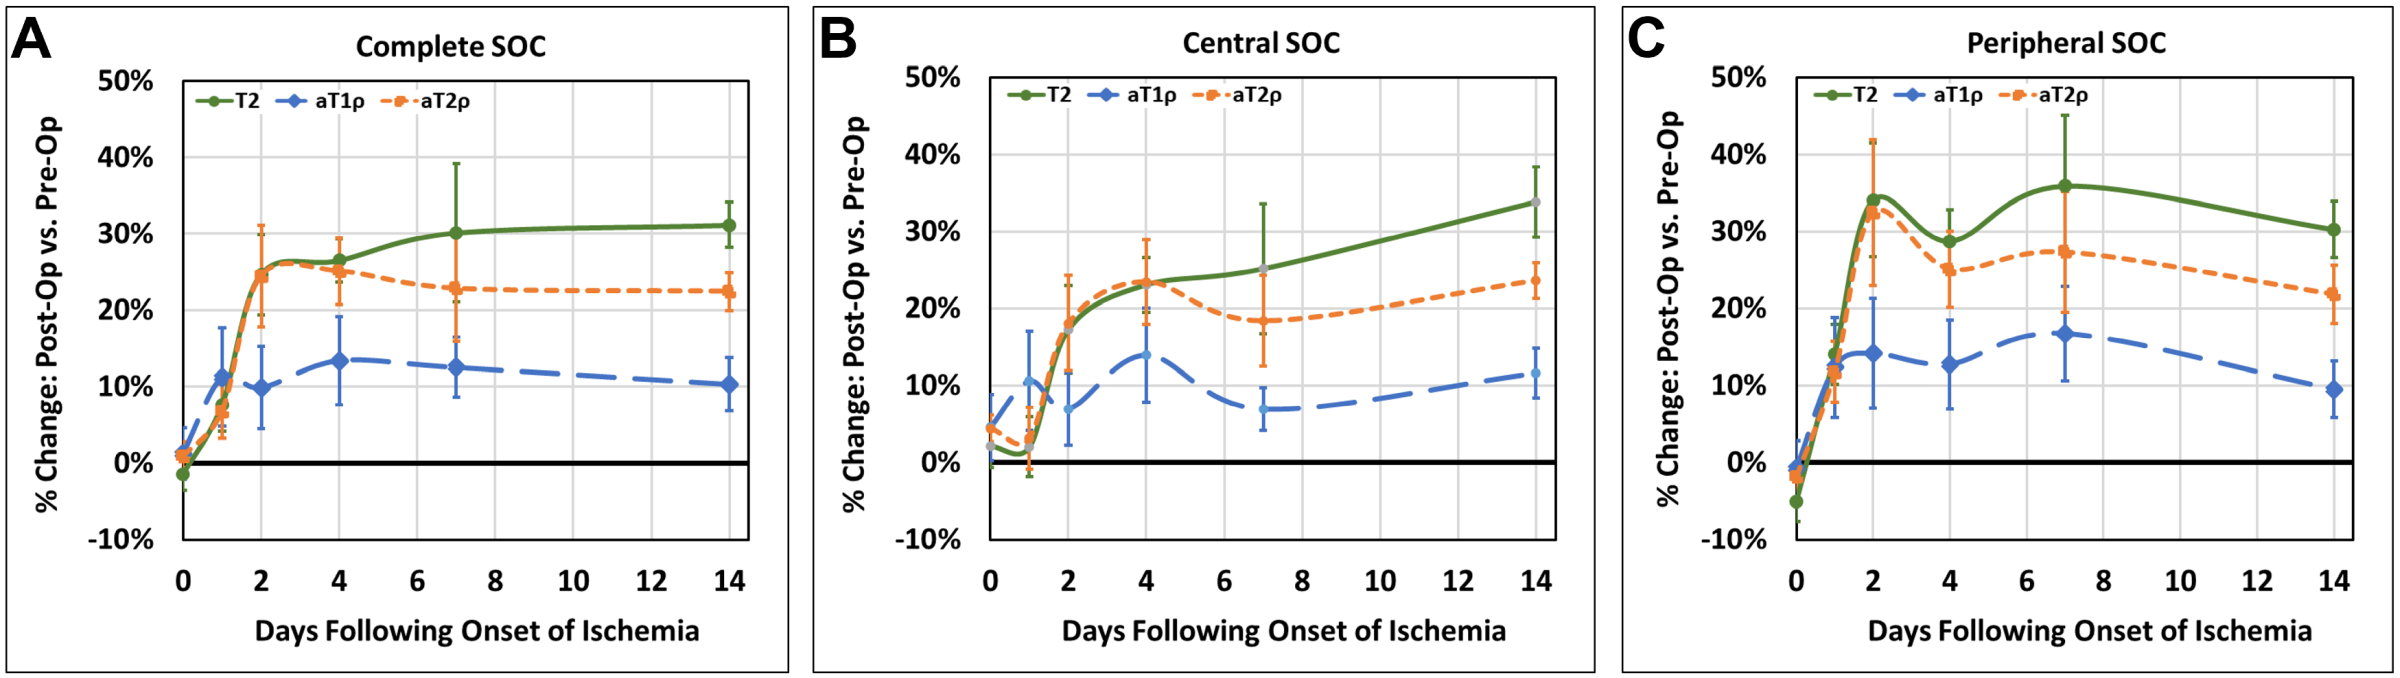
Quantitative results are summarized in Table 2, and comparisons of the percent change in relaxation times are plotted in Figure 1. There was little change immediately following onset of ischemia (0 days). In the peripheral SOC, the relaxation times sharply increased at 1 day and reached a maximum at 2 days, whereas the increase was more gradual in the central SOC. T2 and aT2ρ had a similar response to acute ischemic injury, whereas aT1ρ had a more muted response and peaked at 1 day. Representative T2 maps are shown in Figure 2, and representative caspase-3-stained photomicrographs are shown in Figure 3.Discussion
This study further validates the sensitivities of T2, aT1ρ, and aT2ρ relaxation time mappings in detecting ischemic injury to bone marrow, and it provides new insights into their unique contrast mechanisms. While all three relaxation times were sensitive to the onset of necrotic cell death at 1-day post-op (e.g., due to cell swelling), T2 and aT2ρ had greater sensitivity starting at 2 days post-op in detecting ongoing cellular disintegration (e.g., more extensive cell death and breakdown of cell membranes). As cells continued to break down from 4 to 14 days post-op, T2 had a greater response than aT2ρ. The relaxation time changes were more pronounced in the peripheral vs. central subregions of the SOC, likely a consequence of greater susceptibility to ischemic injury in the more vascularized, cellular, hematopoietic, and metabolically active peripheral region.Acknowledgements
This study was supported by the National Institutes of Health (R01AR081877, R56AR078315, and P41EB027061). The content is solely the responsibility of the authors and does not necessarily represent the official views of the National Institutes of Health. We thank the staff of the University of Minnesota’s Clinical Investigation Center, Comparative Pathology Shared Resource, and Center for Magnetic Resonance Research for their assistance.References
1. Johnson CP, Wang L, Tóth F, Aruwajoye O, Carlson CS, Kim HK, Ellermann JM. Quantitative MRI helps to detect hip ischemia: preclinical model of Legg-Calvé-Perthes disease. Radiology 2018; 289(2):386-395.
2. Johnson CP, Tóth F, Carlson CS, Armstrong AR, Zbýň Š, Wu B, Ellermann JM, Kim HKW. T1ρ and T2 mapping detect acute ischemic injury in a piglet model of Legg-Calvé-Perthes disease. J Orthop Res 2022; 40(2):484-494.
3. Armstrong AR, Bhave S, Buko EO, Chase KL, Tóth F, Carlson CS, Ellermann JM, Kim HKW, Johnson CP. Quantitative T2 and T1ρ mapping are sensitive to ischemic injury to the epiphyseal cartilage in an in vivo piglet model of Legg-Calvé-Perthes disease. Osteoarthritis Cartilage 2022; 30(9):1244-1253.
4. Johnson CP, Bhave S, Armstrong AR, Tóth F. Utility of adiabatic T1ρ and T2ρ mapping to detect ischemic injury to the femoral head: an in vivo piglet model study at 3T MRI. Proc ISMRM 2021 (Virtual); No. 0154.
5. Buko EO, Albrecht D, Armstrong AR, Toth F, Johnson CP. 3D T2 and T1ρ mapping of ischemic injury to the femoral head: an in vivo piglet model study. Proc ISMRM 2023 (Toronto); No. 4532.
6. Kim HK. Pathophysiology and new strategies for the treatment of Legg-Calve-Perthes disease. J Bone Joint Surg Am 2020; 94:659-669.
7. Kim HK, Su PH. Development of flattening and apparent fragmentation following ischemic necrosis of the capital femoral epiphysis in a piglet model. J Bone Joint Surg Am 2002; 84-A(8):1329-34.
8. Moeller S, Johnson CP, Buko EO, Toth F, Metzger G, Mangia S, Michaeli S, Ponticorvo S, Canna A, Ugurbil K, Akcakaya M. Locally low-rank denoising in transform domains. Proc ISMRM 2023 (Toronto); No. 1108.
Figures