0774
Dynamic contrast-enhanced MRI of the synovium and synovial subregions in knee osteoarthritis1Radiology & Nuclear Medicine, Erasmus MC, Rotterdam, Netherlands, 2Radiology, University of Wisconsin Madison, Madison, WI, United States
Synopsis
Keywords: Osteoarthritis, DSC & DCE Perfusion, Synovium
Motivation: A precise method to quantify the degree of synovial inflammation in patients with knee osteoarthritis (OA) is needed to evaluate response to new disease modifying treatments in clinical trials.
Goal(s): To evaluate the repeatability of quantitative dynamic contrast enhanced (DCE) MRI derived biomarkers for synovitis quantification in the whole synovium and synovial subregions.
Approach: Test-retest study comprising DCE-MRI at baseline and 1 month follow-up in knee OA patients. Vessel mapping was used to determine synovial subregions.
Results: DCE-MRI biomarkers have good test-retest repeatability in both the whole synovium and synovial subregions, with Ktrans showing the best performance.
Impact: Quantitative DCE-MRI can provide precise biomarkers for synovitis quantification in knee osteoarthritis. Subregional evaluation using vessel mapping is an important tool for more precise treatment response evaluation in clinical trials with targeted local interventions, such as selective arterial embolization.
Introduction
Knee osteoarthritis (OA) is a common joint disorder and a leading cause of pain and morbidity. Inflammation of the joint lining, known as synovitis, is often seen, and is strongly associated with both knee pain severity and OA progression.1 Dynamic contrast-enhanced magnetic resonance imaging (DCE-MRI) monitors the change in contrast enhancement in a tissue of interest over time. DCE-MRI has stronger correlations with pain than static CE-MRI,2 and has been implemented in previous studies on synovitis in knee OA to evaluate response to targeted treatment.3 In a prior test-retest study, DCE-MRI biomarkers showed excellent repeatability and sensitivity to change.4 Given that DCE-MRI biomarkers are highly dependent on acquisition and post-processing methods5 it is necessary to replicate these findings at other sites. In addition, OA treatments could selectively target anatomical subregions of the synovium and thus precise subregional assessment of DCE-MRI biomarkers is needed.The purpose of this study is to evaluate test-retest repeatability of DCE-MRI within the whole synovium and develop a precise semi-automatic method for assessment of synovial subregions in patients with knee OA.
Methods
ParticipantsPatients with mild-to-moderate knee OA (Kellgren-Lawrence grade 1-3) who were allocated to the control group in a prospective randomized controlled trial of genicular artery embolization were included.6 Allocation to the control group involved no disease modifying treatment during the course of the study. Participants underwent MR imaging of their most symptomatic knee at 3T (SIGNA Premier, GE Healthcare, Waukesha, WI) using a dedicated 18-channel knee coil at baseline and after 1 month.
Image acquisition
Image acquisition (Figure 1) consisted of pre-contrast 3D spoiled gradient echo (SPGR) sequence with variable flip angle for T1 mapping, followed by a dual-echo SPGR sequence (DISCO; DIfferential Sub-sampling with Cartesian Ordering), in which the spatial resolution was optimized to allow for visualization of small vessels. After the initial mask phase, 0.1 ml/kg gadovist was injected and subsequently 34 dynamic phases were acquired, with a temporal resolution of 10.2 seconds.
Image processing
For all DCE-MRI images, motion compensation was performed rigid groupwise registration7 and follow-up images were affinely registered to the baseline image using Elastix (v5.0.1).
Segmentation of the whole synovium was performed by a researcher under supervision of an experienced MSK radiologist. Synovial segmentation comprised an initial rough manual segmentation on the last dynamic phase followed by automatic selection of enhancing voxels using shuffle transform8. Synovial subregions were determined by assigning synovial voxels to the corresponding closest artery after semi-automatic mapping of 8 genicular arteries9 using MeVisLab (MeVis Medical Solutions AG, version 3.3) (Figure 2).
T1 mapping and pharmacokinetic DCE modelling was done using open source software (MADYM, v4.21.1)10. The commonly used combination of the Parker literature arterial input function, and the Extended Toft’s pharmacokinetic model was applied. Voxelwise perfusion parameters were calculated and median Ktrans, Ve, and Vp values were extracted for the whole synovium and for each synovial subregion separately. In addition, the semi-quantitative measure initial area under the cure (IAUC60) was also calculated.
Statistics
Test-retest repeatability was evaluated in accordance with QIBA standards11 by estimating within-subject variance (σw2) and between-subject variance (σb2) with a two-way random effects model. Intraclass correlation coefficients (ICC) and log-transformed within-subject coefficients of variation (wCV) were calculated, as well as the repeatability coefficient (RC). The RC, which is also known as the smallest detectable change, represents the smallest difference that can be considered genuine rather than due to measurement noise with 95% confidence.
Results
30 patients were included, of which one patient was excluded due to errors during image acquisition. Mean age was 57.8 years (SD 8.0), mean Body Mass Index was 30.8 kg/m2 (SD 4.5), 15 participants (52%) were female, with Kellgren-Lawrence grades 1 (3%), 2 (41%) and 3 (55%).Bland-altman plots showing the difference between baseline and 1-month measurements for all biomarkers are shown in Figure 3. IAUC60 had the highest ICC (0.873), followed by Ktrans (0.848), vp (0.767) and ve (0.729) (Figure 4). wCV was lowest for Ktrans and highest for IAUC60. The RC for Ktrans was 0.043.
Repeatability was comparable for all subregions, with ICCs for Ktrans ranging from 0.70 to 0.90 (Figure 5).
Discussion
Our ICC is comparable to a prior study reporting an ICC of 0.9 for Ktrans of the whole synovium in patients with knee OA and healthy volunteers. Our RC is substantially higher, potentially due to differences in population.Conclusion
Semi-automatic segmentation of the synovium and synovial subregions on DCE-MRI in knee OA is feasible. Quantitative DCE-MRI biomarkers have good test-retest repeatability on both the whole synovium and synovial subregions, with Ktrans showing the best performance.Acknowledgements
Funding for this study was provided by: Cook Medical, Erasmus MC Rotterdam, Stichting Coolsingel, Boston Scientific.References
1. Baker K, Grainger A, Niu J, et al. Relation of synovitis to knee pain using contrast-enhanced MRIs. Ann Rheum Dis. 2010;69(10):1779-1783. doi:10.1136/ard.2009.121426
2. Riis RGC, Gudbergsen H, Henriksen M, et al. Synovitis assessed on static and dynamic contrast-enhanced magnetic resonance imaging and its association with pain in knee osteoarthritis: A cross-sectional study. Eur J Radiol. 2016;85(6):1099-1108. doi:10.1016/j.ejrad.2016.03.017
3. Riis RGC, Henriksen M, Klokker L, et al. The effects of intra-articular glucocorticoids and exercise on pain and synovitis assessed on static and dynamic magnetic resonance imaging in knee osteoarthritis: exploratory outcomes from a randomized controlled trial. Osteoarthritis Cartilage. 2017;25(4):481-491. doi:10.1016/j.joca.2016.10.009
4. MacKay JW, Nezhad FS, Rifai T, et al. Dynamic contrast-enhanced MRI of synovitis in knee osteoarthritis: repeatability, discrimination and sensitivity to change in a prospective experimental study. Eur Radiol. 2021;31(8):5746-5758. doi:10.1007/s00330-021-07698-z
5. Kim H. Variability in Quantitative DCE-MRI: Sources and Solutions. J Nat Sci. 2018;4(1):e484.
6. Van Zadelhoff TA, Moelker A, Bierma-Zeinstra SMA, Bos PK, Krestin GP, Oei EHG. Genicular artery embolization as a novel treatment for mild to moderate knee osteoarthritis: protocol design of a randomized sham-controlled clinical trial. Trials. 2022;23(1):24. doi:10.1186/s13063-021-05942-x
7. Huizinga W, Poot DHJ, Guyader JM, et al. PCA-based groupwise image registration for quantitative MRI. Med Image Anal. 2016;29:65-78. doi:10.1016/j.media.2015.12.004
8. Xanthopoulos E, Hutchinson CE, Adams JE, et al. Improved wrist pannus volume measurement from contrast-enhanced MRI in rheumatoid arthritis using shuffle transform. Magn Reson Imaging. 2007;25(1):110-116. doi:10.1016/j.mri.2006.10.018
9. Okuno Y, Korchi AM, Shinjo T, Kato S. Transcatheter arterial embolization as a treatment for medial knee pain in patients with mild to moderate osteoarthritis. Cardiovasc Intervent Radiol. 2015;38(2):336-343. doi:10.1007/s00270-014-0944-8
10. Berks M, Parker G, Little R, Cheung S. Madym: A C++ toolkit for quantitative DCE-MRI analysis. J Open Source Softw. 2021;6(66):3523. doi:10.21105/joss.03523
11. Raunig DL, McShane LM, Pennello G, et al. Quantitative imaging biomarkers: A review of statistical methods for technical performance assessment. Stat Methods Med Res. 2015;24(1):27-67. doi:10.1177/0962280214537344
Figures
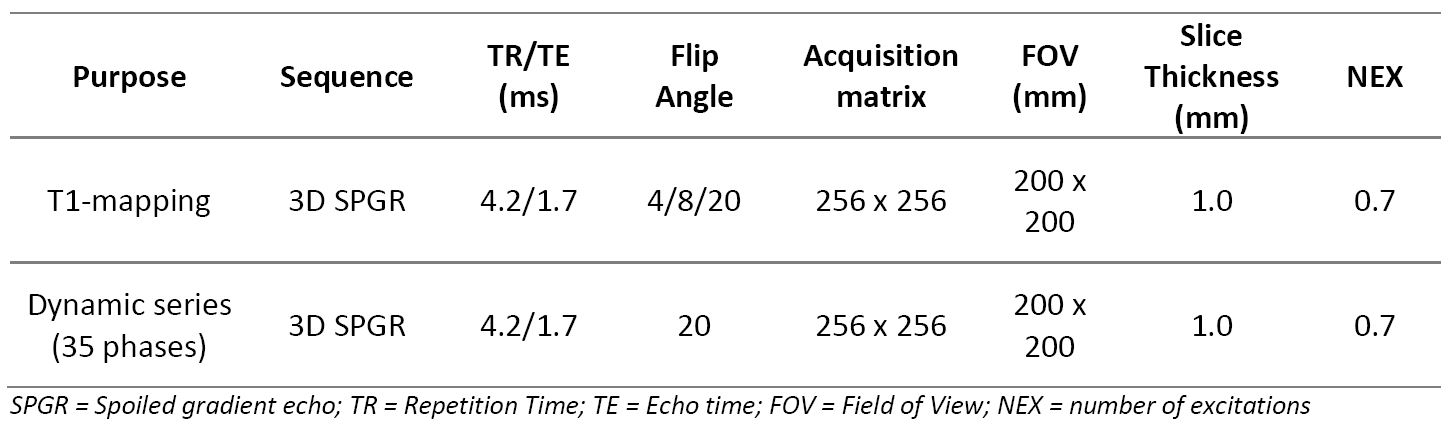
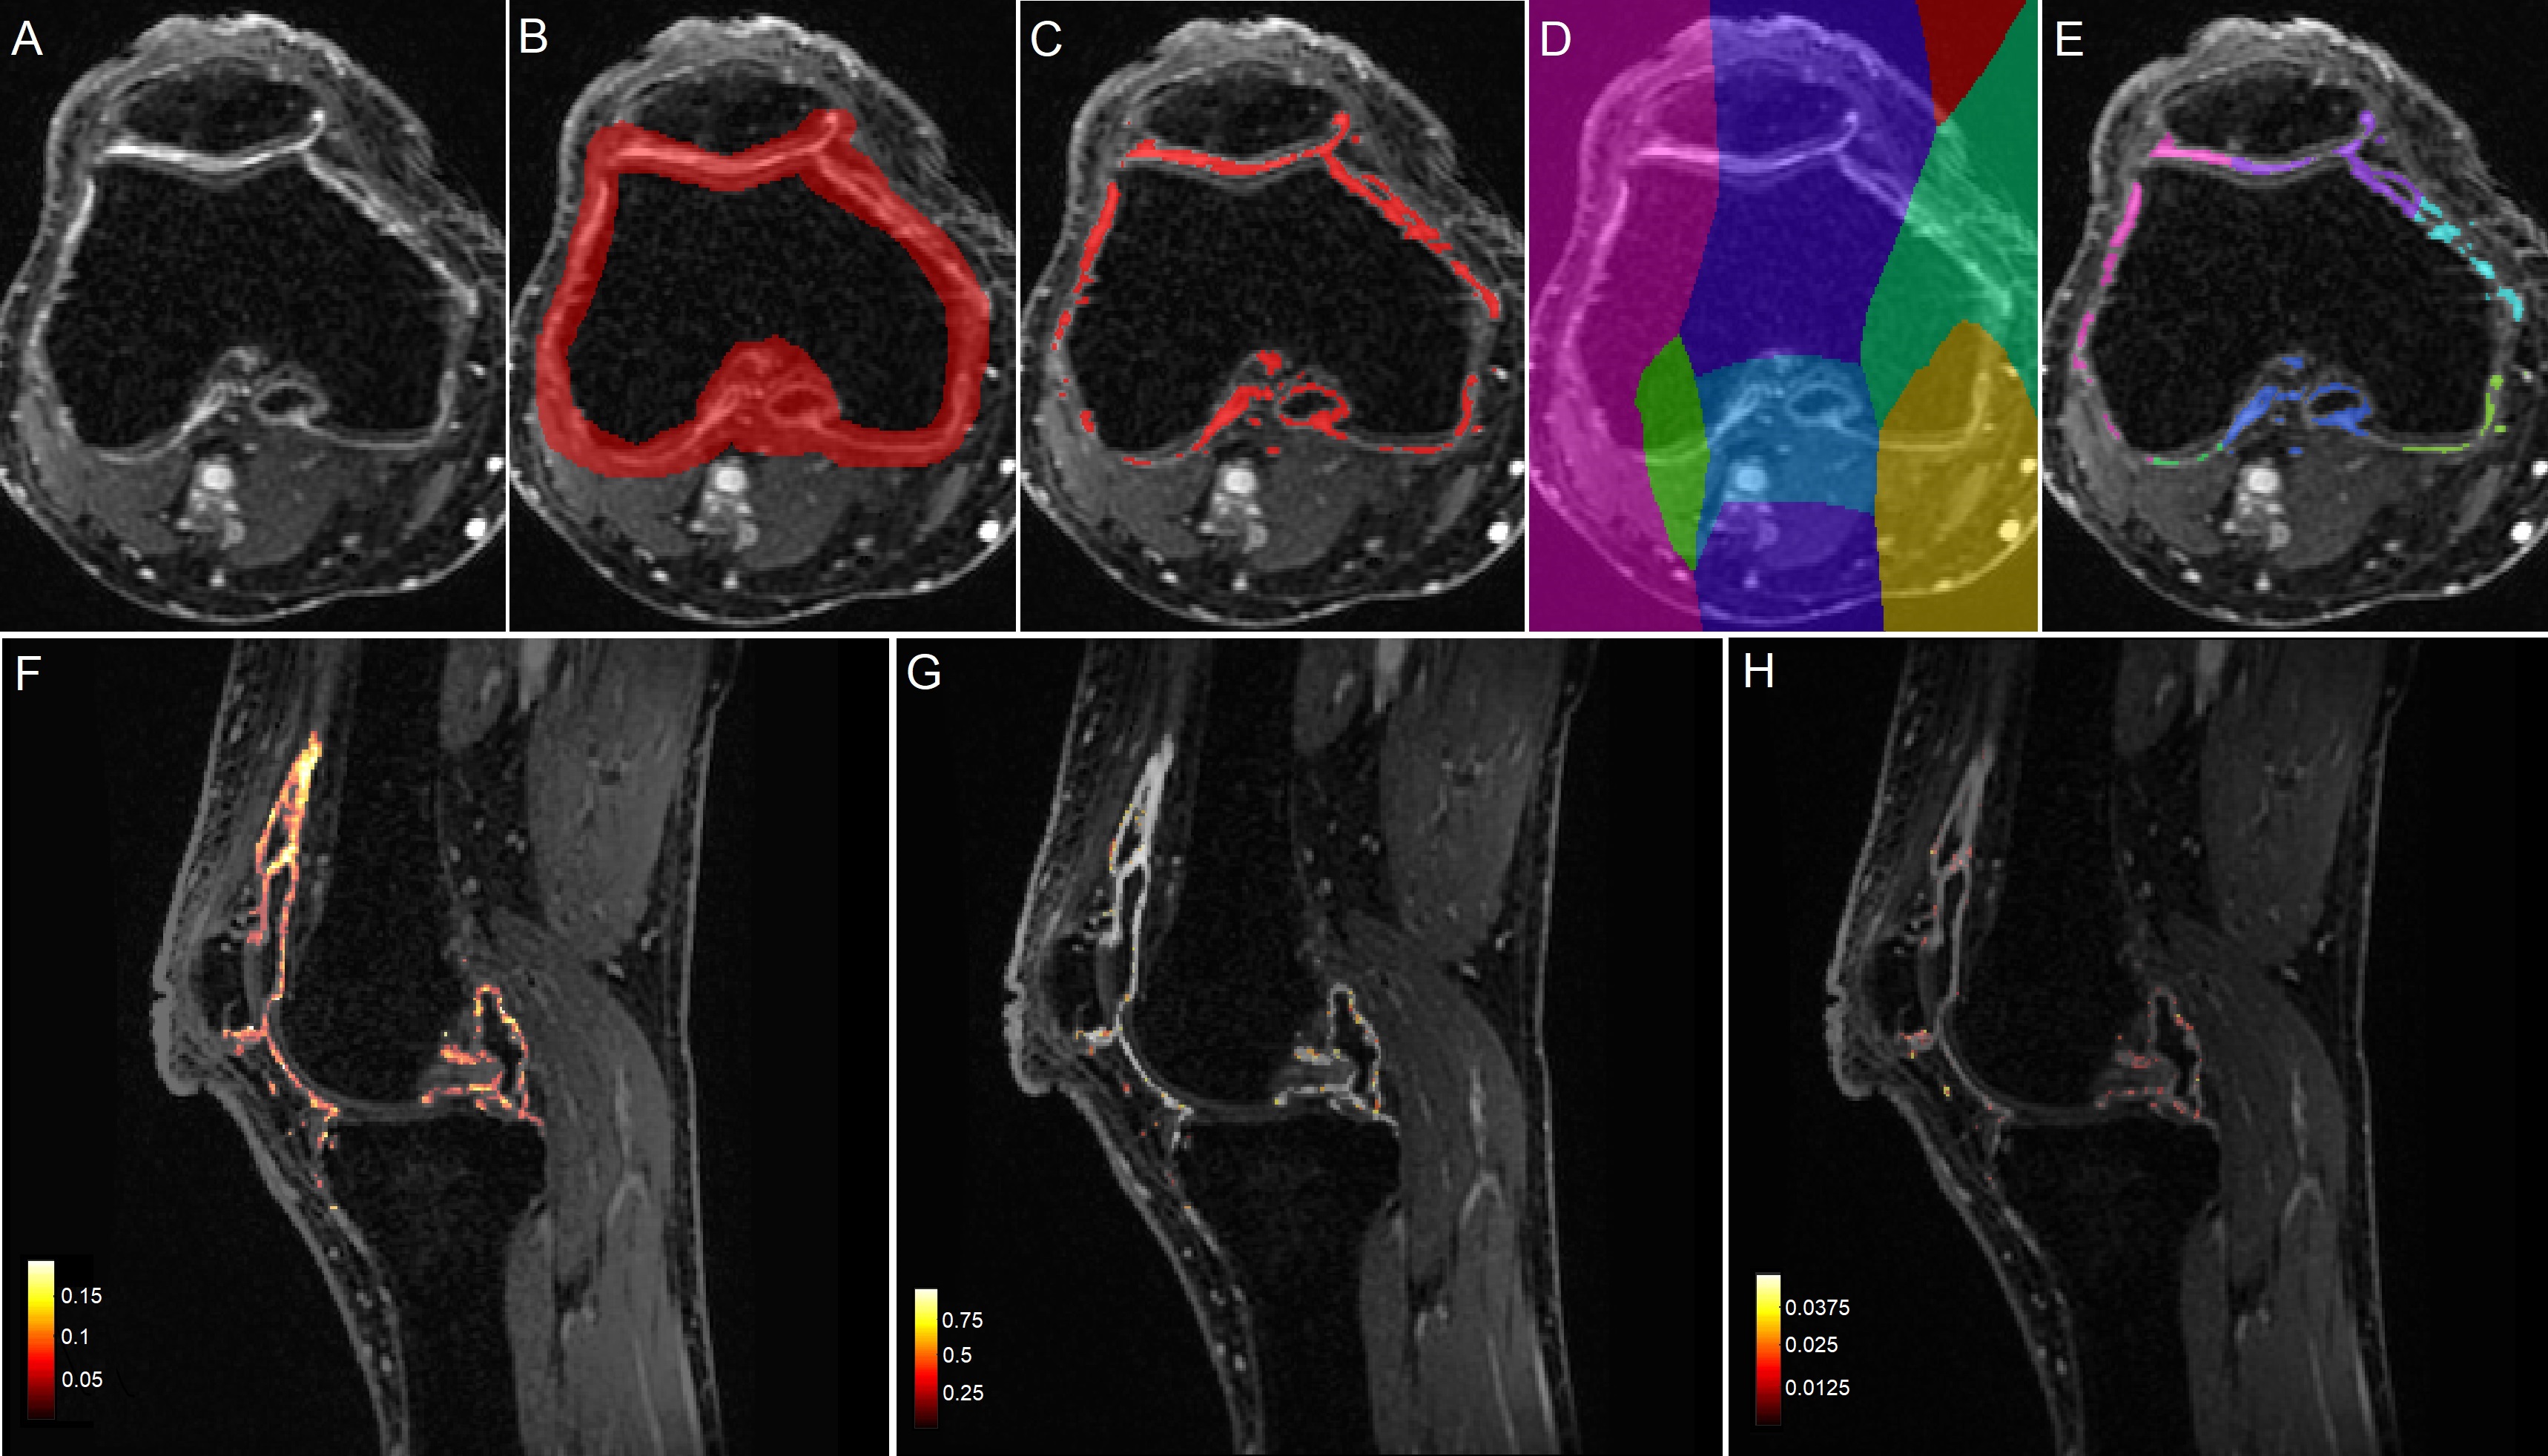
Figure 2. A: DCE-MRI image. B: Initial manual segmentation of the synovium. C: Whole synovium segmentation made by shuffle transform of B. D: Distance map after semi-automatic vessel mapping. E: Final synovial subregion segmentations through intersection of C and D. F: Ktrans map of the synovium in sagittal direction. G: ve map. H: vp map.
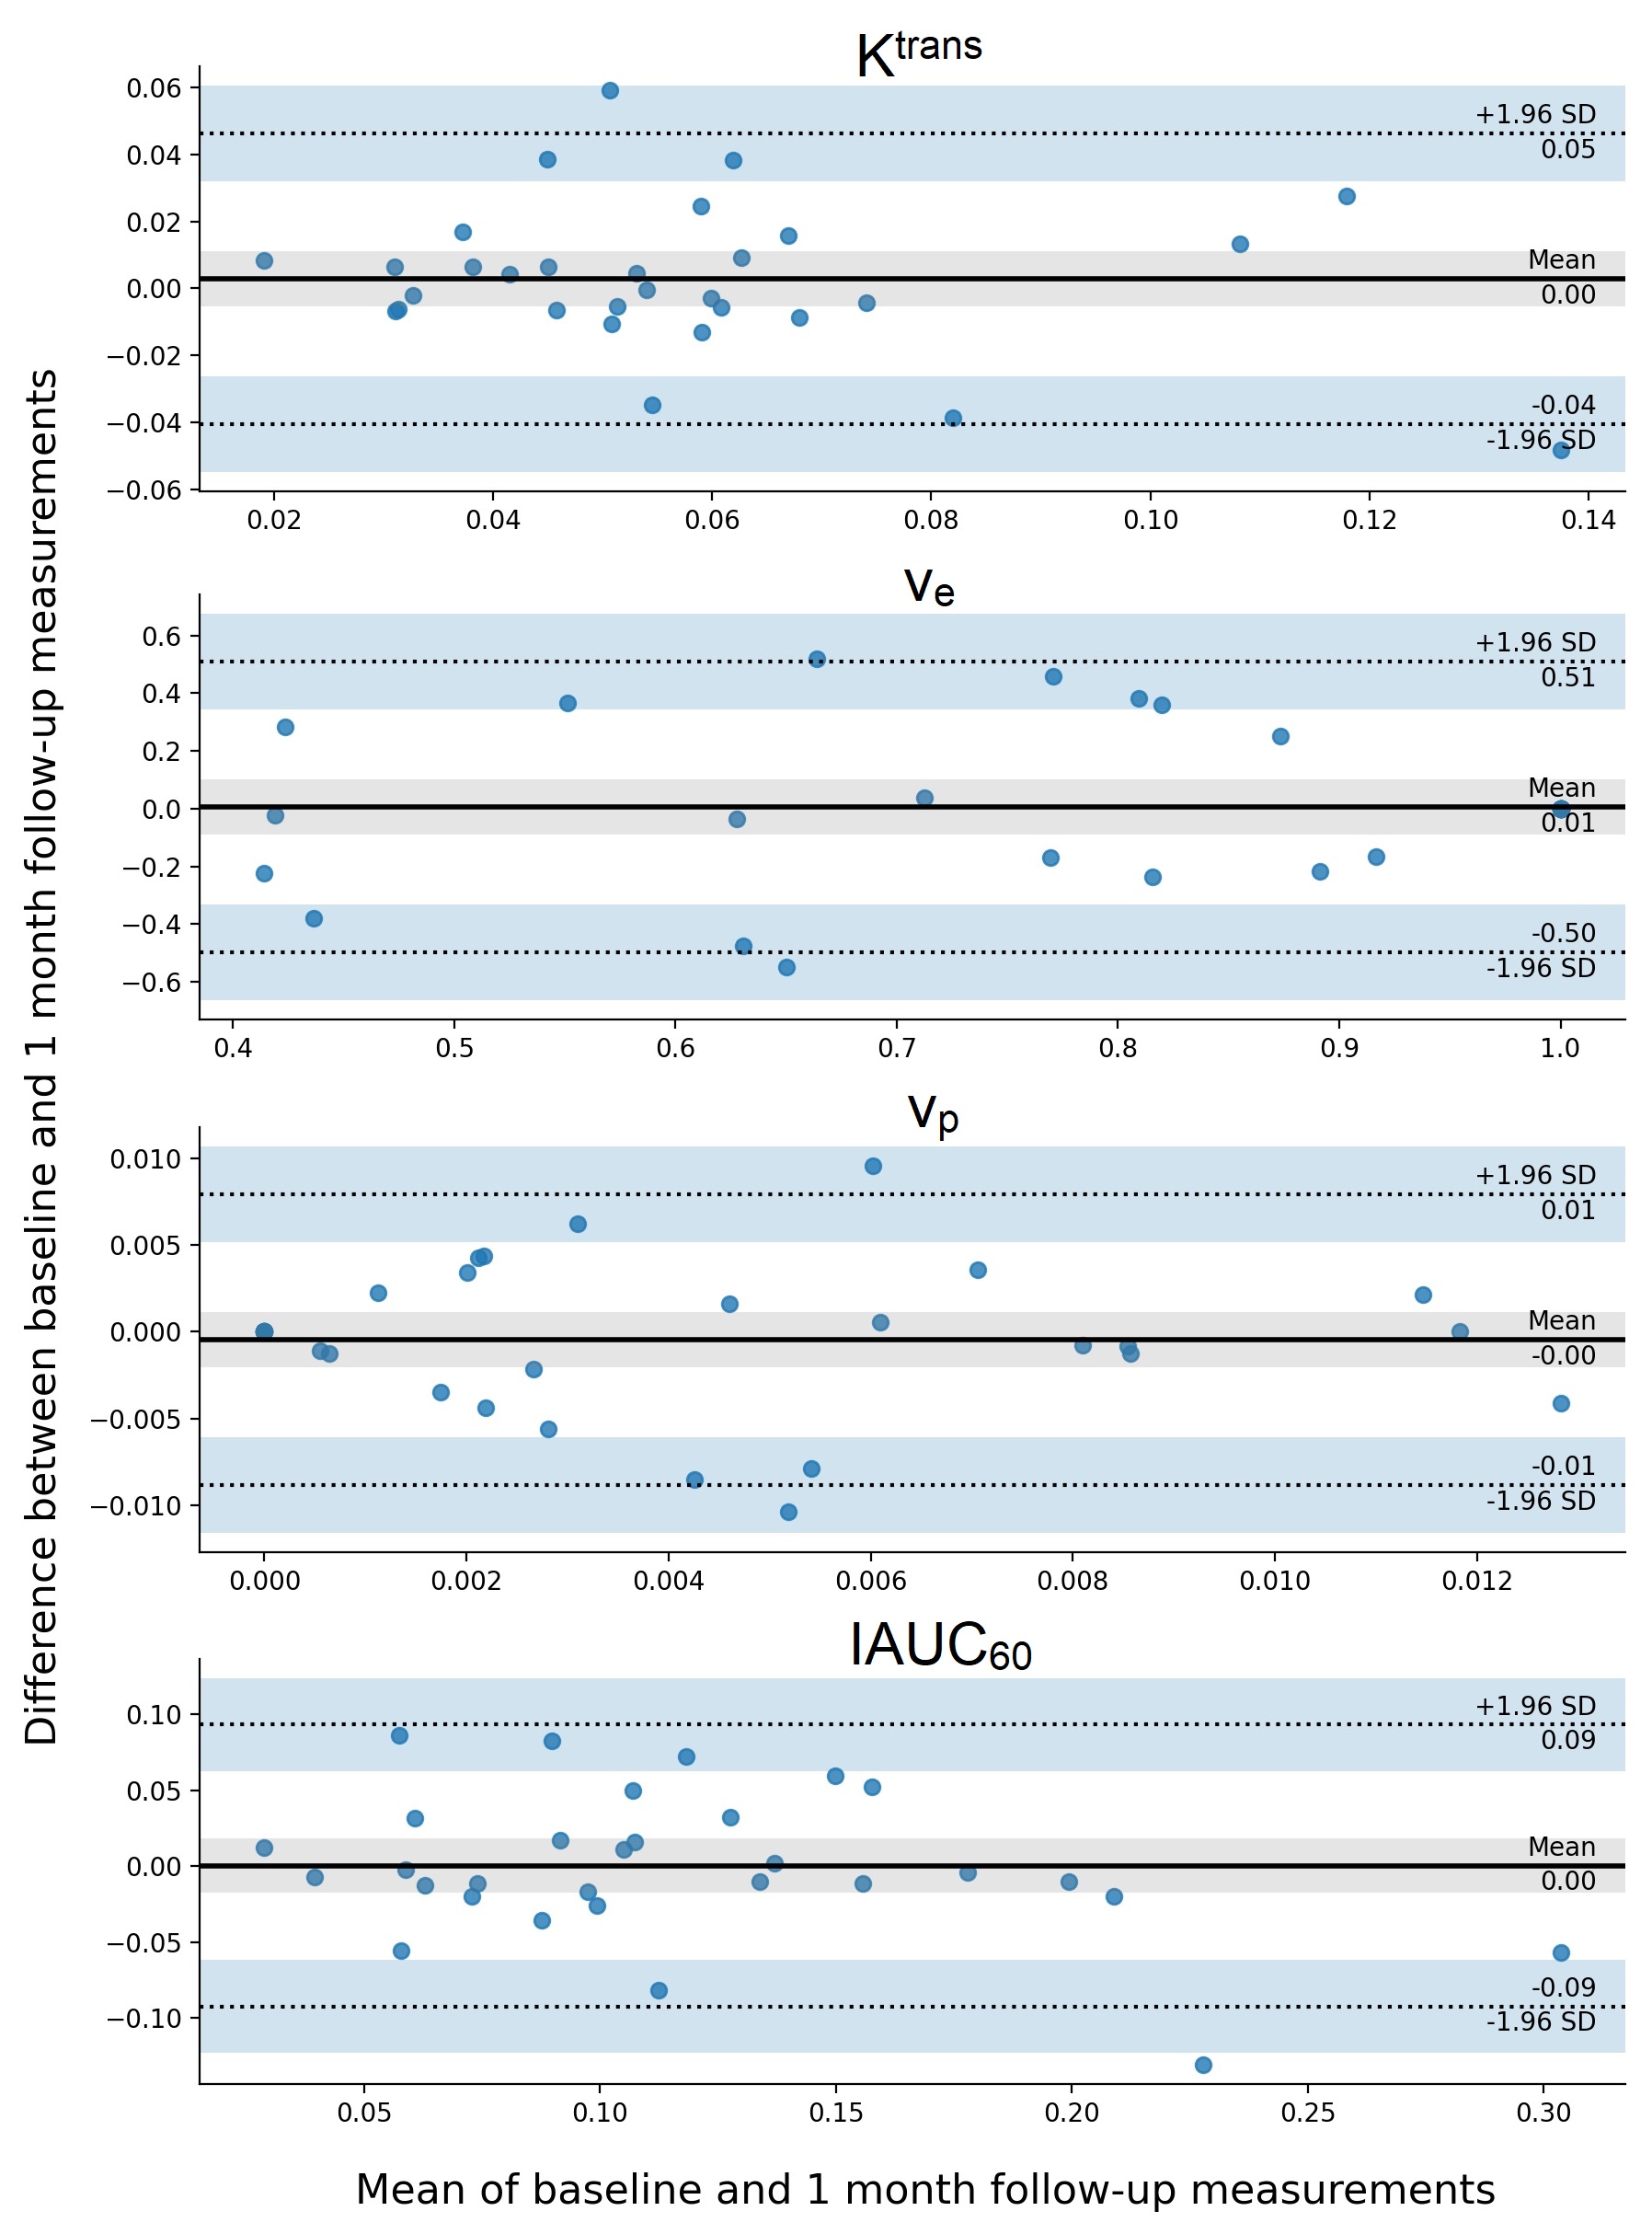
Figure 3. Bland-Altman plots for DCE-MRI biomarkers.
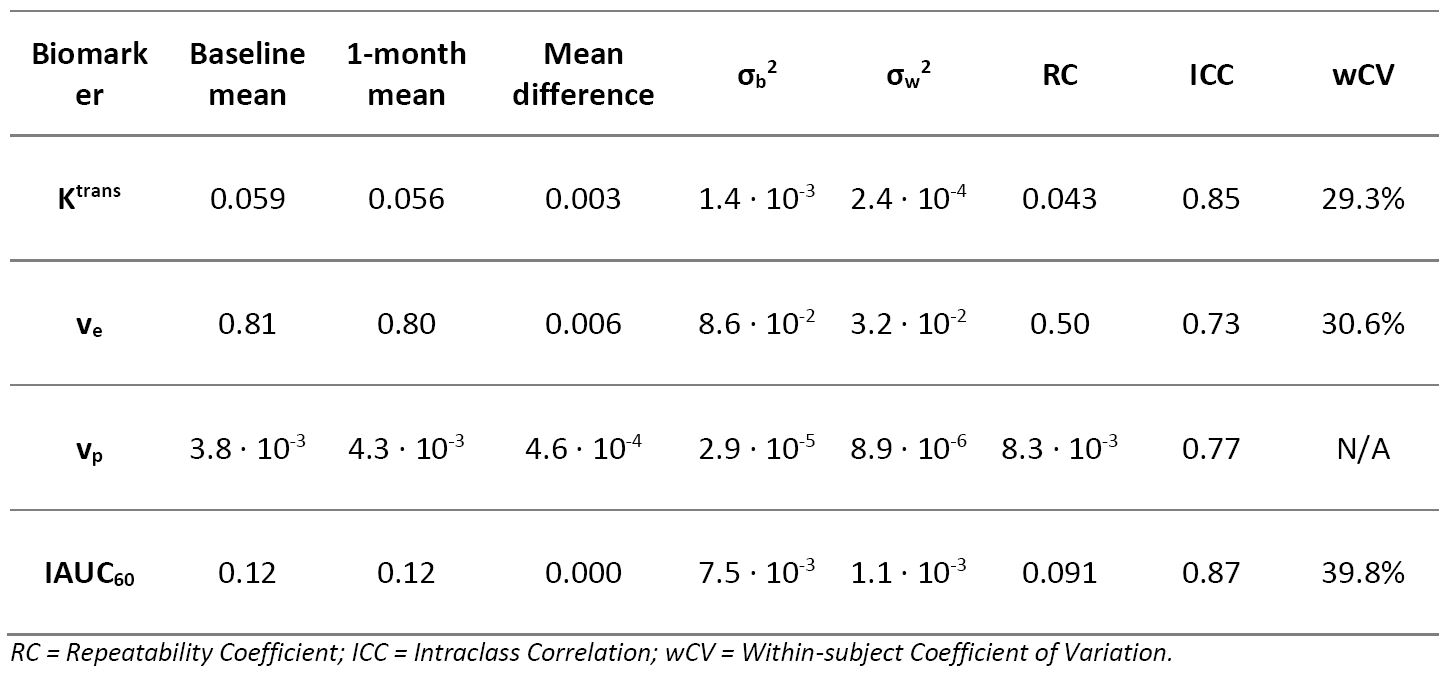
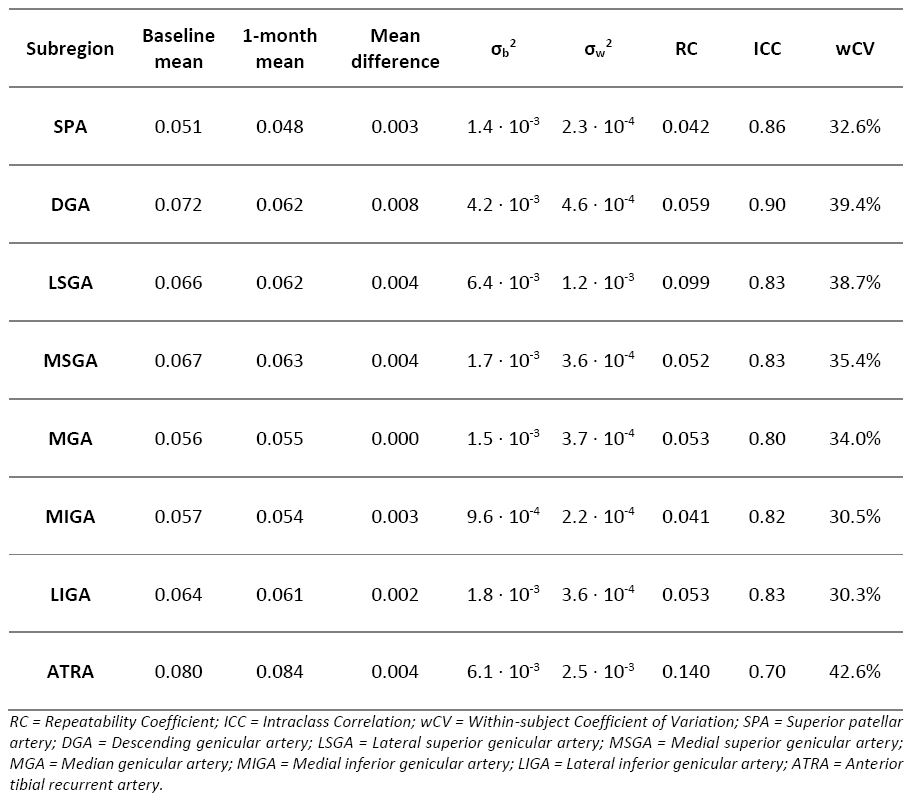
Figure 5. Test-retest statistics for DCE-MRI biomarker Ktrans in synovial subregions based on feeding arteries in patients with knee osteoarthritis.