0773
Joint Embolization: Feasibility of Targeted Treatment and Response Assessment in the Shoulder, Hip and Knee Using Dynamic Contrast-Enhanced MRI1Radiology, Stanford University, Palo Alto, CA, United States, 2Rheumatology, Weill Cornell Medical College, New York, NY, United States
Synopsis
Keywords: Osteoarthritis, Perfusion, Embolization
Motivation: Embolization, a new treatment for chronic joint pain, may be more clinically effective when treatment is targeted using pre-procedural dynamic contrast-enhanced (DCE)-MRI.
Goal(s): Assess presence of synovitis and identify culprit arterial vessels using pre-procedural DCE-MRI.
Approach: Representative patients with mild-moderate osteoarthritis of the shoulder, hip and knee underwent fat-suppressed DCE-MRI using CDT-VIBE. Imaging was performed with high temporal (6-7 sec/frame) and spatial (0.6 mm isotropic interpolated) resolution with 3-minute acquisition and 5cc/sec contrast injection.
Results: DCE-MRI readily identifies regions of synovitis and its contributory arterial vessels. By exploiting contrast kinetics whole-joint synovial volumes can be semi-automatically calculated.
Impact: MRI-targeted joint embolization therapy has the potential to result in improved pain and functional outcomes with reduced side effects. Rapid calculation of whole-joint synovial volumes may enable their use as a biomarker of arthritis severity and embolization treatment response.
Introduction
Joint embolization is a novel treatment for chronic arthritis-related pain which targets synovitis1–4. The hypothesized mechanism of action involves ablation of synovial nociceptors and decreased whole-joint inflammation. Substantial evidence indicates that genicular embolization is both safe and effective, with pilot studies showing improvement in pain/function for at least two-years post-procedure. Accumulating evidence indicates embolization is also effective for chronic shoulder pain2, and pilot studies are investigating its efficacy in the hip5.Current clinical practice does not include pre-embolization imaging to assess the presence, location or severity of synovitis – which is minimal or absent in some patients. In this work, we hypothesize that pre-embolization whole-joint dynamic contrast-enhanced (DCE)-MRI will enable identification and localization of synovitis in patients with chronic knee, hip and shoulder pain. DCE-MRI data will permit targeting of embolization therapy to vessels contributing to synovitis, as well as measurement of whole-joint synovial volumes to serve as biomarkers of arthritis severity and embolization treatment response.
Methods
Representative patient data has been drawn from an IRB-approved study of MRI-targeted joint embolization in the knee, hip and shoulder. 40 patients with mild-moderate arthritis of each joint (120 total) are being recruited to undergo add-on DCE-MRI after clinically-ordered non-contrast MRI. Inclusion/exclusion criteria have been defined and will be reported in future work. Patients with demonstrable synovitis are invited to undergo targeted embolization therapy, followed by post-procedure DCE-MRI at 3- and 12-months. To date only one patient has been treated with embolization.Post-enrollment DCE-MRI exams were performed on a 3T Siemens scanner using CDT-VIBE6 with joint-specifc 18-ch knee, 16-ch shoulder or 18-ch torso-plus-spine coils. Single-dose gadobenate dimeglumine was administered via 20G-IV at 5cc/sec. Scans were prescribed using coronal slabs with FOV=200 mm, matrix=320x192 interpolated, slice thickness=1.2mm, slab thickness of 10-14 cm and scan time of ~3min. Temporal resolution/volume was ~6.5s for knee/shoulder and ~7.5s for hip.
Representative arterial-phase MIPs were generated to assess presence and location of synovitis. Dynamic data was processed off-line using Matlab (Mathworks, Natick MA). After slab-dimension zero-padding, spatial resolution was 0.6 mm isotropic. Area-under-curve (AUC) and time-to-arrival (TTA) volumes were calculated, with TTA defined as the temporal frame with maximum signal.
AUC volumes were visually inspected and thresholded on a sliding scale to include 90-95% of enhancing synovium. TTA volumes were thresholded just after peak-signal in large veins, which occurred after 12-14 frames (78-91s). Thresholded AUC/TTA volumes were multiplied element-wise to create binary segmentation masks. These were manually segmented in 3D-Slicer7 by a fellowship-trained MSK radiologist with 8-years of experience to remove residual unwanted signal. Resultant masks were used to calculate synovial volumes.
Results
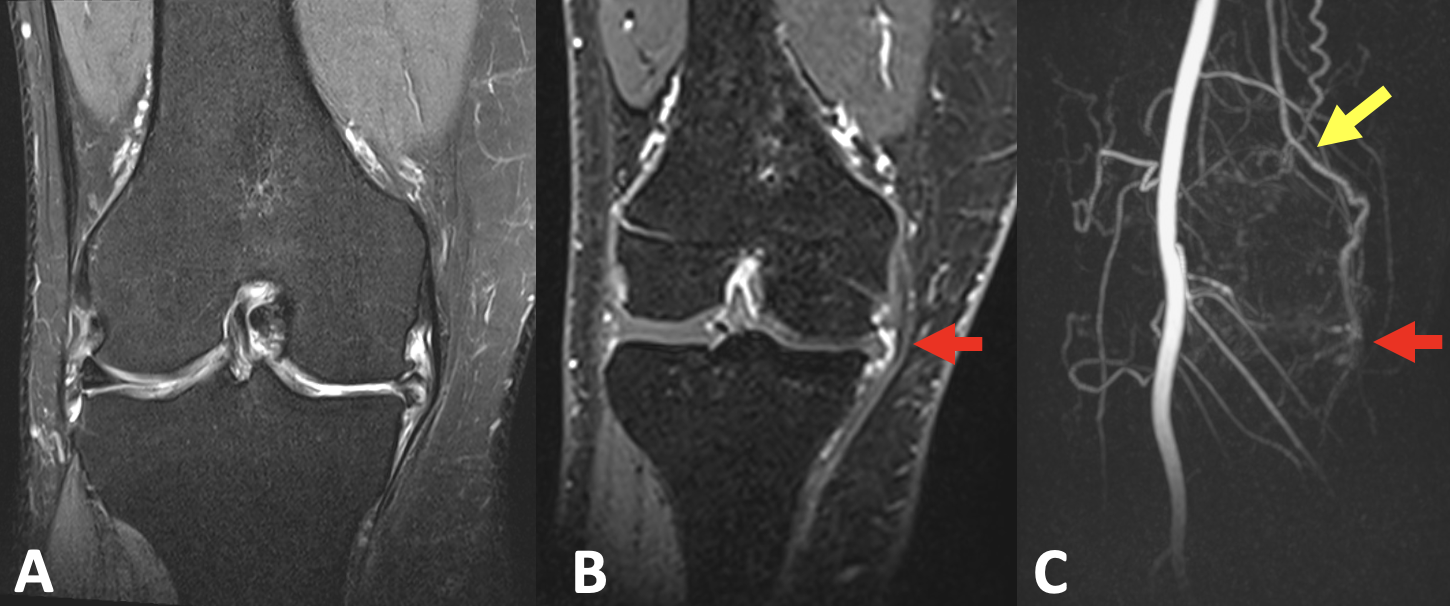
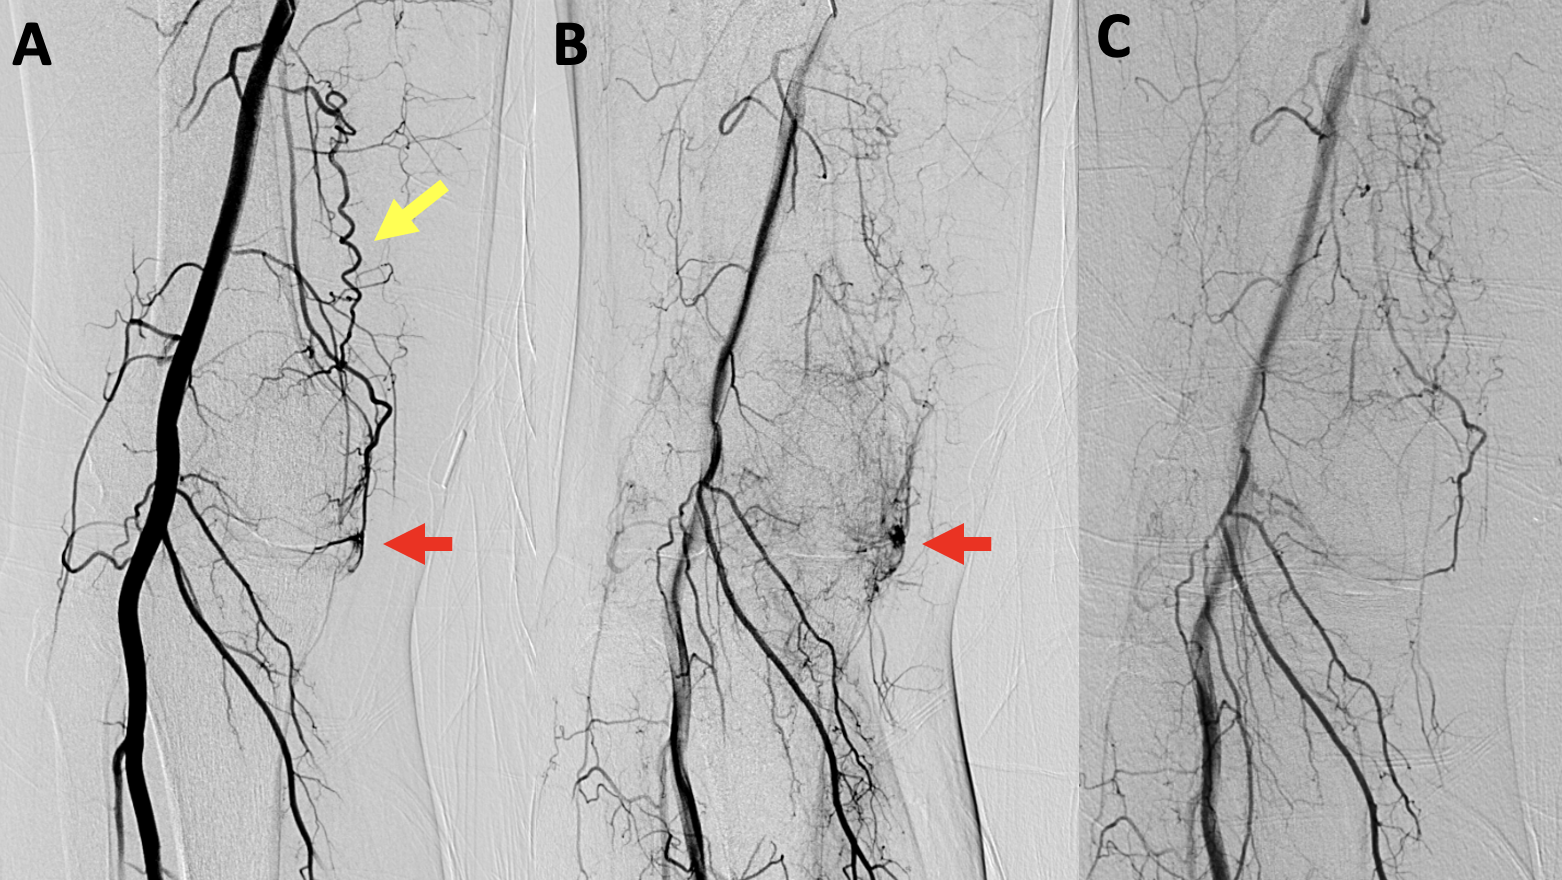
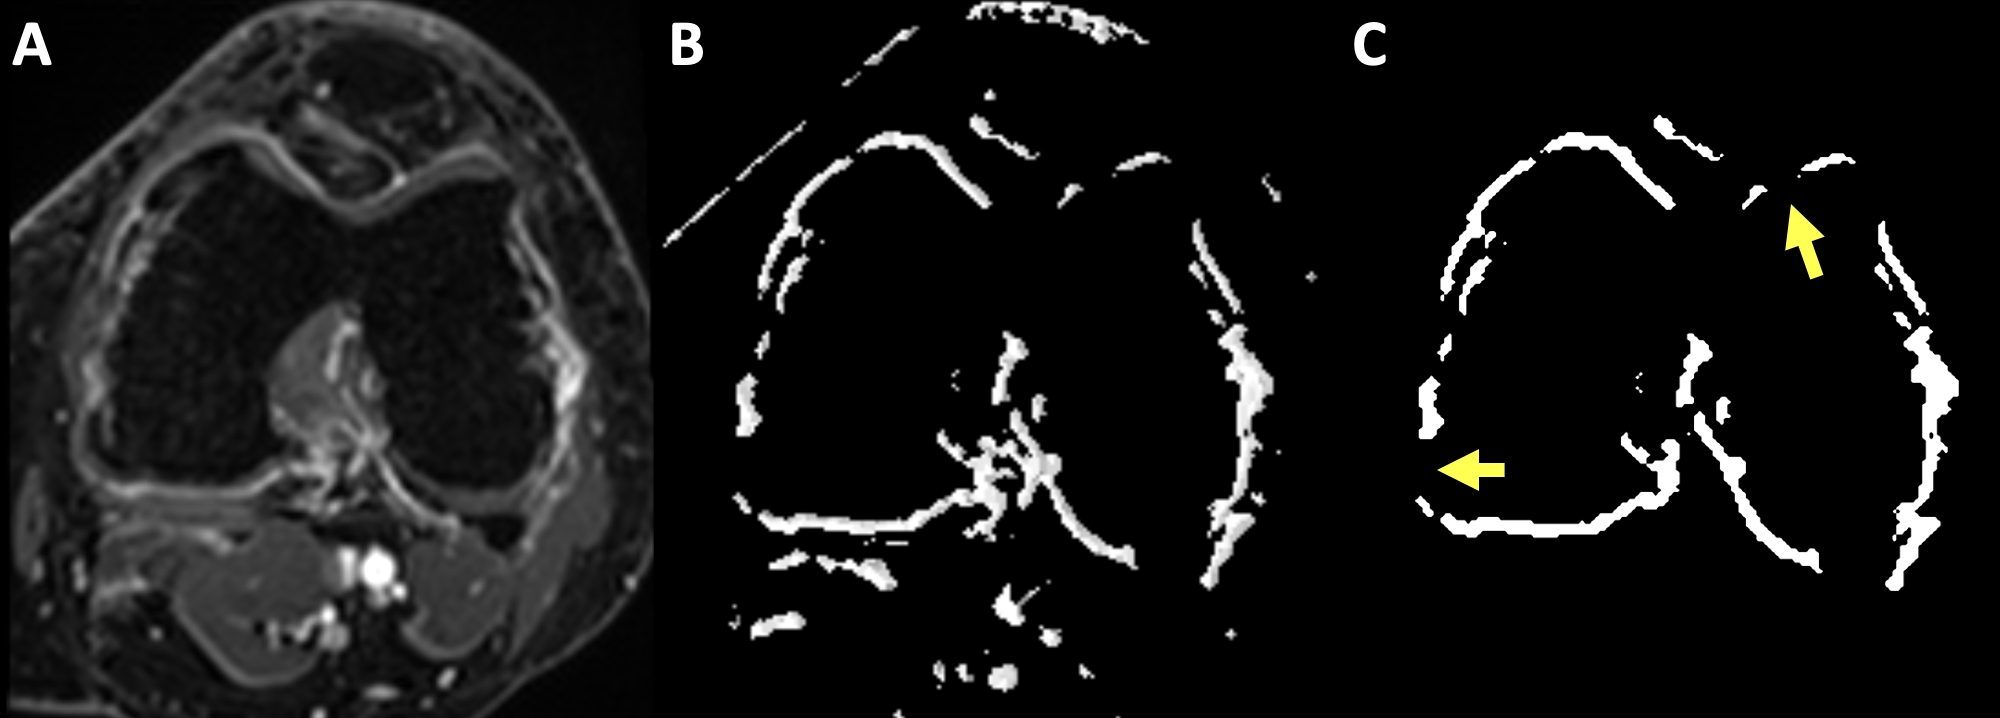
Images from a patient with moderate knee osteoarthritis are seen in Figure 1. Figure 1C shows an arterial-phase MIP with temporal resolution 6.5s depicting focal synovitis along the medial joint line, which is perfused by the descending genicular artery (DGA). This patient underwent targeted DGA embolization. Intra- and post-procedural angiographic images are shown in Figure 2, which demonstrate resolution of the focal synovitis after treatment.Figure 3 shows representative images from the calculated AUC volume, semi-automated and manually-refined segmentation masks in a different enrolled patient with knee arthritis. Manual segmentation only required fine refinement in the region posterior to the intercondylar notch and took approximately 15-minutes.
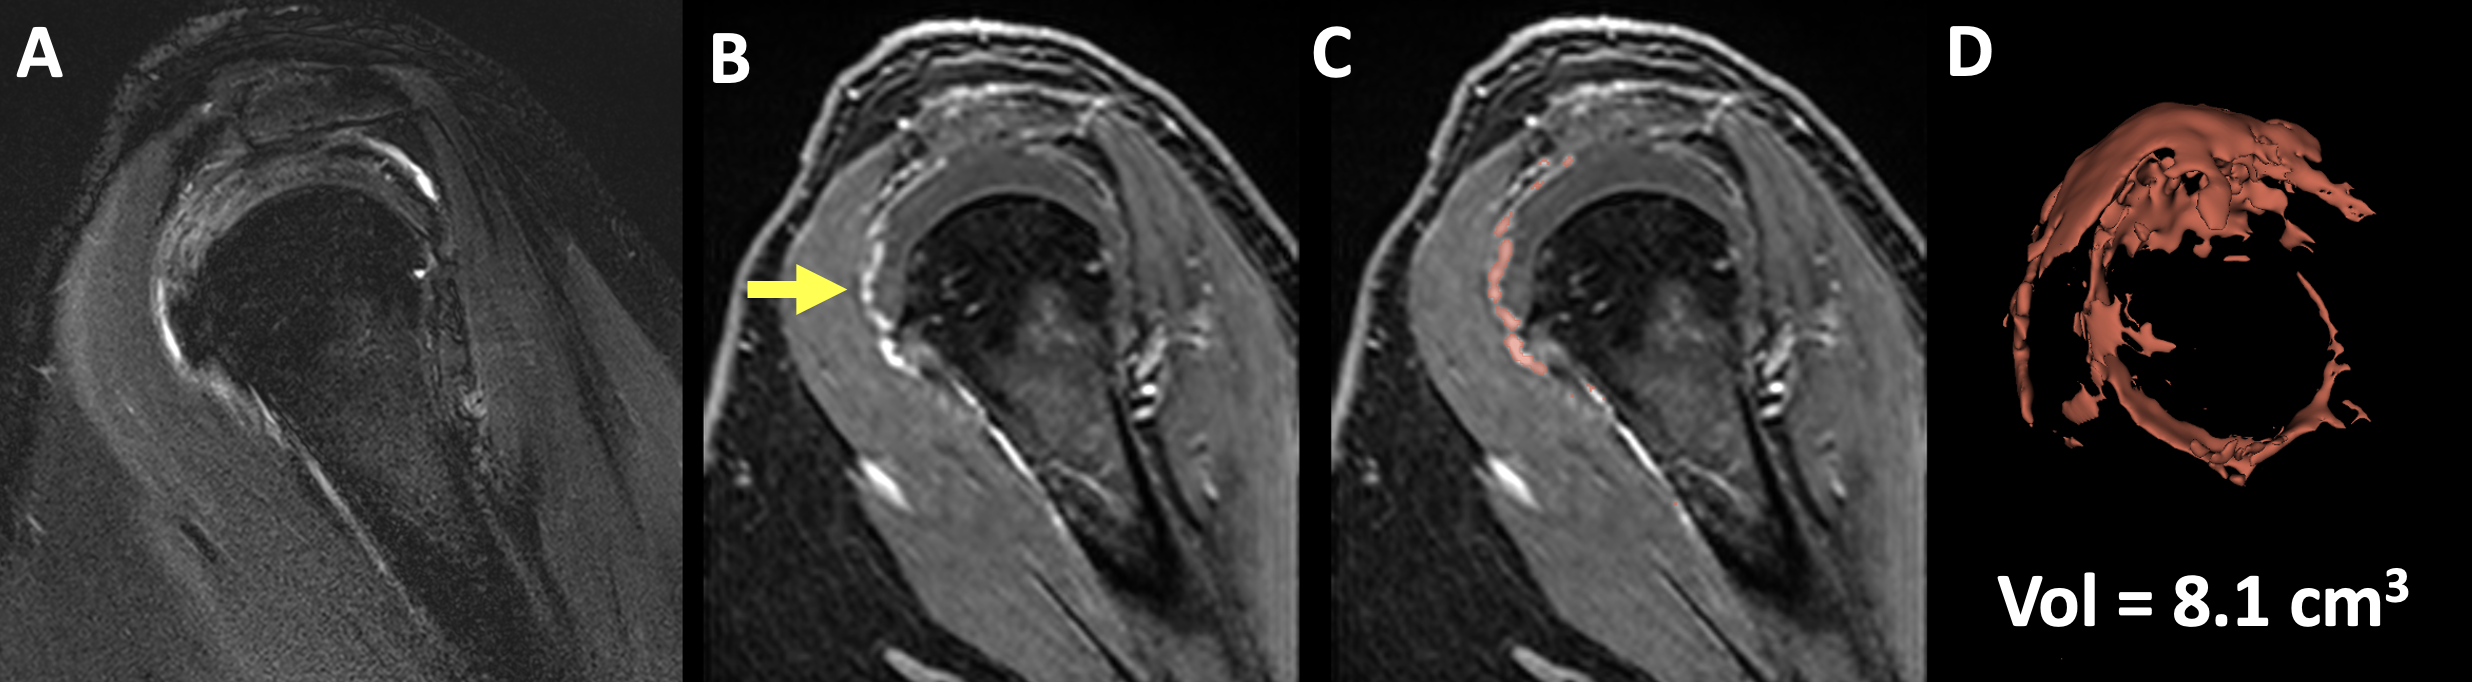
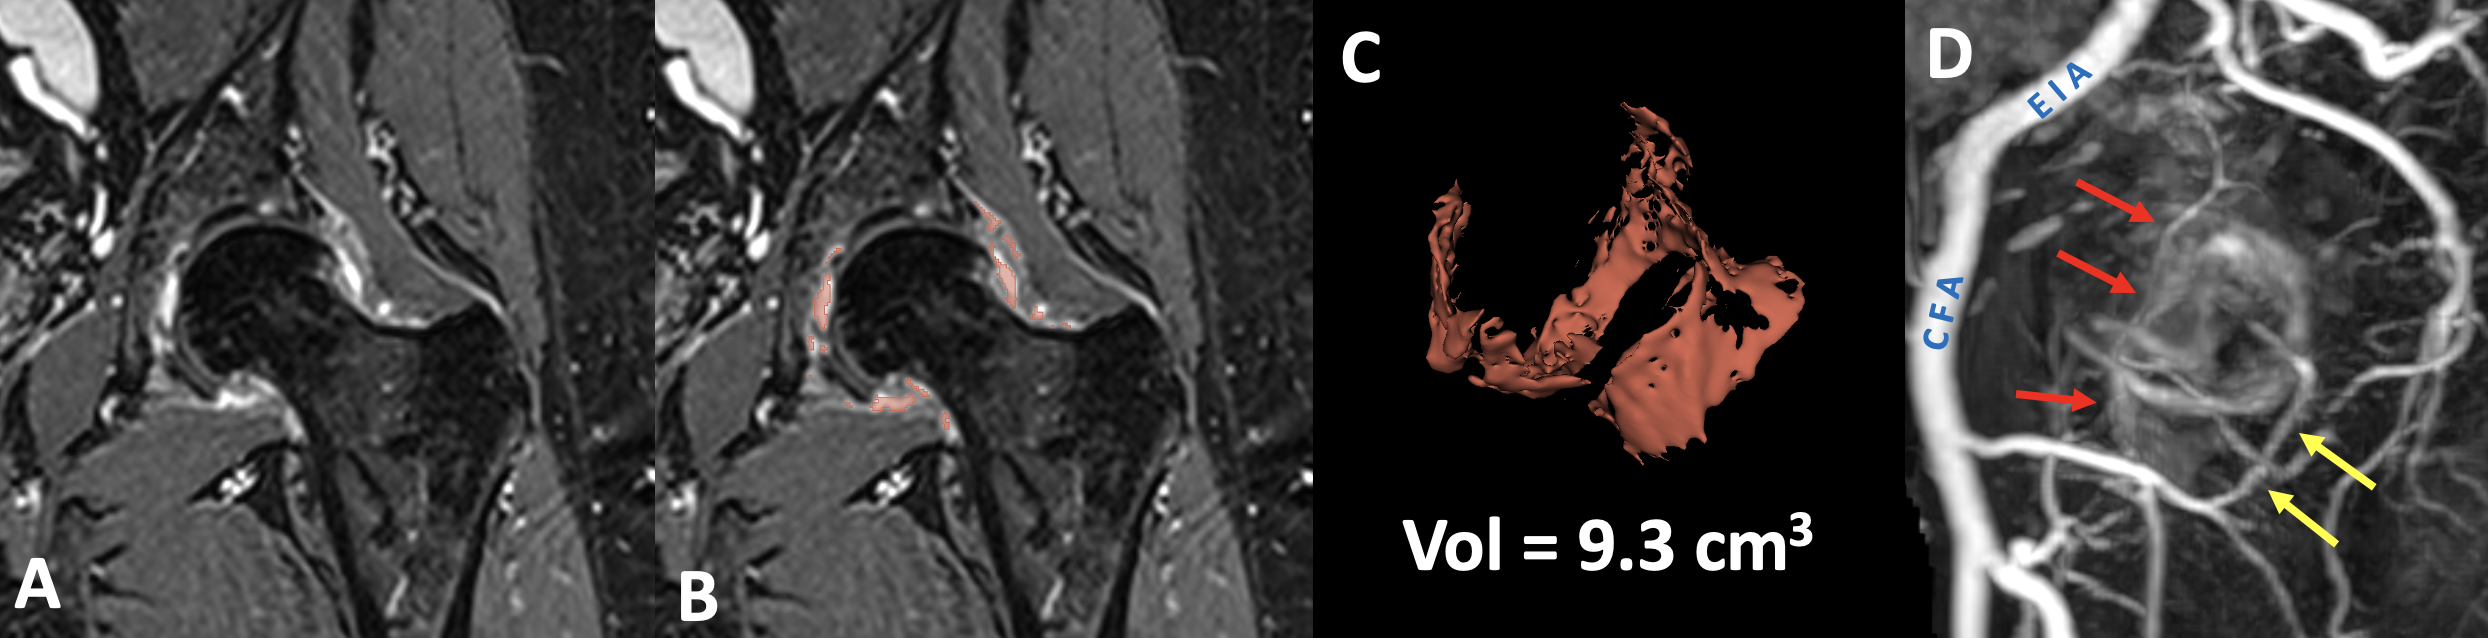
Figures 4 and 5 depict results of segmentation and synovial volume calculation in representative enrolled patients with mild shoulder and hip arthritis, respectively.
Discussion and Conclusions
Results from our study demonstrate the feasibility of using whole-joint DCE-MRI data for identification and targeting of synovitis during embolization. This has the potential to streamline clinical availability of embolization by both reducing procedural length and excluding patients who will not benefit from the procedure. Targeted therapy may also reduce treatment side effects.By exploiting contrast kinetics, semi-automated synovial segmentation can be achieved and is sufficiently fast (10-15 min/joint) to be clinically feasible. While synovial segmentation using DCE-MR data has been reported in the knee8, to our knowledge dynamic data has not been previously utilized in this way. Further, because contrast is secreted into joint fluid as soon as 5-6 min after injection9, AUC volumes used for segmentation (containing 3-min of averaged dynamic data) are substantially more optimal for synovial volume measurements compared to delayed post-contrast data. Our segmentation process remains limited by being only semi-automated, requiring manual tweaking by a trained radiologist to ensure accuracy.
Future work will involve continued recruitment of patients into our clinical study of embolization. Enrolled patients complete joint-specific surveys of pain/function and undergo T2/ΔT1 mapping of cartilage before/after embolization. Synovial segmentation maps could also be utilized to train neural-networks for automated segmentation.
Acknowledgements
We acknowledge funding for this study from Varian.References
1. Okuno Y, Iwamoto W, Matsumura N, et al.
Clinical Outcomes of Transcatheter Arterial Embolization for Adhesive
Capsulitis Resistant to Conservative Treatment. J Vasc Interv Radiol
2017;28(2):161-167.e1.
2. Sajan A, Bagla S, Isaacson A. A Review of
Musculoskeletal Embolization to Treat Pain Outside of the Knee. Semin Intervent
Rad [Internet] 2021;38(05):515–7. Available from: https://pubmed.ncbi.nlm.nih.gov/34853496/
3. Bagla S, Piechowiak R, Sajan A, Orlando J,
Hartman T, Isaacson A. Multicenter Randomized Sham Controlled Study of
Genicular Artery Embolization for Knee Pain Secondary to Osteoarthritis. J Vasc
Interv Radiol 2022 Jan;33(1):2-10.e2.
4. Okuno Y, Korchi AM, Shinjo T, Kato S,
Kaneko T. Midterm Clinical Outcomes and MR Imaging Changes after Transcatheter
Arterial Embolization as a Treatment for Mild to Moderate Radiographic Knee
Osteoarthritis Resistant to Conservative Treatment. J Vasc Interv Radiol
2017;28(7):995–1002.
5. Correa MP, Puton RC, Saleh JN, et al.
Short-term follow-up of embolization of hip synovitis. CVIR Endovascular
2020;3(1):35.
6. Othman AE, Martirosian P, Schraml C, et
al. Feasibility of CAIPIRINHA-Dixon-TWIST-VIBE for dynamic contrast-enhanced
MRI of the prostate. Eur J Radiol 2015;84(11):2110–6.
7. Kikinis R, Pieper SD, Vosburgh KG.
Intraoperative Imaging and Image-Guided Therapy. 2013;277–89.
8. MacKay JW, Nezhad FS, Rifai T, et al.
Dynamic contrast-enhanced MRI of synovitis in knee osteoarthritis:
repeatability, discrimination and sensitivity to change in a prospective
experimental study. Eur Radiol 2021;31(8):5746–58
9. Poland D of R National Institute of Geriatrics, Rheumatology and Rehabilitation, Warsaw, Sudoł-Szopińska I, Poland IDD Warsaw Medical University, Warsaw, et al. Rheumatoid arthritis: what do MRI and ultrasound show. J Ultrason 2017;17(68):5–16.
Figures