0772
Ripple Artifact Quantification in Slice Encoding for Metal Artifact Correction (SEMAC) using MR Bloch Simulation1Swiss Center for Musculoskeletal Imaging, Balgrist Campus AG, Zurich, Switzerland, 2Institute for Biomedical Engineering, ETH and University of Zurich, Zurich, Switzerland, 3Radiology Department, Balgrist University Hospital, University of Zurich, Zurich, Switzerland, 4Advanced Clinical Imaging Technology, Siemens Healthineers International AG, Zurich, Switzerland
Synopsis
Keywords: Other Musculoskeletal, Artifacts, Bloch Simulator, Metal Artifacts, Implant
Motivation: Commonly used methods for the quantification of metal-induced image artifacts, such as measuring the extent of signal voids, do not capture spatial frequencies of ripple artifacts, as seen in dedicated metal artifact reduction sequences including SEMAC or MAVRIC.
Goal(s): To propose a new method for the quantification of SEMAC ripple artifacts which may serve as quality metric for sequence optimizations.
Approach: We applied a k-space-based metric to MR Bloch simulations of SEMAC sequences with variable slice thicknesses and RF pulse shapes (time-bandwidth product, TBW).
Results: A trend towards higher absolute artifact intensity and lower spatial frequency can be observed for higher TBWs.
Impact: The proposed metal artifact metric extends current quantification methods by taking the spatial frequency distribution of ripple artifacts into account. This may serve as a basis for metal artifact reduction sequence optimization, with a particular focus on RF pulse parameters.
Introduction
Dedicated metal artifact reduction sequences such as Slice Encoding for Metal Artifact Correction1 (SEMAC) and Multi-Acquisition with Variable-Resonance Image Combination2,3 (MAVRIC) are commonly employed for reducing metal-induced imaging artifacts including signal pile-ups, signal voids, and through-slice displacements. However, the drawback of these techniques are additional ripples in the vicinity of the implant4 which are a result of sub-optimal combination of spectral profiles2 and which render the diagnosis very challenging. In general, metal-induced artifacts are commonly quantified by measuring the extent of the affected area5, without taking spatial frequencies into account.The objective of this work is to propose a k-space-based metric for the classification and description of SEMAC ripple artifacts for sequence optimization. MR Bloch simulations which incorporate metal-induced off-resonance frequency distributions from a metallic hip implant6 were used to investigate image artifacts, including the analysis of their spatial frequencies. The artifact metrics were evaluated on a simulated set of SEMAC sequences with varying slice thicknesses and RF-shapes (time-bandwidth products, TBW) and compared to an image-based error metric.
Methods
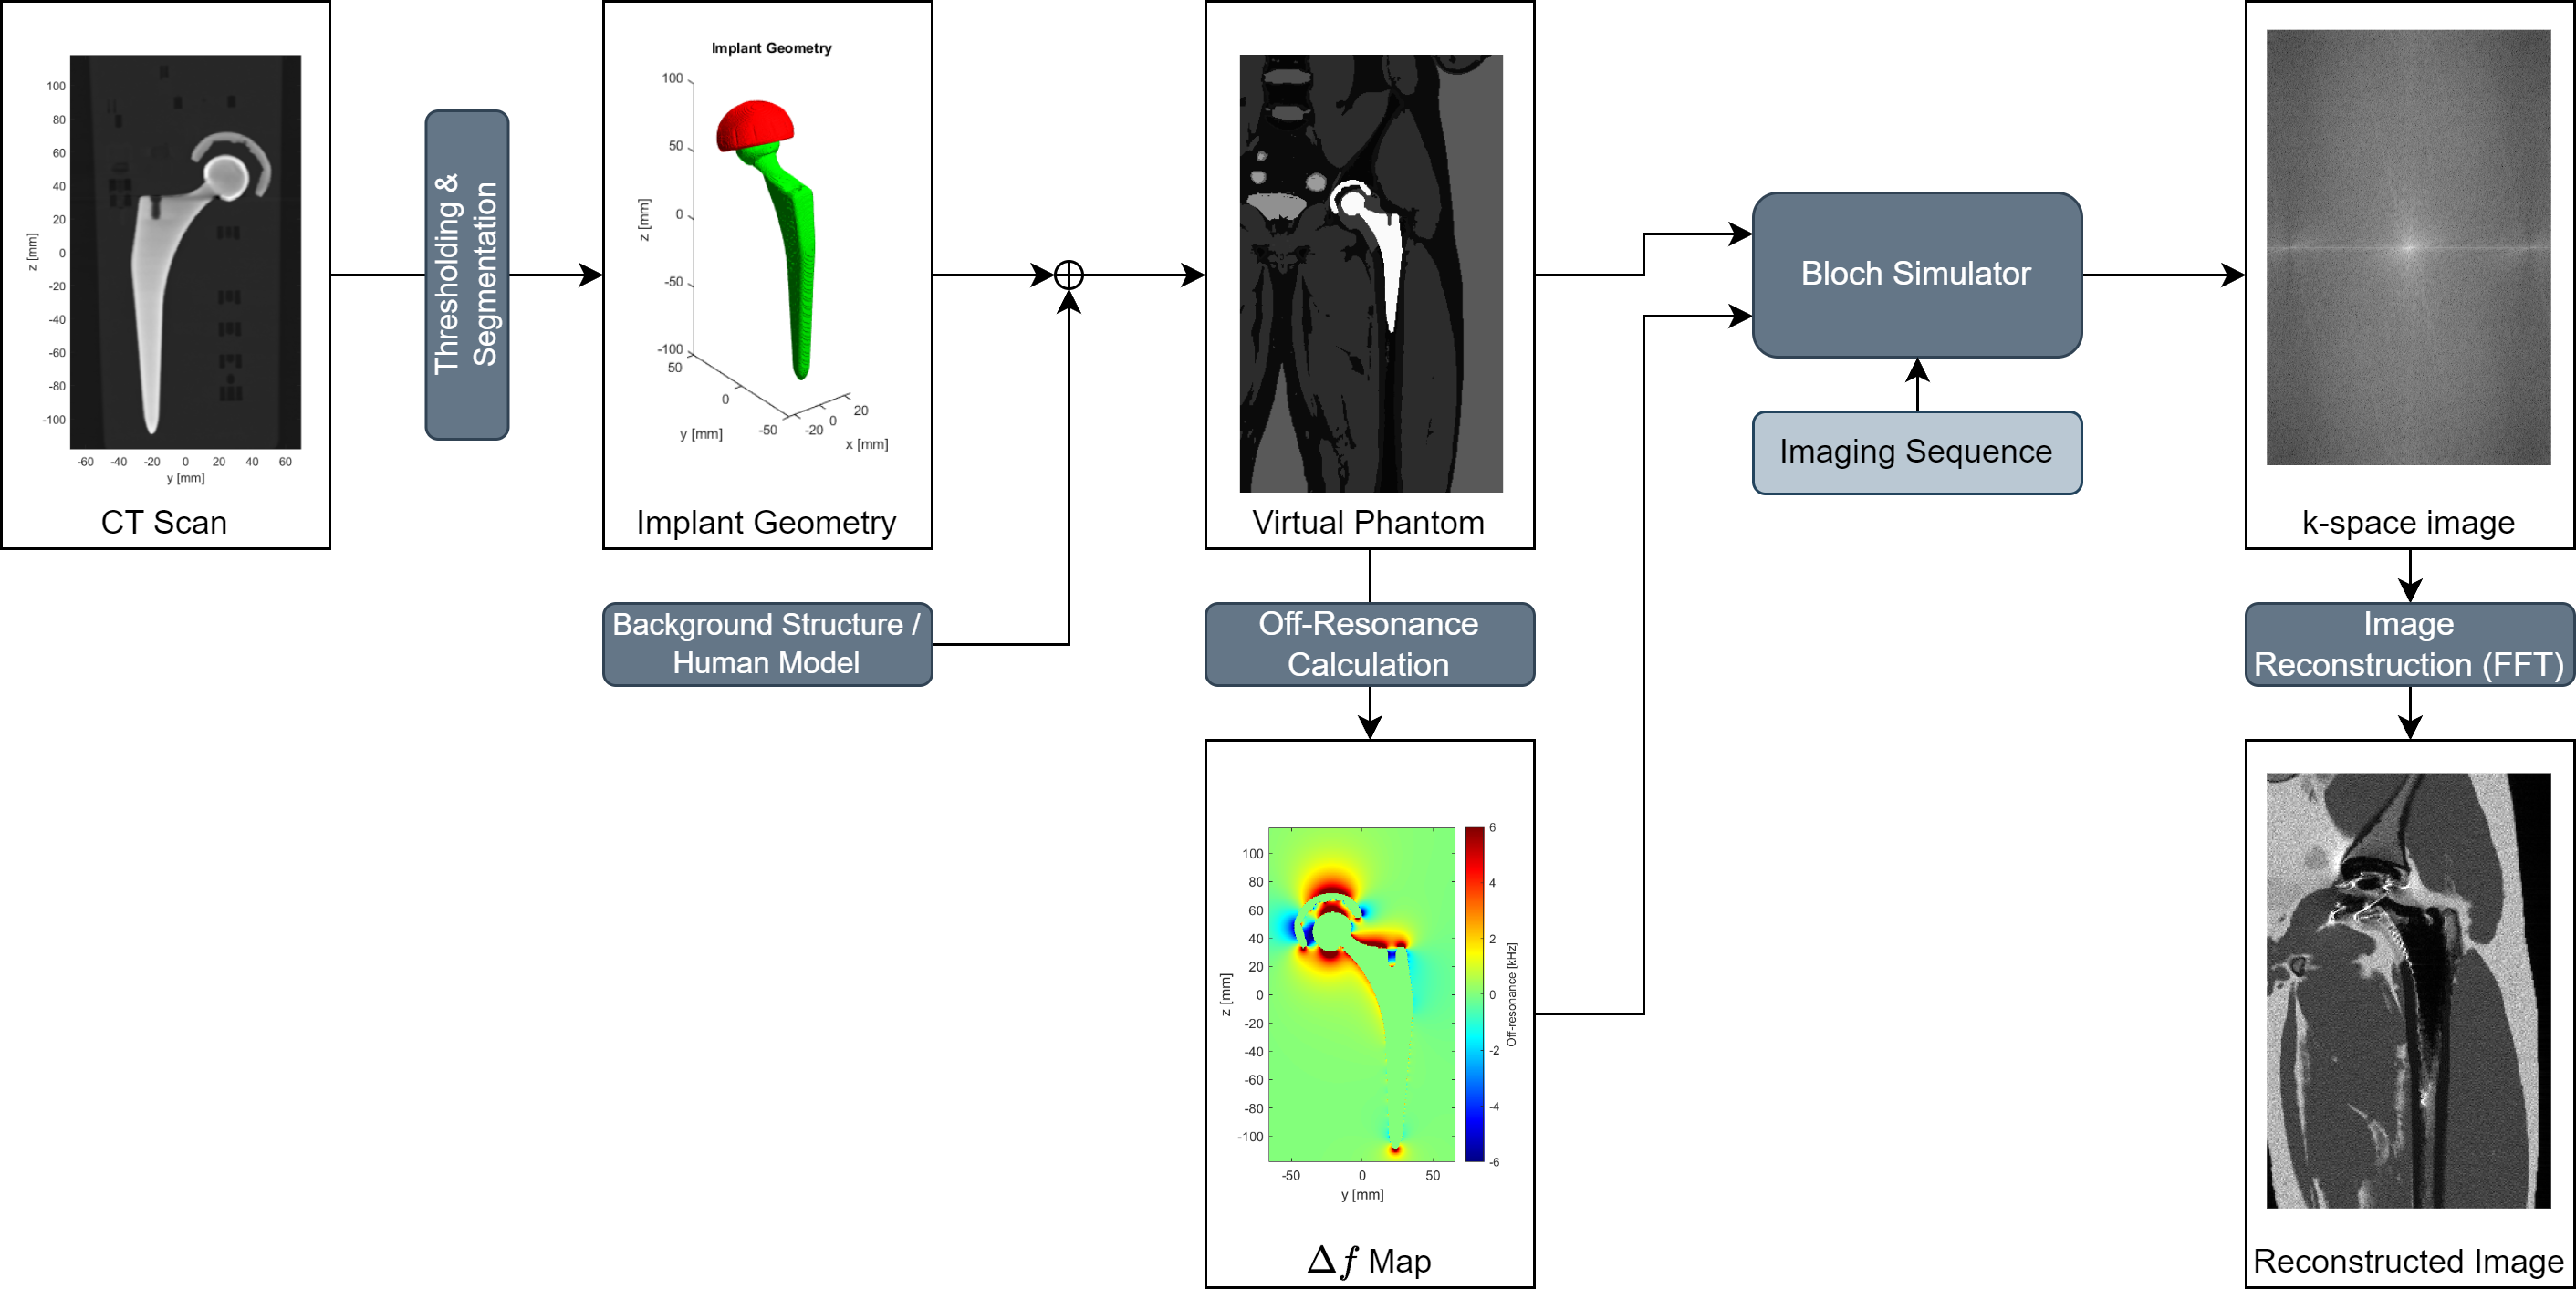
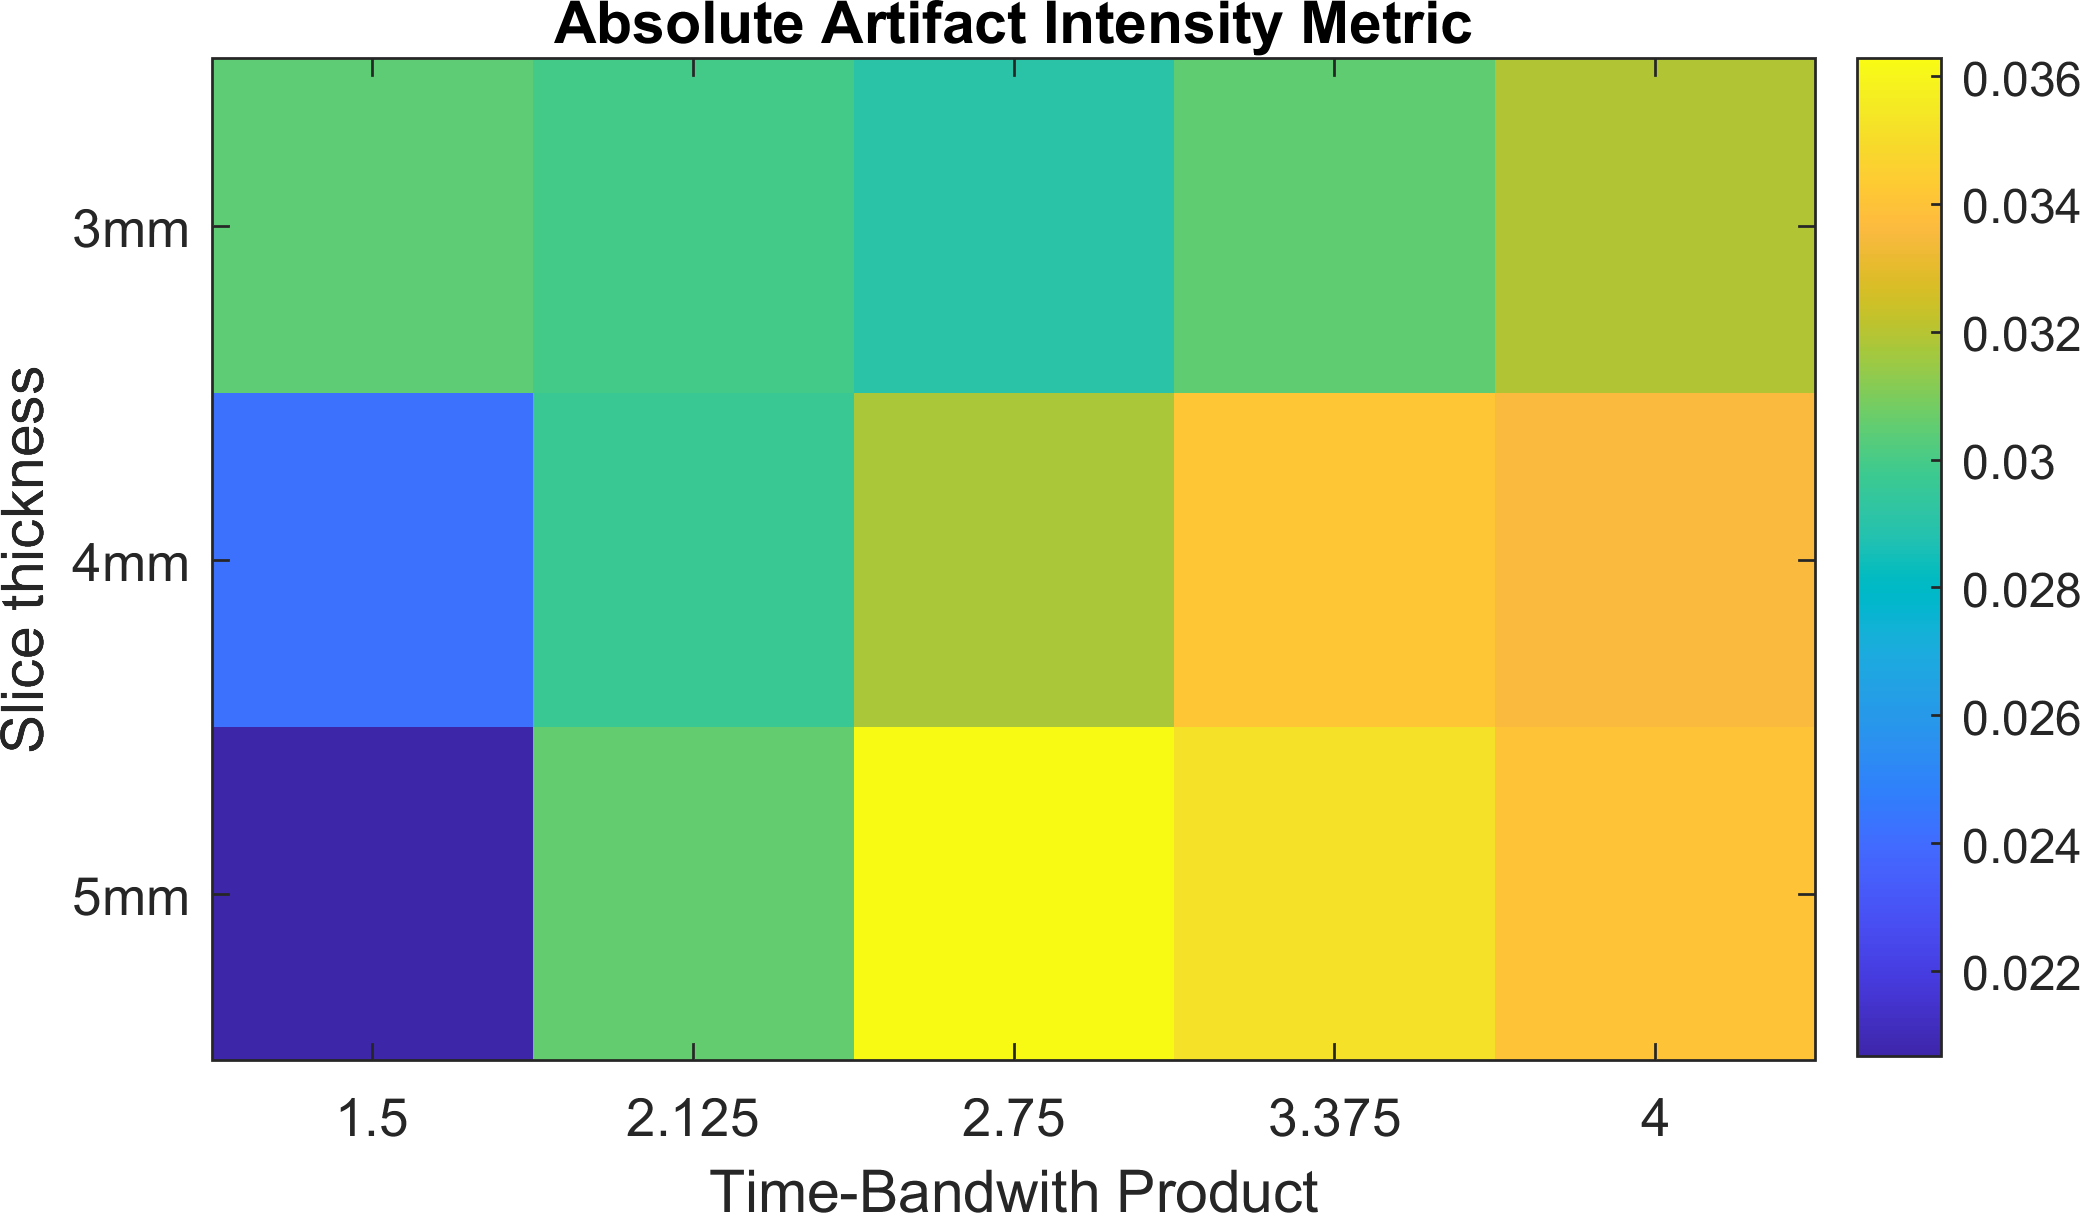
The SEMAC simulations with an anatomical model7 including a full hip replacement were performed with a simulation framework presented in Figure 1 (submitted as abstract #20188). Briefly, the metal-induced main field inhomogeneity distribution was computed based on a CT-derived implant geometry and a titanium-cobalt alloy was assigned for the implant material. Gradient and RF waveforms were exported from the "Protocol Offline Editing Tool" of the vendor’s pulse programming framework (Siemens Healthineers AG, Erlangen, Germany). The imaging parameters read: TR/TE: 3000/41ms, readout bandwidth: 434Hz/Pix, resolution: 1.25x1.25mm2, FOV: 160x510mm2, SEMAC encoding steps: 13, B0: 3.0T. To investigate the influence of the slice thickness and profile on ripple artifacts, SEMAC simulations were performed with thicknesses between 3mm and 5mm, and excitation and refocusing RF-bandwidths varying from 750Hz to 2kHz at a constant pulse length of 2ms (TBW: 1.5-4). Identical simulations were performed without $$$\Delta f$$$ as reference. We propose two metrics to quantify characteristics of SEMAC ripple artifacts, both of which require an image with metal-induced artifacts, $$$S(x,y)$$$, and a ground truth measurement without artifacts, $$$S_{gt}(x,y)$$$.First, we define an absolute artifact intensity metric in image space by taking the absolute difference between the two images over a region of interest (ROI) $$\text{d}(S,S_{gt}) := \sum_{(x,y)\in\text{ROI}}{|S(x,y)-S_{gt}(x,y)|}.$$
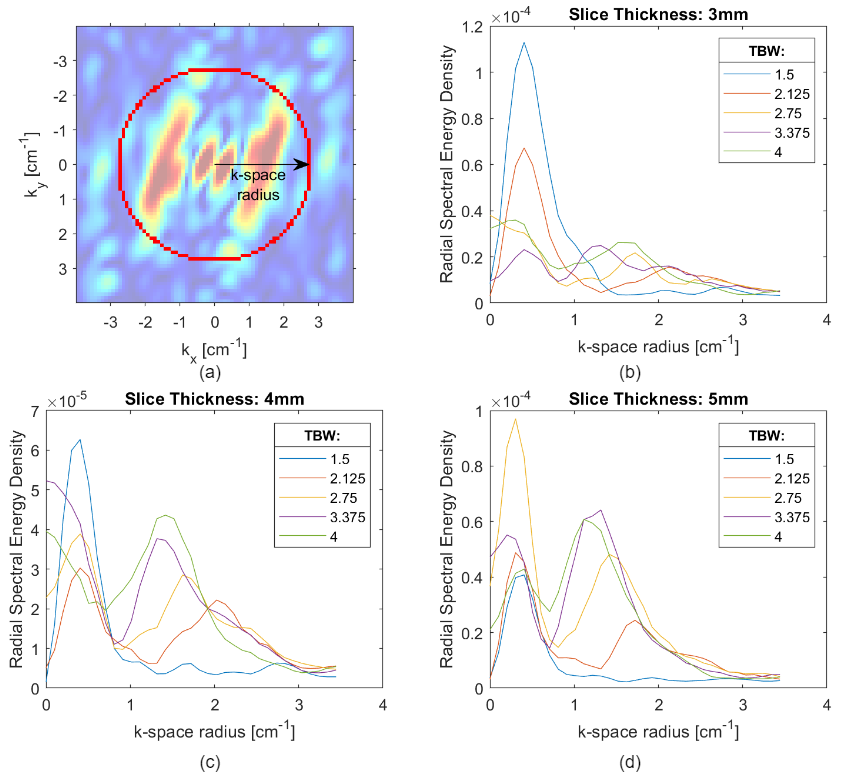
The second metric quantifies the energy contribution of different spatial frequencies by taking the discrete Fourier transform of both images and division of the $$$k$$$-space into annular bins of index $$$i$$$ $$R_i:=\left\{{(k_x,k_y)\mid{r_i}\le\sqrt{k_x^2+k_y^2}<{r_{i+1}}}\right\}.$$
Figure 4(a) displays an annular bin in $$$k$$$-space.
We define the radial spectral energy density (RSED) in k-space at the radius $$$r_i$$$ as the average spectral energy of the error signal over the corresponding bin $$E(S,S_{gt},r_i) :=\frac{1}{|R_i|}\sum_{(k_x,k_y)\in{R_i}}{\left|{\mathcal{F}[S](k_x,k_y)-\mathcal{F}[S_{gt}](k_x,k_y)}\right|^2},$$ where $$$\mathcal{F}$$$ denotes the Fourier transform.
Results
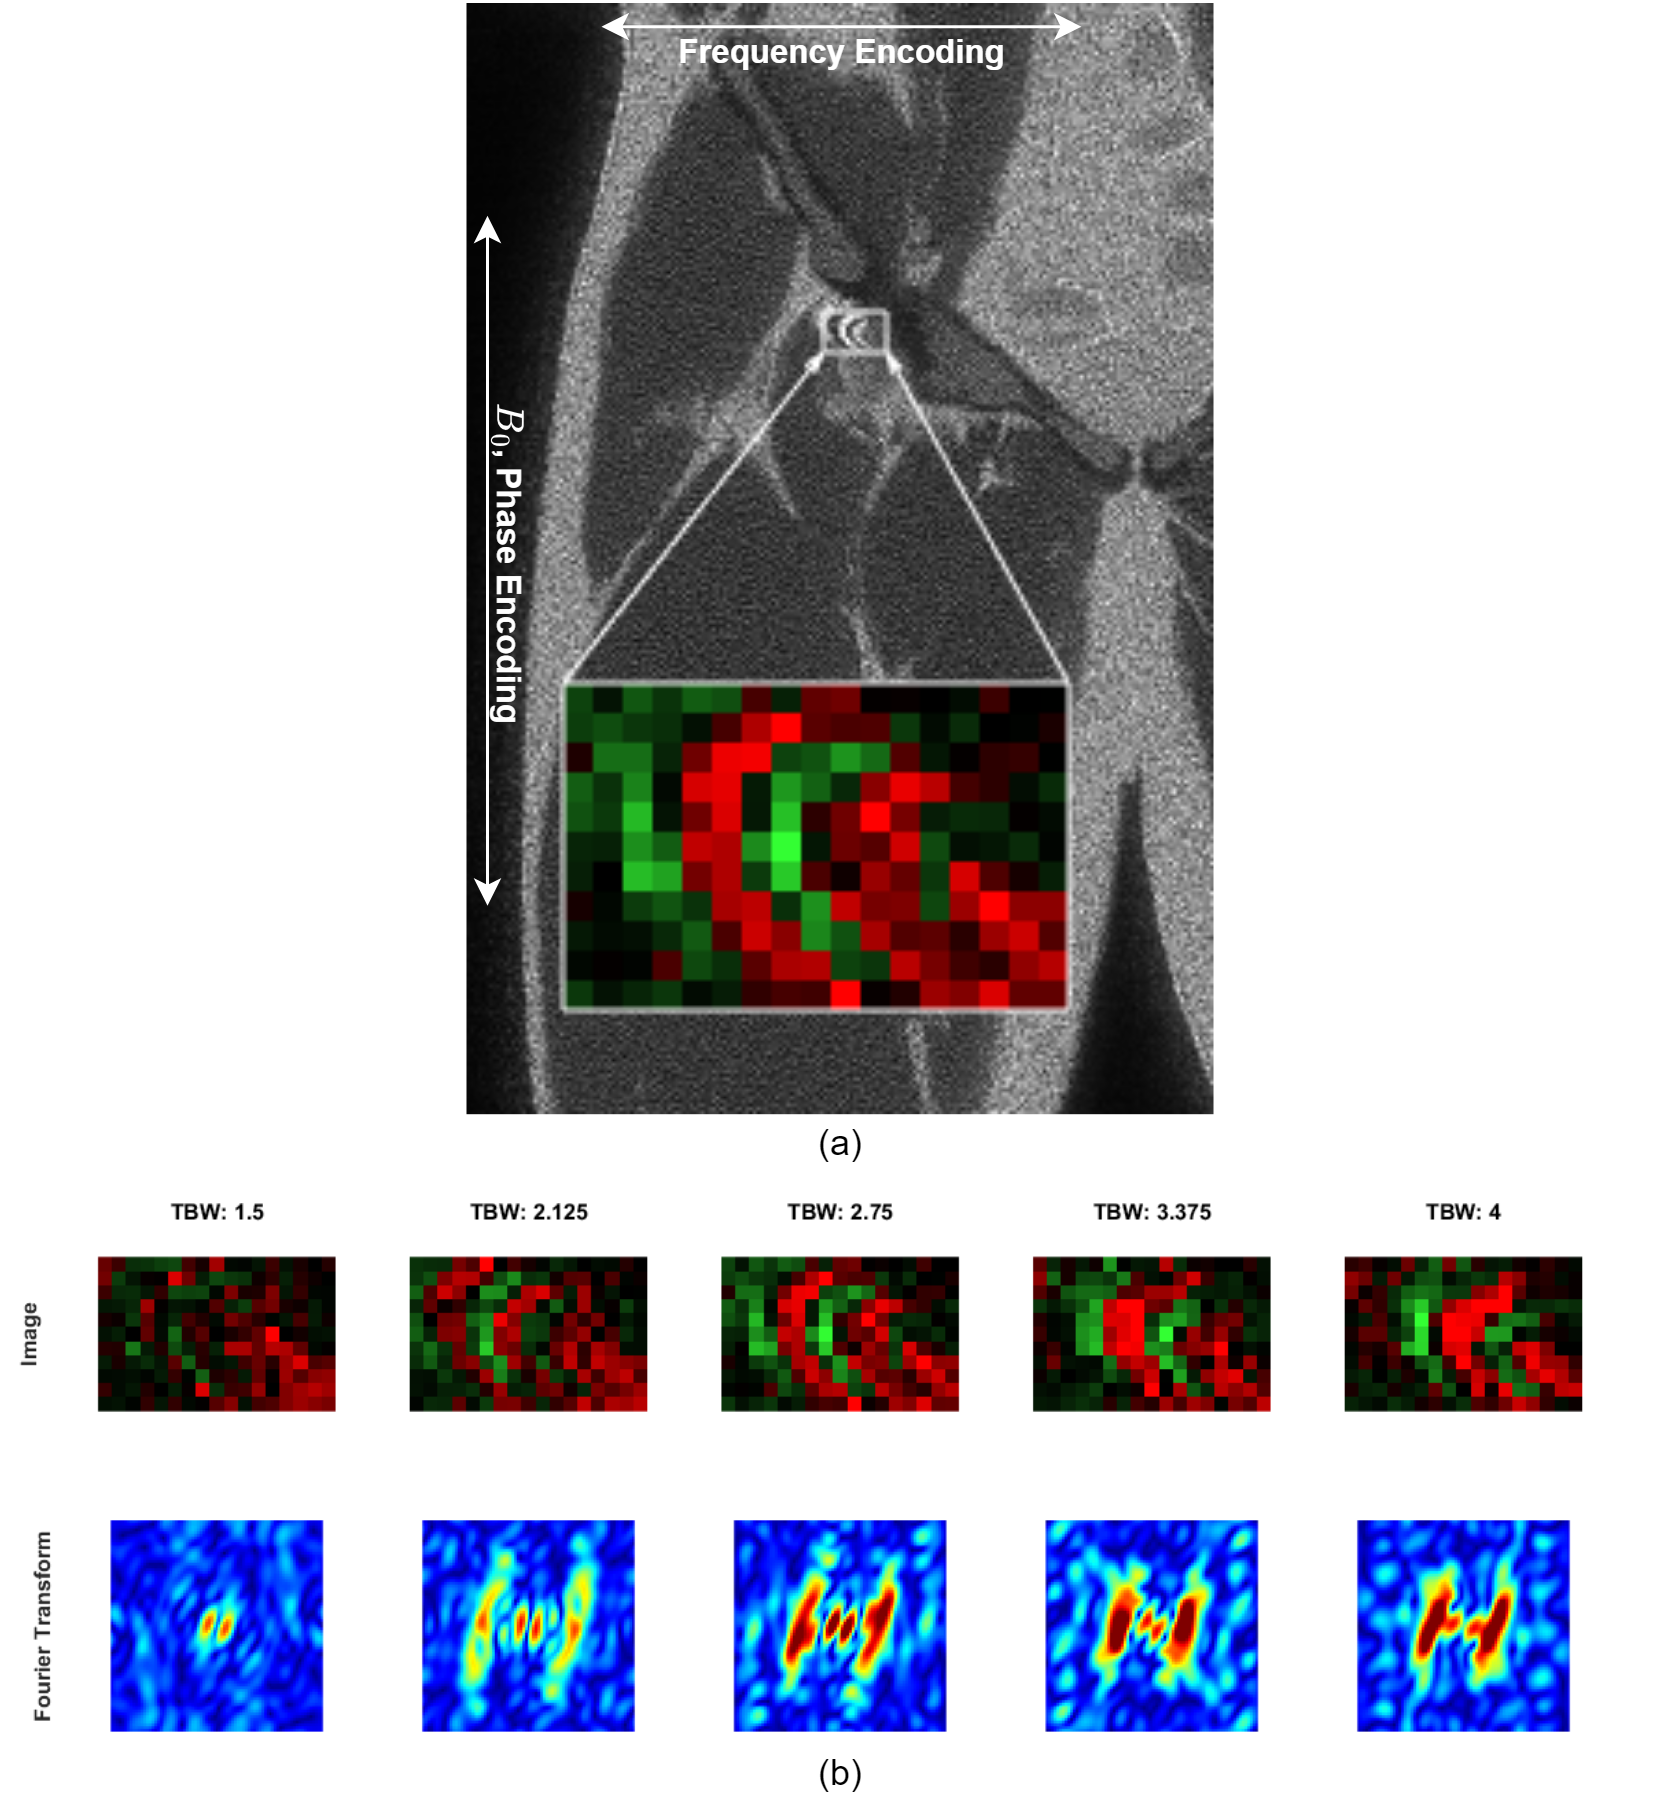
Figure 2(a) shows a simulated SEMAC acquisition and the ROI for the evaluation of the proposed ripple artifact metrics. The top row of Figure 2(b) shows the difference between the simulations with and without $$$\Delta f$$$ (slice thickness: 5mm). The color-coded difference signal only contains the SEMAC artifacts. The ripples are in the vicinity of the implant and show an oscillating behaviour along the frequency encoding direction (here: RL). The bottom row shows the corresponding Fourier transformations of the difference signals. The absolute artifact intensity metric is shown in Figure 3. For the 4mm and 5mm slices, a trend towards higher absolute artifact intensity can be observed for higher TBWs. Figure 4(b-d) shows the RSED distribution plotted against the $$$k$$$-space radius. In most cases, the distribution consists of two distinct lobes. The low-frequency lobe corresponds to image components that have slowly varying intensities. For the high-frequency lobe, a trend towards increased RSED and slightly reduced peak frequency can be seen for higher TBWs, especially for slice thickness 4mm and 5mm. The reduced peak frequency is also recognizable in the decreasing spatial frequency of the difference images.Discussion
The proposed artifact metrics can quantify SEMAC ripples, based on their intensity and spatial frequency. For the 4mm and 5mm slices, both metrics show a positive correlation between artifact intensity and TBW, which agrees with the qualitative assessment of the difference images and the RF-pulse considerations in (2). The proposed metrics are based on artifact-free ground truth images, which can only be acquired through MR Bloch simulations. However, the application of the k-space-based RSED metric without ground truth is also conceivable given the similar distinct high frequency pattern of ripple artifacts in in-vivo images6. Hence the presented methods may serve as basis for metal artifact reduction sequence optimization, particularly of RF-pulse parameters.Acknowledgements
No acknowledgement found.References
1. Lu W, Pauly KB, Gold GE, Pauly JM, Hargreaves BA. SEMAC: Slice encoding for metal artifact correction in MRI. Magn Reson Med. 2009;62(1):66-76.
2. Koch KM, Brau AC, Chen W, et al. Imaging near metal with a MAVRIC-SEMAC hybrid. Magn Reson Med. 2011;65(1):71-82.
3. Koch KM, King KF, Carl M, Hargreaves BA. Imaging near metal: The impact of extreme static local field gradients on frequency encoding processes. Magn Reson Med. 2014;71(6):2024-2034.
4. Den Harder JC, Van Yperen GH, Blume UA, Bos C. Ripple artifact reduction using slice overlap in slice encoding for metal artifact correction. Magn Reson Med. 2015;73(1):318-324.
5. Toms A, Smith-Bateman C, Malcolm P, Cahir J, Graves M. Optimization of metal artefact reduction (MAR) sequences for MRI of total hip prostheses. Clin Radiol. 2010;65(6):447-452.
6. Sutter R, Ulbrich EJ, Jellus V, Nittka M, Pfirrmann CWA. Reduction of metal artifacts in patients with total hip arthroplasty with slice-encoding metal artifact correction and view-angle tilting MR imaging. Radiology. 2012;265(1):204-214.
7. IT’IS Foundation Virtual Polulation. https://itis.swiss/virtual-population/virtual-population/overview/. Accessed September 26, 2023.
8. Wahlen J, Kozerke S, Nanz D, Sutter R, von Deuster C. A General Framework for Bloch Simulation of Metal-Induced Artifacts. In: Submitted to ISMRM. ; 2024.
Figures