0769
Neural Shape Models Meaningfully Localize Features Relevant to Osteoarthritis Disease: Data from the Osteoarthritis Initiative1Stanford University, Stanford, CA, United States
Synopsis
Keywords: Osteoarthritis, MSK, shape model, MOAKS, osteophytes
Motivation: Osteoarthritis is a whole joint disease that requires quantification, localization, and visualization of disease related features of bones and cartilage.
Goal(s): To develop a novel neural shape model (NSM) that can encode and reconstruct bone and cartilage shape, while quantifying localized features of OA.
Approach: We trained a NSM on 6,325 knees and compared its reconstructions to a conventional statistical shape model and its ability to predict localized disease to a convolutional neural network.
Results: The NSM reconstructed tissues with cartilage thickness correlations >0.993. NSM representations accurately diagnosed OA and predicted localized severity of osteophytes and cartilage defects better than a CNN.
Impact: Our NSM can reconstruct whole bone and cartilage morphology, while encoding localized pathology specific information. Research use of the NSM can unlock novel insights into OA pathophysiology. Clinical deployment would enable automated insights into whole joint health.
Introduction
Osteoarthritis (OA) is a whole joint disease. The MRI Osteoarthritis Knee Score (MOAKS) is a semi-quantitative measure of localized features of several tissues involved in OA. However, MOAKS requires expertise and time, and is still prone to variability1 and common deep learning approaches to automate MOAKS are typically MRI sequence-specific2.Quantitative OA metrics measure scalar values such as mean cartilage thickness. Statistical shape models (SSM) of bone3 and menisci4 improve whole anatomy measurement. Neural shape models (NSM) improve upon SSMs by encoding anatomic shape using a neural network5. To understand OA disease, we need to jointly model bone and cartilage.
We developed a bone and cartilage NSM in 6,325 knees from 3,232 subjects from the Osteoarthritis Initiative (OAI). We then tested the NSM’s ability to reconstruct bone and cartilage and to encode morphologic information relevant to disease diagnosis and staging by predicting MOAKS scores.
Methods
Data from the baseline visit of 4,790 participants (9,376 knees) in the OAI with Double Echo in Steady State (DESS) data were included (TE/TR= 5/16ms, flip angle=25o, field-of-view=140×140mm2, in-plane resolution=0.36×0.36mm2, slice thickness=0.7mm). Knees were segmented using a convolutional neural network6, left knees were mirrored, and femur bone and cartilage tissues were meshed (Figure 1)7.Participants were split into training (3,232) and testing (1,481), while stratifying by Kellgren Lawrence (KL) grade, sex, and MOAKS scores. A NSM (f) was fit using an autodecoder10 which takes as input a latent vector (z) representing a subjects’ anatomy and a set of XYZ coordinates (x). Then, through a series of convolutional and fully connected layers the NSM predicts the signed distance (s; s > 0 outside, s < 0 inside) of the coordinates relative to the anatomic surface (Figure 1). The model is fit by optimizing the network and latent vectors to predict the signed distances. Once the NSM is trained, a new bone and cartilage surface can be reconstructed by optimizing a randomly initialized latent vector (z) to reconstruct the known surface points (s = 0). Reconstruction results in the anatomical surface together with a vector representing the subjects’ anatomy that can be used for downstream tasks.
To evaluate the NSM, we compared bone and cartilage reconstruction accuracies to a traditional SSM. Furthermore, we quantified the NSM’s ability to capture pathology by predicting KL grade, diagnosing OA, and predicting MOAKS osteophytes, cartilage thinning, and full thickness cartilage loss in 6 regions using the fitted latent vector as input to a multilayer perceptron. We compare predictions to a 3D convolutional neural network (CNN) applied to the raw DESS images.
Results
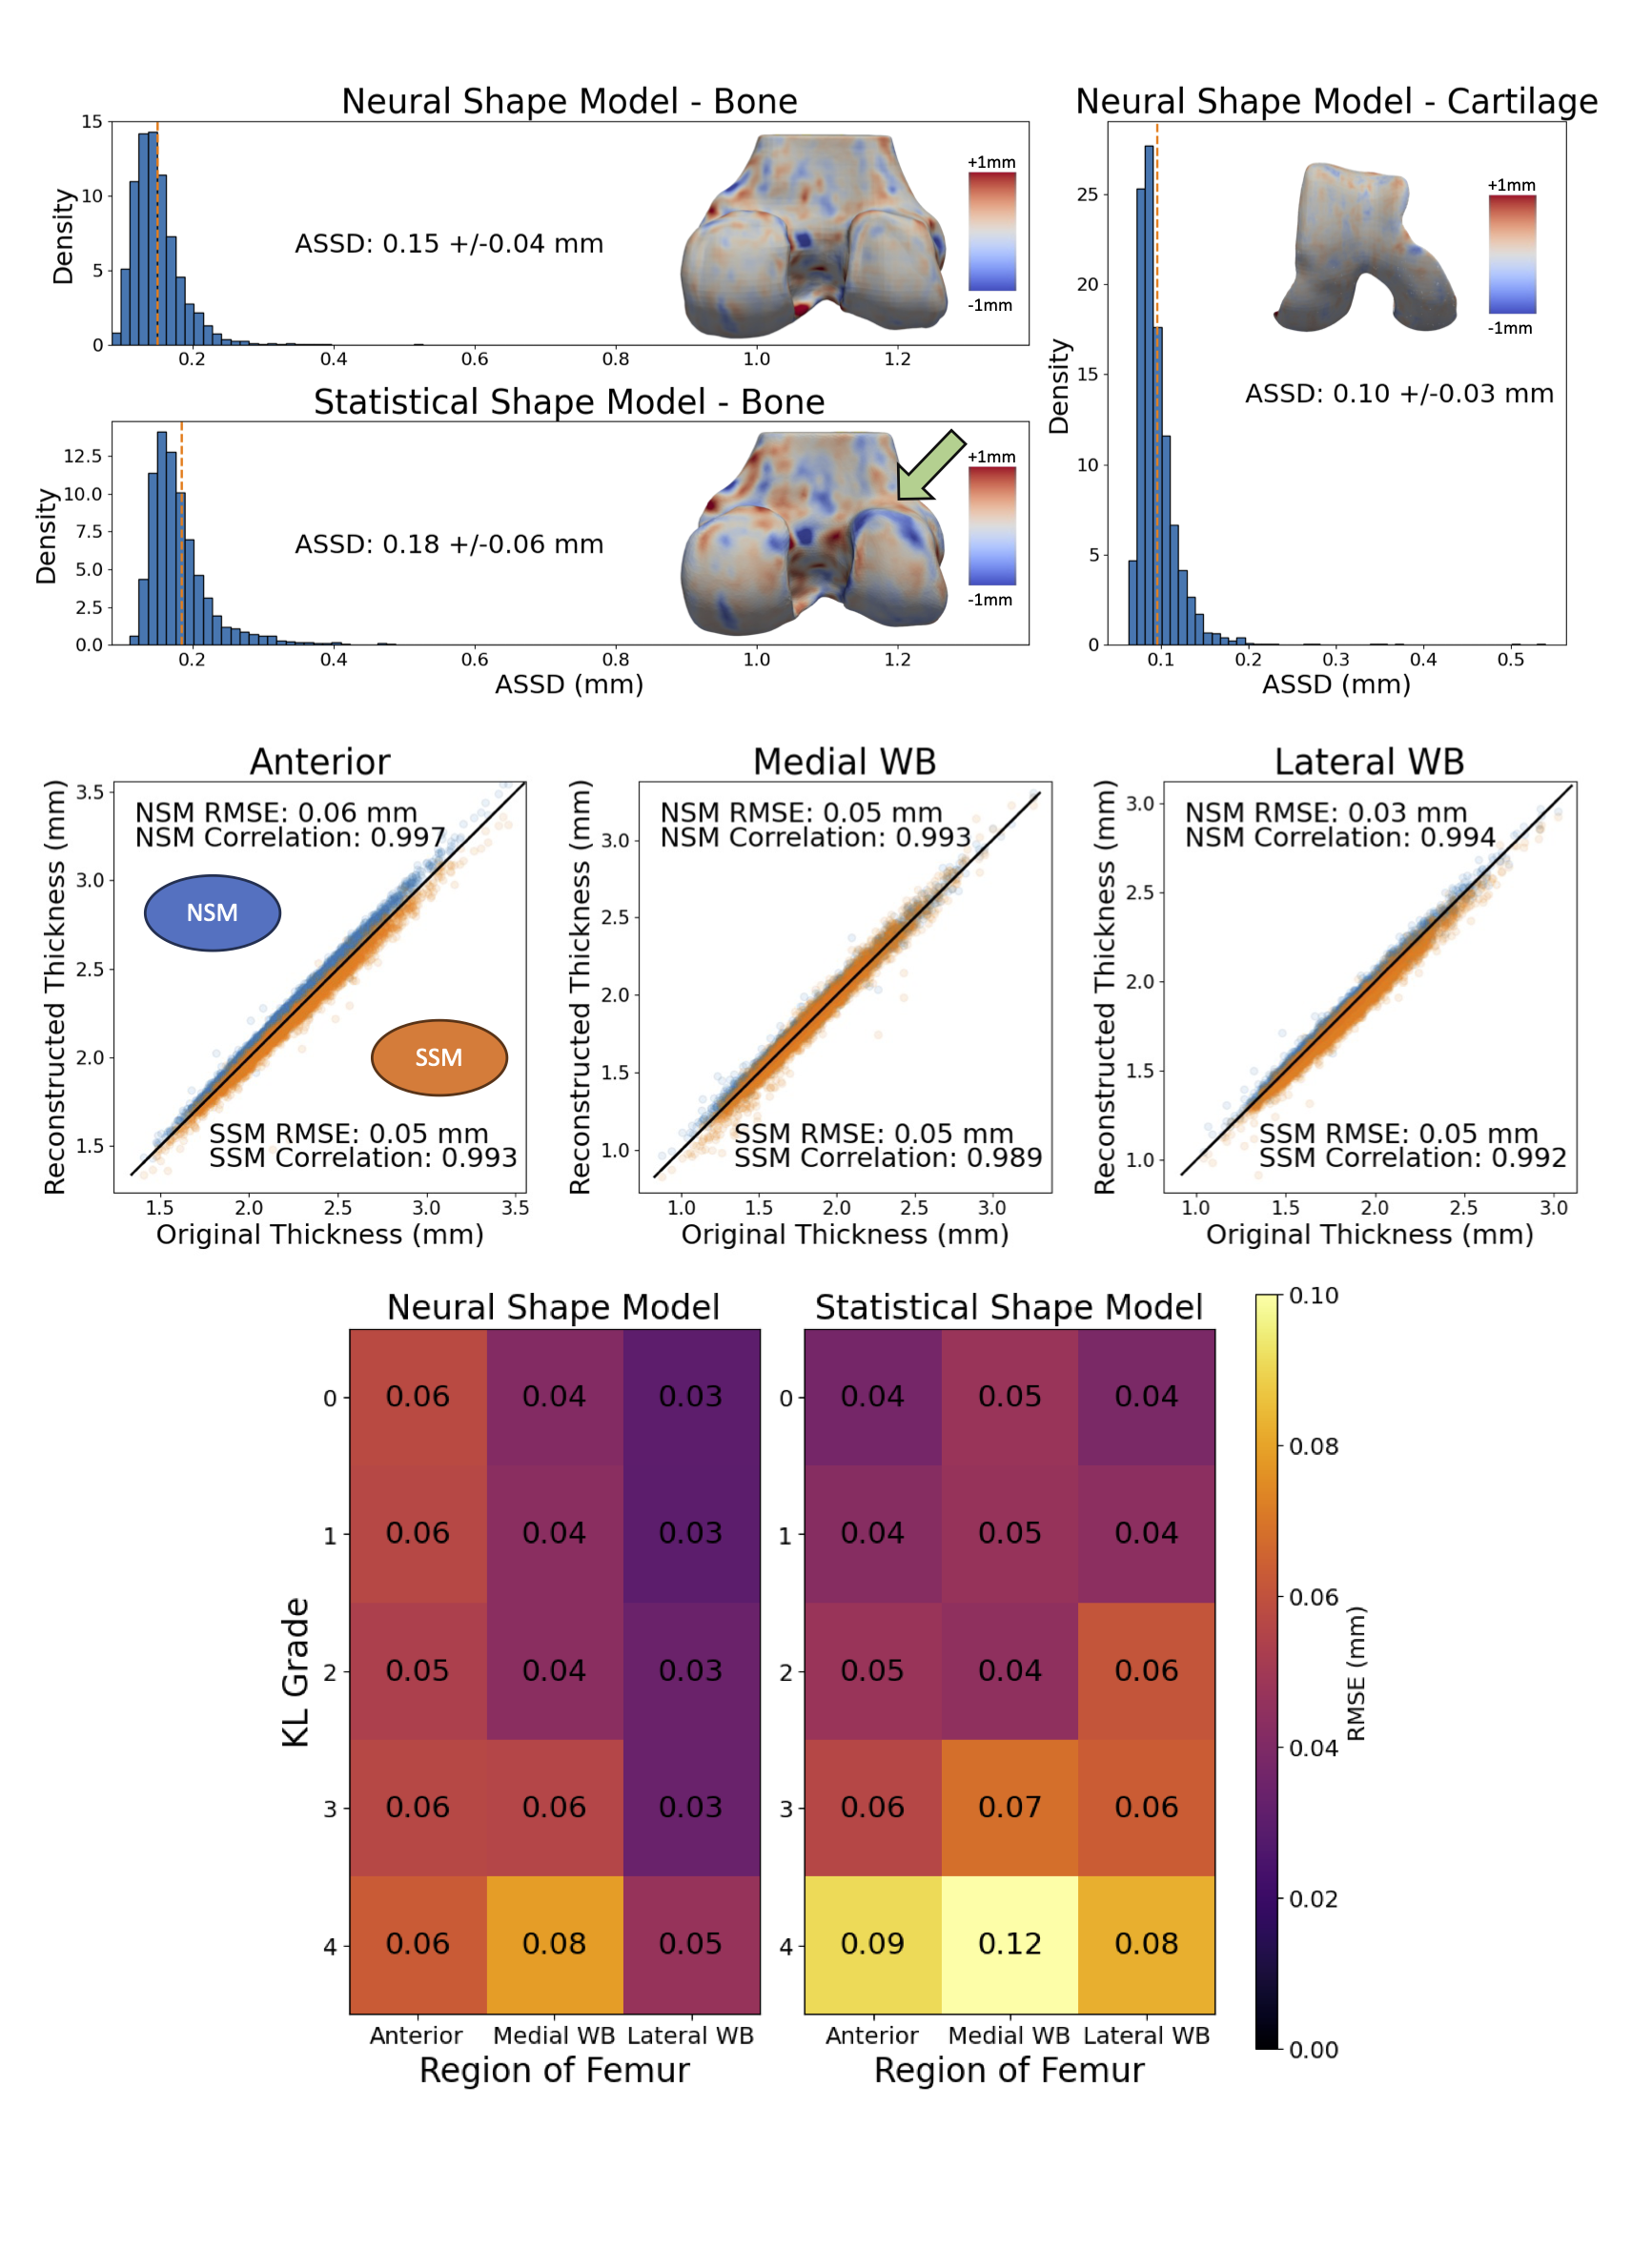
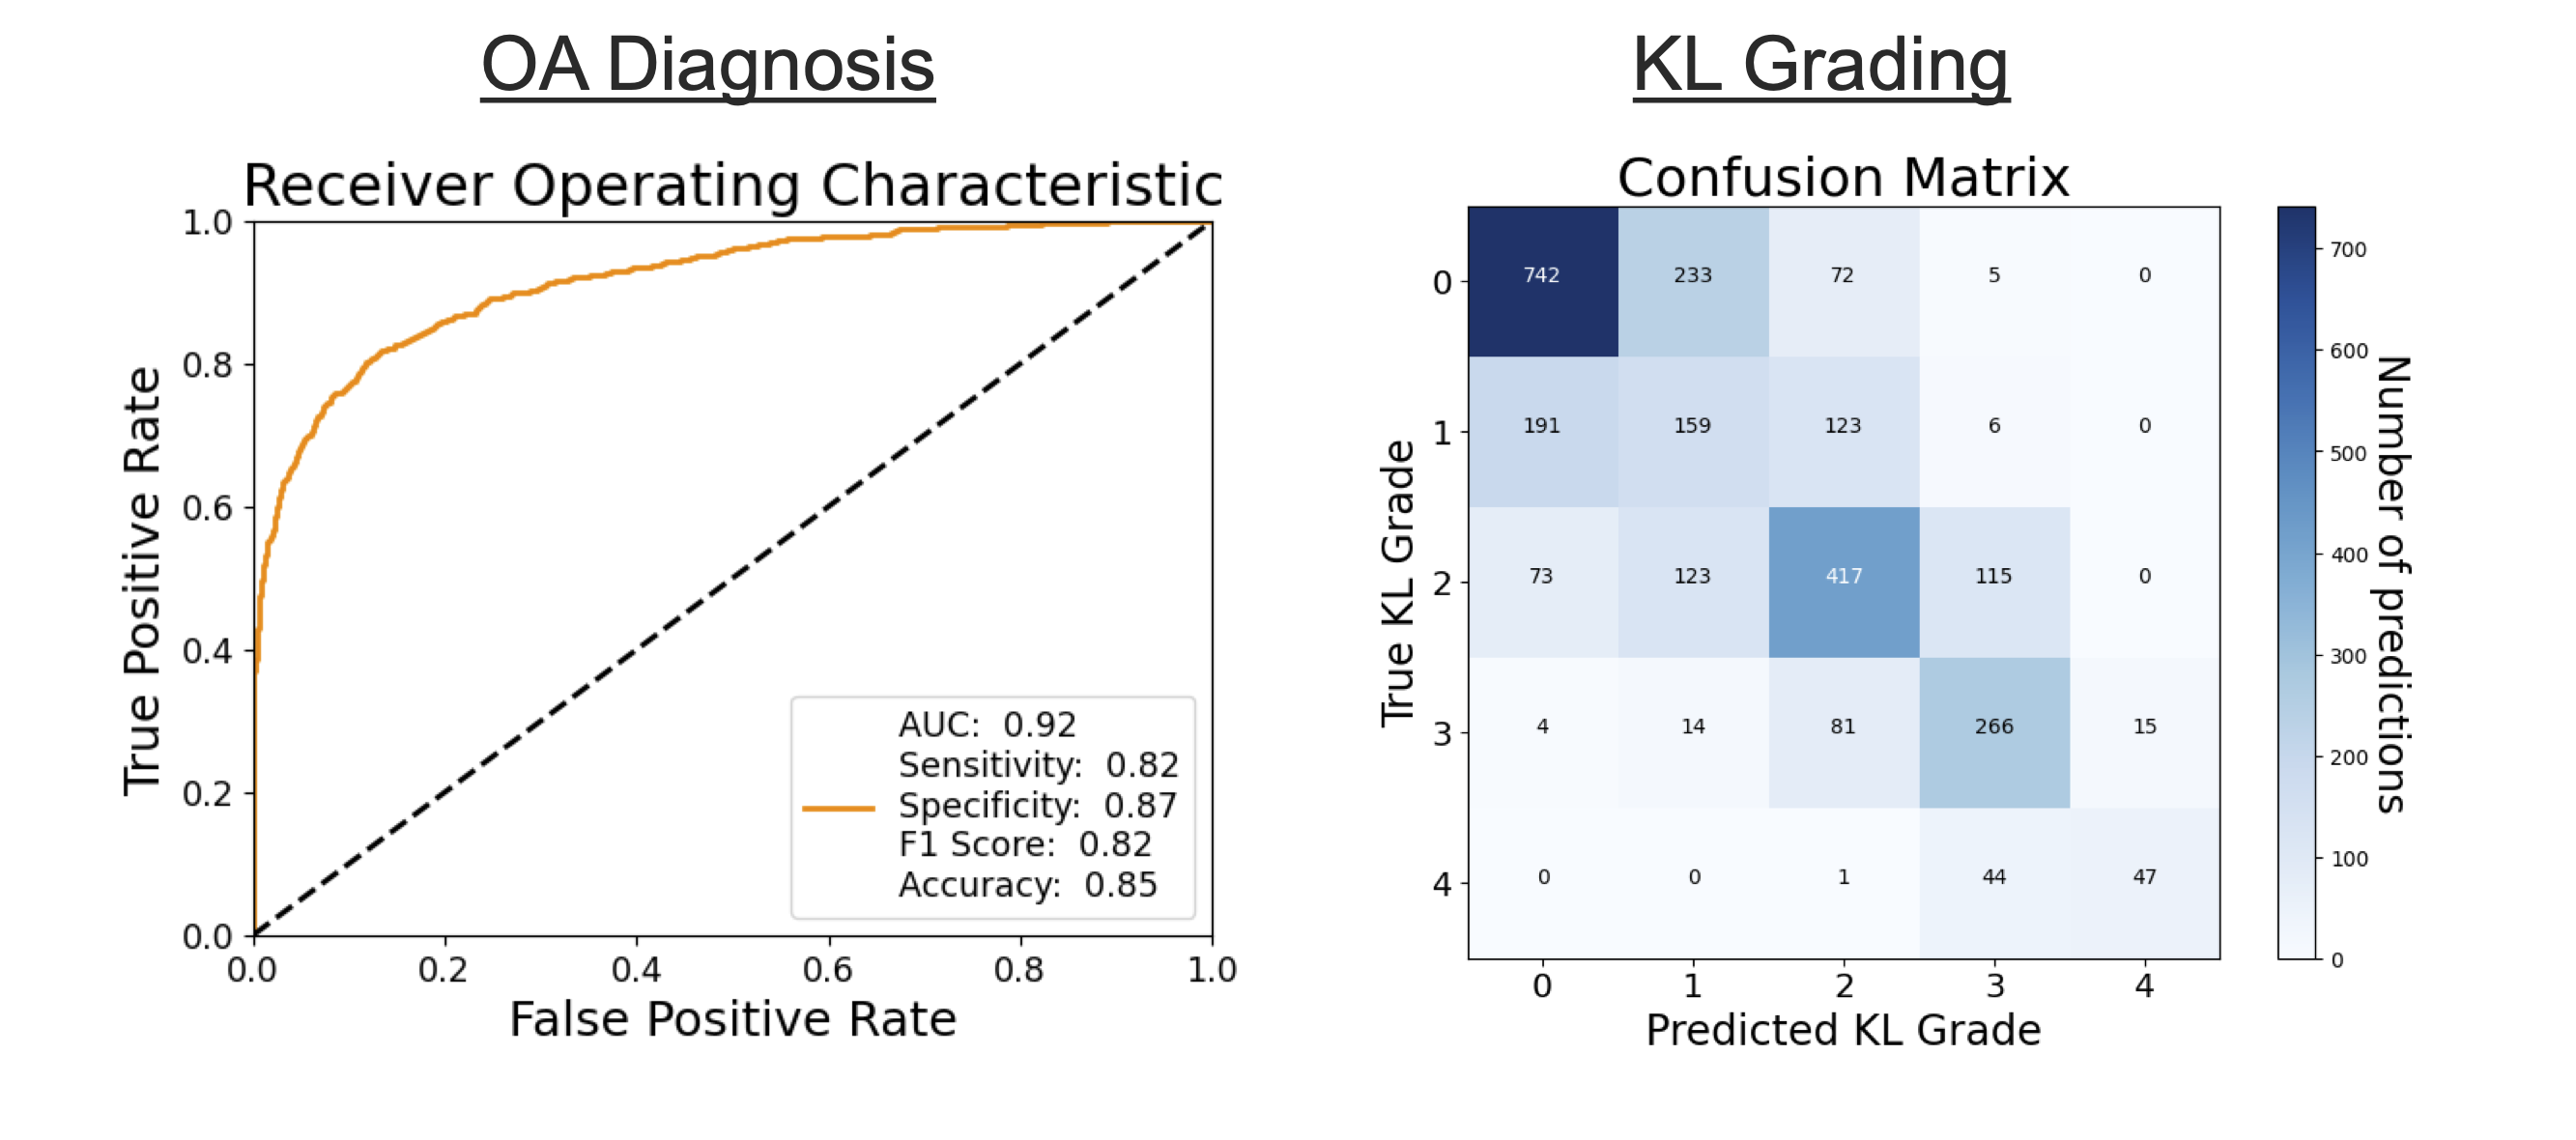
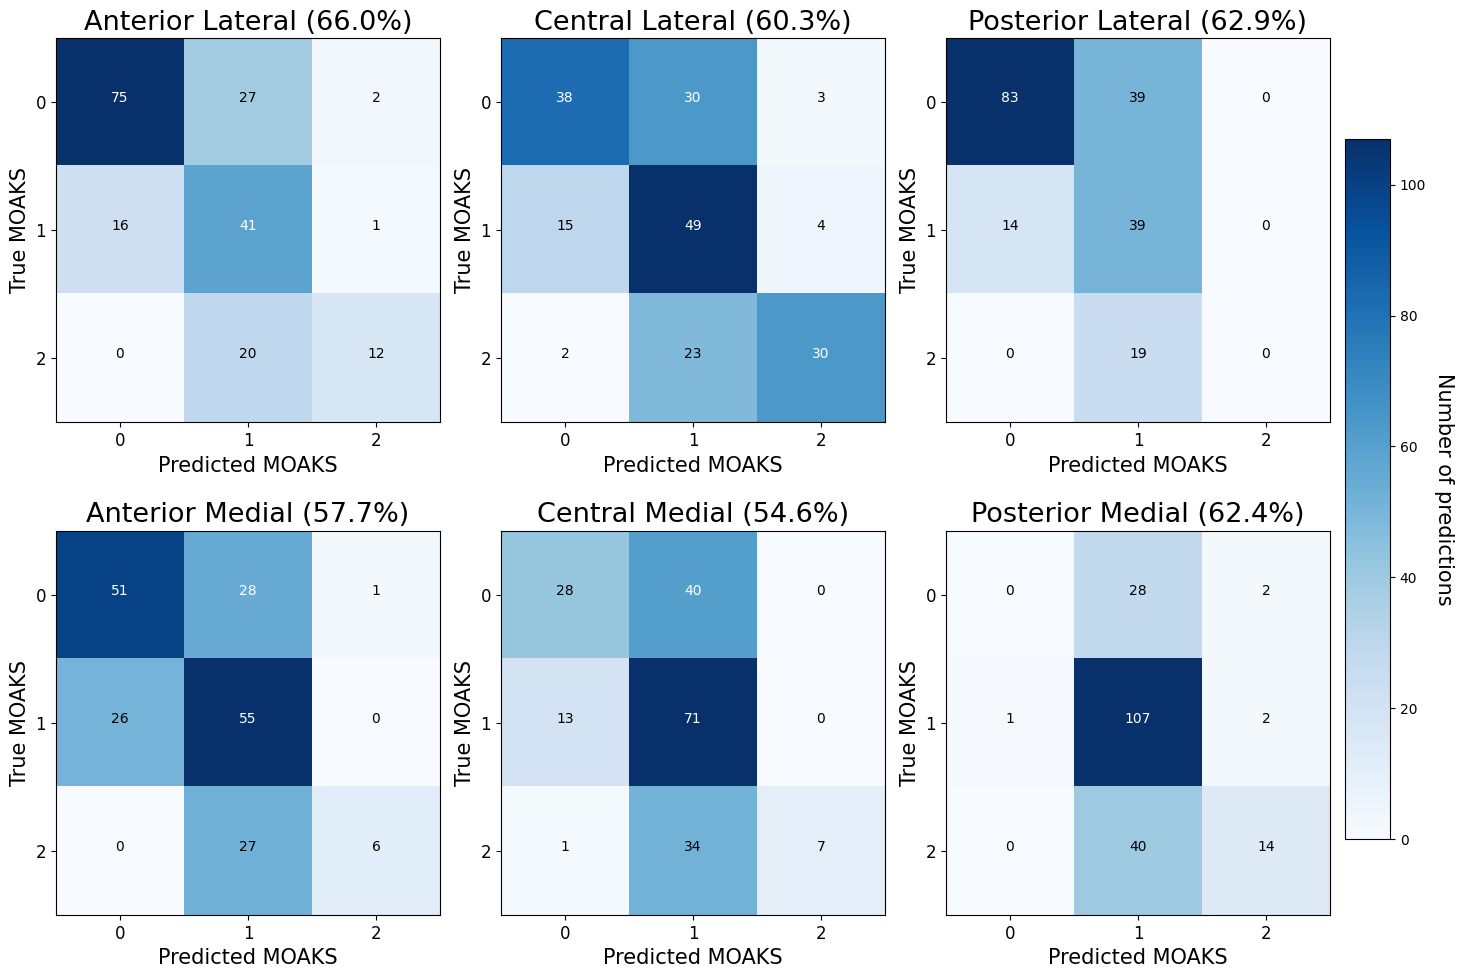
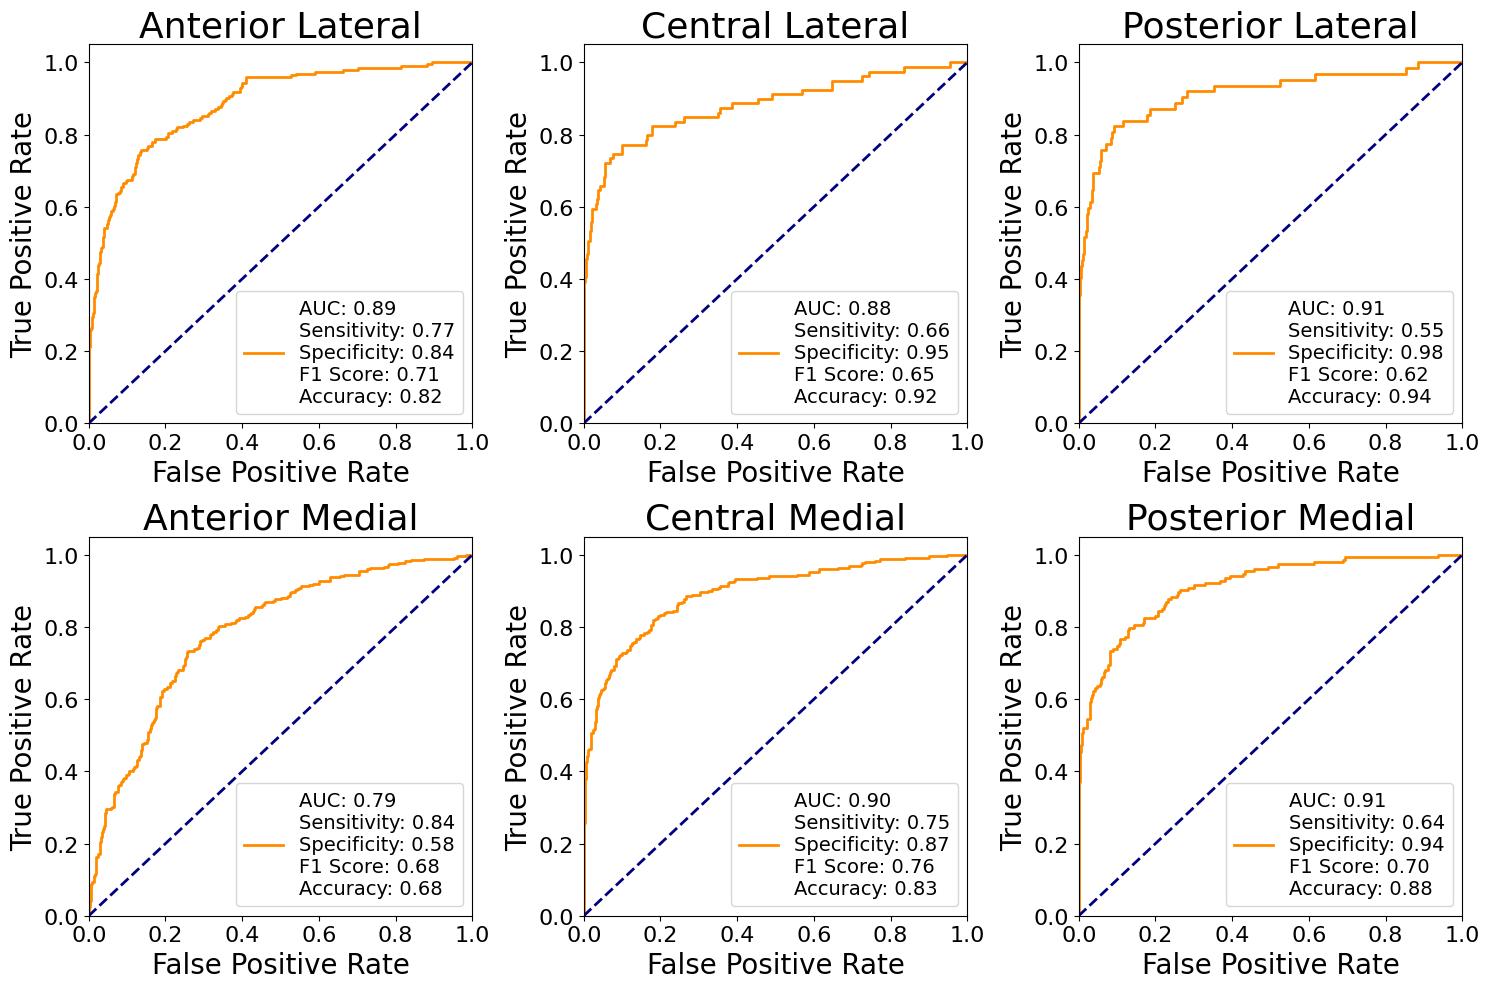
The NSM reconstructed bone surfaces had 20% lower average symmetric surface distance (ASSD) error than a SSM (Figure 2). The reconstructed mean cartilage thickness had root mean squared error (RMSE) ≤ 0.06mm and correlations >0.992 (Figure 2). The SSM thickness reconstruction degraded more with increasing KL grade than the NSM (Figure 2).Latent vectors fit to 2,731 test subjects and input into a multilayer perceptron diagnosed OA with area under the receiver operating characteristic curve (AUROC) of 0.92 and predicted KL grade with an accuracy of 60% (Figure 3); the CNN had OA diagnosis AUROC of 0.90 and KL accuracy of 60%. NSM latent vectors localized OA features by predicting location specific osteophyte size with an average accuracy of 60% (Figure 4), and location specific cartilage thinning with an AUROC of 0.79-0.91 (Figure 5); the CNN predicted osteophyte scores with an average accuracy of 51%, and cartilage thinning AUROC from 0.70 to 0.81. MOAKS cartilage lesions were predicted in the 6 regions with AUROC 0.71-0.91, sensitivity 0.15-0.57, and specificity 0.95-0.99; the CNN had AUROC of 0.59-0.83.
Discussion
The NSM reconstructed bone and cartilage more accurately than a traditional SSM. The cartilage ASSD (0.10mm) was < 1/3 of the in-plane resolution (0.36mm) and smaller than errors between manual and deep learning segmentations (0.14-0.17mm)11. SSM errors varied considerably with disease severity; NSM errors did not.NSM fitted latent codes diagnosed OA with an accuracy equivalent to the best radiologist rater from a previous study12. Latent codes contained information to localize OA features such as osteophyte size, the amount of cartilage thinning, and presence of cartilage lesions. The NSM outperformed a 3D CNN applied to MR data on all tasks. Furthermore, the NSM only requires a segmentation, making it easier to apply to new sequences than conventional sequence-specific CNNs.
Conclusion
The NSM can reconstruct high resolution bone and cartilage surfaces while simultaneously encoding location and pathology-specific information. NSMs have major promise in automating OA diagnosis and staging, and for understanding disease pathophysiology.Acknowledgements
Research supported by NIH R01 AR077604, R01 EB002524, R01 AR079431, P41 EB027060, Wu Tsai Human Performance Alliance, CIHR Postdoctoral Fellowship.References
1. Hunter DJ, Guermazi A, Lo GH, et al. Evolution of semi-quantitative whole joint assessment of knee OA: MOAKS (MRI Osteoarthritis Knee Score). Osteoarthritis and Cartilage. 2011;19(8):990-1002. doi:10.1016/j.joca.2011.05.004
2. Namiri NK, Lee J, Astuto B, et al. Deep learning for large scale MRI-based morphological phenotyping of osteoarthritis. Sci Rep. 2021;11(1):10915. doi:10.1038/s41598-021-90292-6
3. Pedoia V, Lansdown DA, Zaid M, et al. Three-dimensional MRI-based statistical shape model and application to a cohort of knees with acute ACL injury. Osteoarthritis and Cartilage. 2015;23(10):1695-1703. doi:10.1016/j.joca.2015.05.027
4. Gao KT, Xie E, Chen V, et al. Large‐Scale Analysis of Meniscus Morphology as Risk Factor for Knee Osteoarthritis. Arthritis & Rheumatology. 2023;75(11):1958-1968. doi:10.1002/art.42623
5. Gatti AA, Van Veen D, Gold GE, Delp SL, Chaudhari A. Neural Shape Models Predict Knee Pain Better than Conventional Statistical Shape Models: Data from the Osteoarthritis Initiative. In: ; 2023.
6. Gatti AA, Maly MR. Automatic knee cartilage and bone segmentation using multi-stage convolutional neural networks: data from the osteoarthritis initiative. Magn Reson Mater Phy. 2021;34(6):859-875. doi:10.1007/s10334-021-00934-z
7. Gatti AA, Keir PJ, Noseworthy MD, Maly MR. Investigating acute changes in osteoarthritic cartilage by integrating biomechanics and statistical shape models of bone: data from the osteoarthritis initiative. Magn Reson Mater Phy. Published online March 14, 2022. doi:10.1007/s10334-022-01004-8
8. Chan ER, Lin CZ, Chan MA, et al. Efficient Geometry-aware 3D Generative Adversarial Networks. Published online April 27, 2022. doi:10.48550/arXiv.2112.07945
9. Gatti AA, Kogan F, Delp SL, Gold GE, Chaudhari AS. Predicting Chronic Knee Pain Using An Automated Mri-Based Bone And Cartilage Statistical Shape Model: Data From The Osteoarthritis Initiative. Osteoarthritis and Cartilage. 2023;31:S78-S79. doi:10.1016/j.joca.2023.01.020
10. Park JJ, Florence P, Straub J, Newcombe R, Lovegrove S. DeepSDF: Learning Continuous Signed Distance Functions for Shape Representation. Published online January 15, 2019. doi:10.48550/arXiv.1901.05103
11. Wirth W, Eckstein F, Kemnitz J, et al. Accuracy and longitudinal reproducibility of quantitative femorotibial cartilage measures derived from automated U-Net-based segmentation of two different MRI contrasts: data from the osteoarthritis initiative healthy reference cohort. Magnetic Resonance Materials in Physics, Biology and Medicine. Published online October 6, 2020. doi:10.1007/s10334-020-00889-7
12. Thomas KA, Kidziński Ł, Halilaj E, et al. Automated Classification of Radiographic Knee Osteoarthritis Severity Using Deep Neural Networks. Radiology: Artificial Intelligence. 2020;2(2):e190065. doi:10.1148/ryai.2020190065
Figures
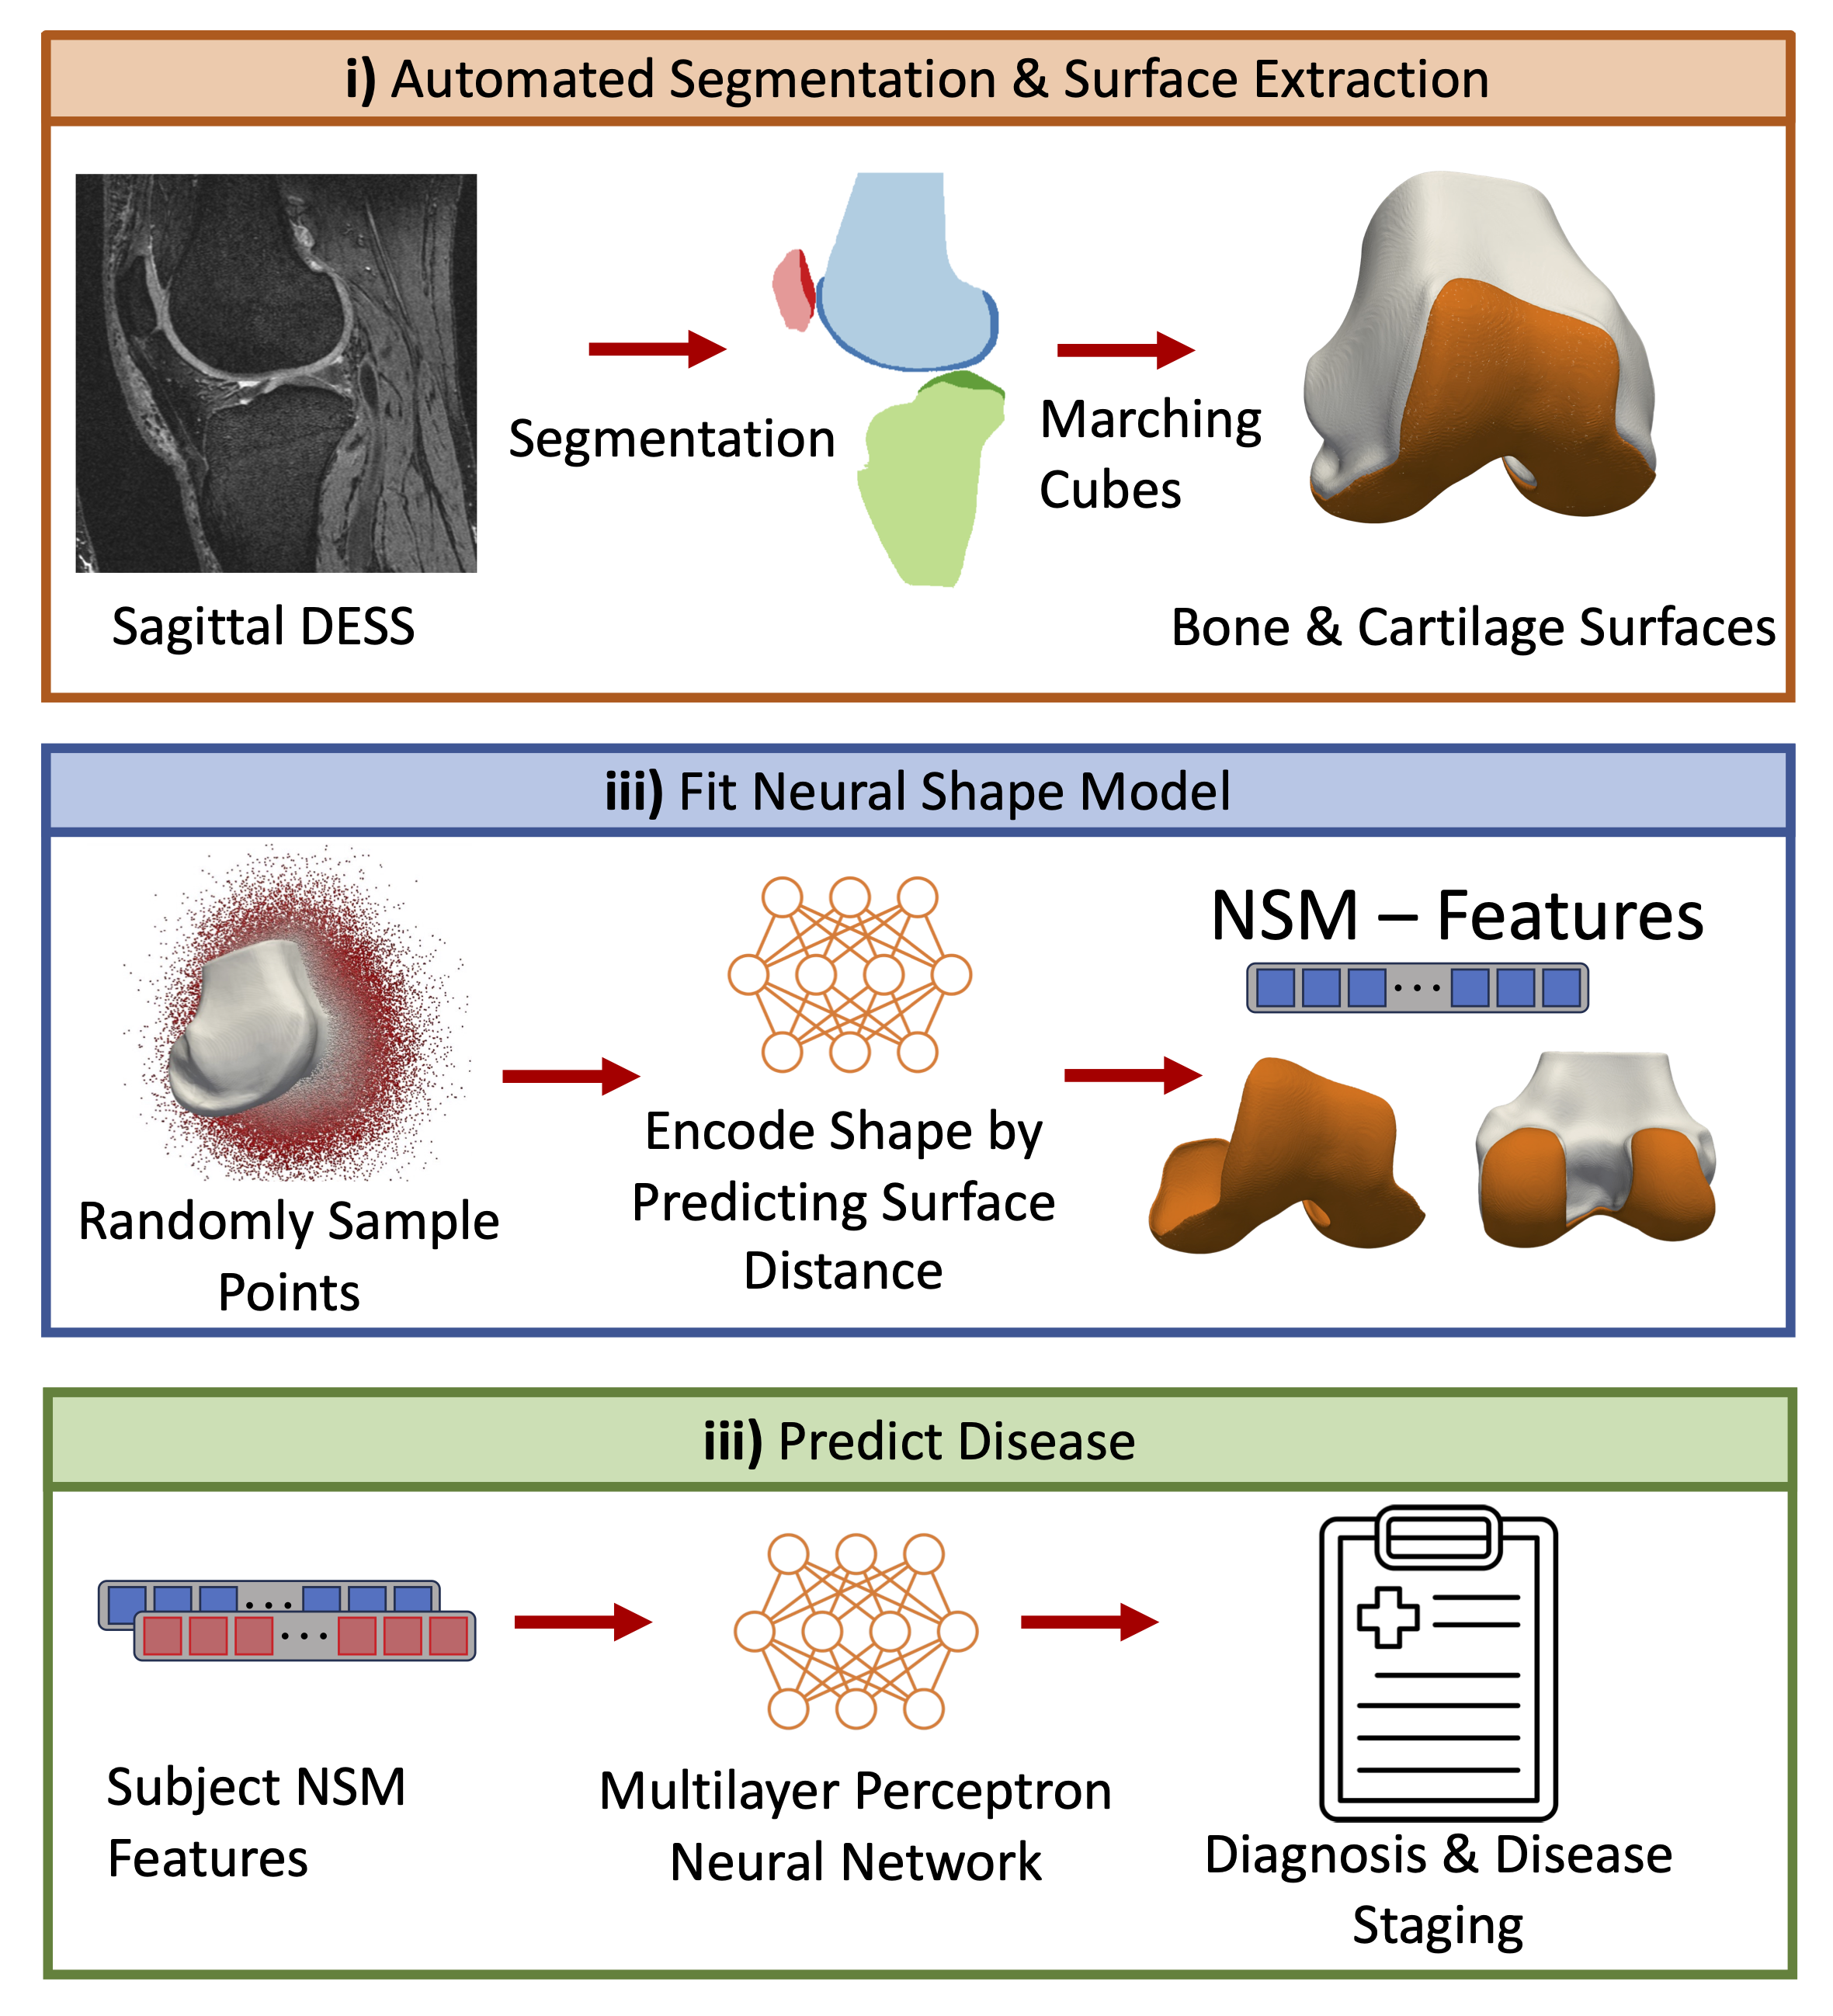
Figure 1. Neural Shape Model (NSM) Overview. i) Osteoarthritis Initiative DESS images were segmented and bone and cartilage surfaces were extracted using marching cubes. ii) A NSM was fit to the training data by optimizing its weights and subject-specific latent vectors to predict the signed (in/out) distance of randomly sampled points to the anatomic surface. iii) Latent vectors obtained via the NSM were used to diagnose and stage OA using a multilayer perceptron.