0766
Temporal Dynamics of ARIA-E: Quantifying Longitudinal Changes in Amyloid-Related Imaging Abnormalities1Centre For Medical Image Computing, Medical Physics and Biomedical Engineering, University College London, London, United Kingdom, 2Dementia Research Centre (DRC), Queen Square Institute of Neurology, University College London, London, United Kingdom, 3Department of Radiology and Nuclear Medicine, Amsterdam UMC, Amsterdam, Netherlands, 4Queen Square Analytics, London, United Kingdom, 5Bioxydyn Limited, Manchester, United Kingdom
Synopsis
Keywords: Data Processing, Alzheimer's Disease, Amyloid Related Imaging Abnormalities
Motivation: Using anti-amyloid monoclonal antibodies to treat Alzheimer’s disease (AD) can lead to ‘Amyloid-Related Imaging Abnormalities’ (ARIA), indicative of oedema (ARIA-E). ARIA-E's transient nature poses diagnostic challenges, necessitating efficient detection and monitoring, which is critical for drug development for AD.
Goal(s): This study aims to develop methods for quantifying and tracking ARIA-E across multiple longitudinal scans, including subtle manifestations.
Approach: Temporal variance and gradient maps were computed using serial ultra-rapid 3D FLAIR scans. Data-driven methods were employed to assess statistical significance of changes.
Results: The proposed maps highlight significant regions of change in the presence of varying levels of ARIA-E.
Impact: This work has facilitated the tracking of statistically significant ARIA-E over multiple serial scans, which will enable further automatic detection methods. These methods may inform dose adjustment and patient safety measures, which is important as anti-amyloid monoclonal antibodies become commonplace.
Introduction
Anti-amyloid monoclonal antibodies (mAb) have garnered attention for being the first disease-modifying treatments for Alzheimer's disease (AD)1. However, some patients exhibit MRI signal abnormalities, indicating vasogenic oedemas and effusion2, termed Amyloid-Related Imaging Abnormalities-E (ARIA-E). This side-effect can be symptomatic and lead to the withdrawal of patients from life-changing treatments3. As mAbs become more widespread, efficient detection and quantification of ARIA-E is necessary, especially in subtle cases.Subtraction images show promise for ARIA-E4 discovery but compare two images (baseline and follow-up) without consideration of the timescale of abnormality evolution. We propose novel approaches, presenting temporal variance and gradient maps to detect the occurrence and development of ARIA-E, with statistical assessment of changes. Additionally, we introduce the use of ultra-rapid 3D FLAIR acquisitions for ARIA-E detection—providing a cost-effective and efficient method.
Methods
Three patients with serial ultra-rapid T2-weighted 3D FLAIR scans were selected for analysis from an ongoing study: one with obvious ARIA-E (five scans over 120 days), one with subtle ARIA-E (six scans over 324 days), and one without (four scans over 126 days). The scans were acquired using a Siemens 3T MAGNETOM Prisma Fit (Siemens, Erlangen, Germany), with TR = 5000ms, TI = 1800ms, TE = 393ms, voxel size = 1.1mm isotropic, and acquisition time = 119 seconds.Image Preprocessing
Brain extraction was performed on the final image without ARIA-E in each series using HD-BET, a deep learning segmentation tool5. Each scan was affine registered to the final image in the patient series using a mutual information cost function and trilinear interpolation with FSL-FLIRT6–8. Bias-field correction used FSL’s Automated Segmentation Tool (FAST)7,9 with five classes10. Intensity normalisation was implemented via Nyul et al.’s11 Piecewise Linear Histogram Matching method, refined for images with hyperintense lesions12.
Quantification of Change
Temporal variance maps were produced by calculating intensity variances per voxel across each scan series. Temporal gradient maps were computed using a linear least squares polynomial fit to the equivalent voxel values in consecutive scans to find the voxel-wise daily intensity rate of change. For comparison, subtraction maps were computed between the scans with the most apparent change. Significance assessment included deriving parameter distributions for the voxels in the brain mask, and applying log-transformation to approximate normality, enabling quantification of voxel-level Z-scores across each map. These Z-scores were thresholded above the 99th percentile and clustered using 26-connectivity7.
Results
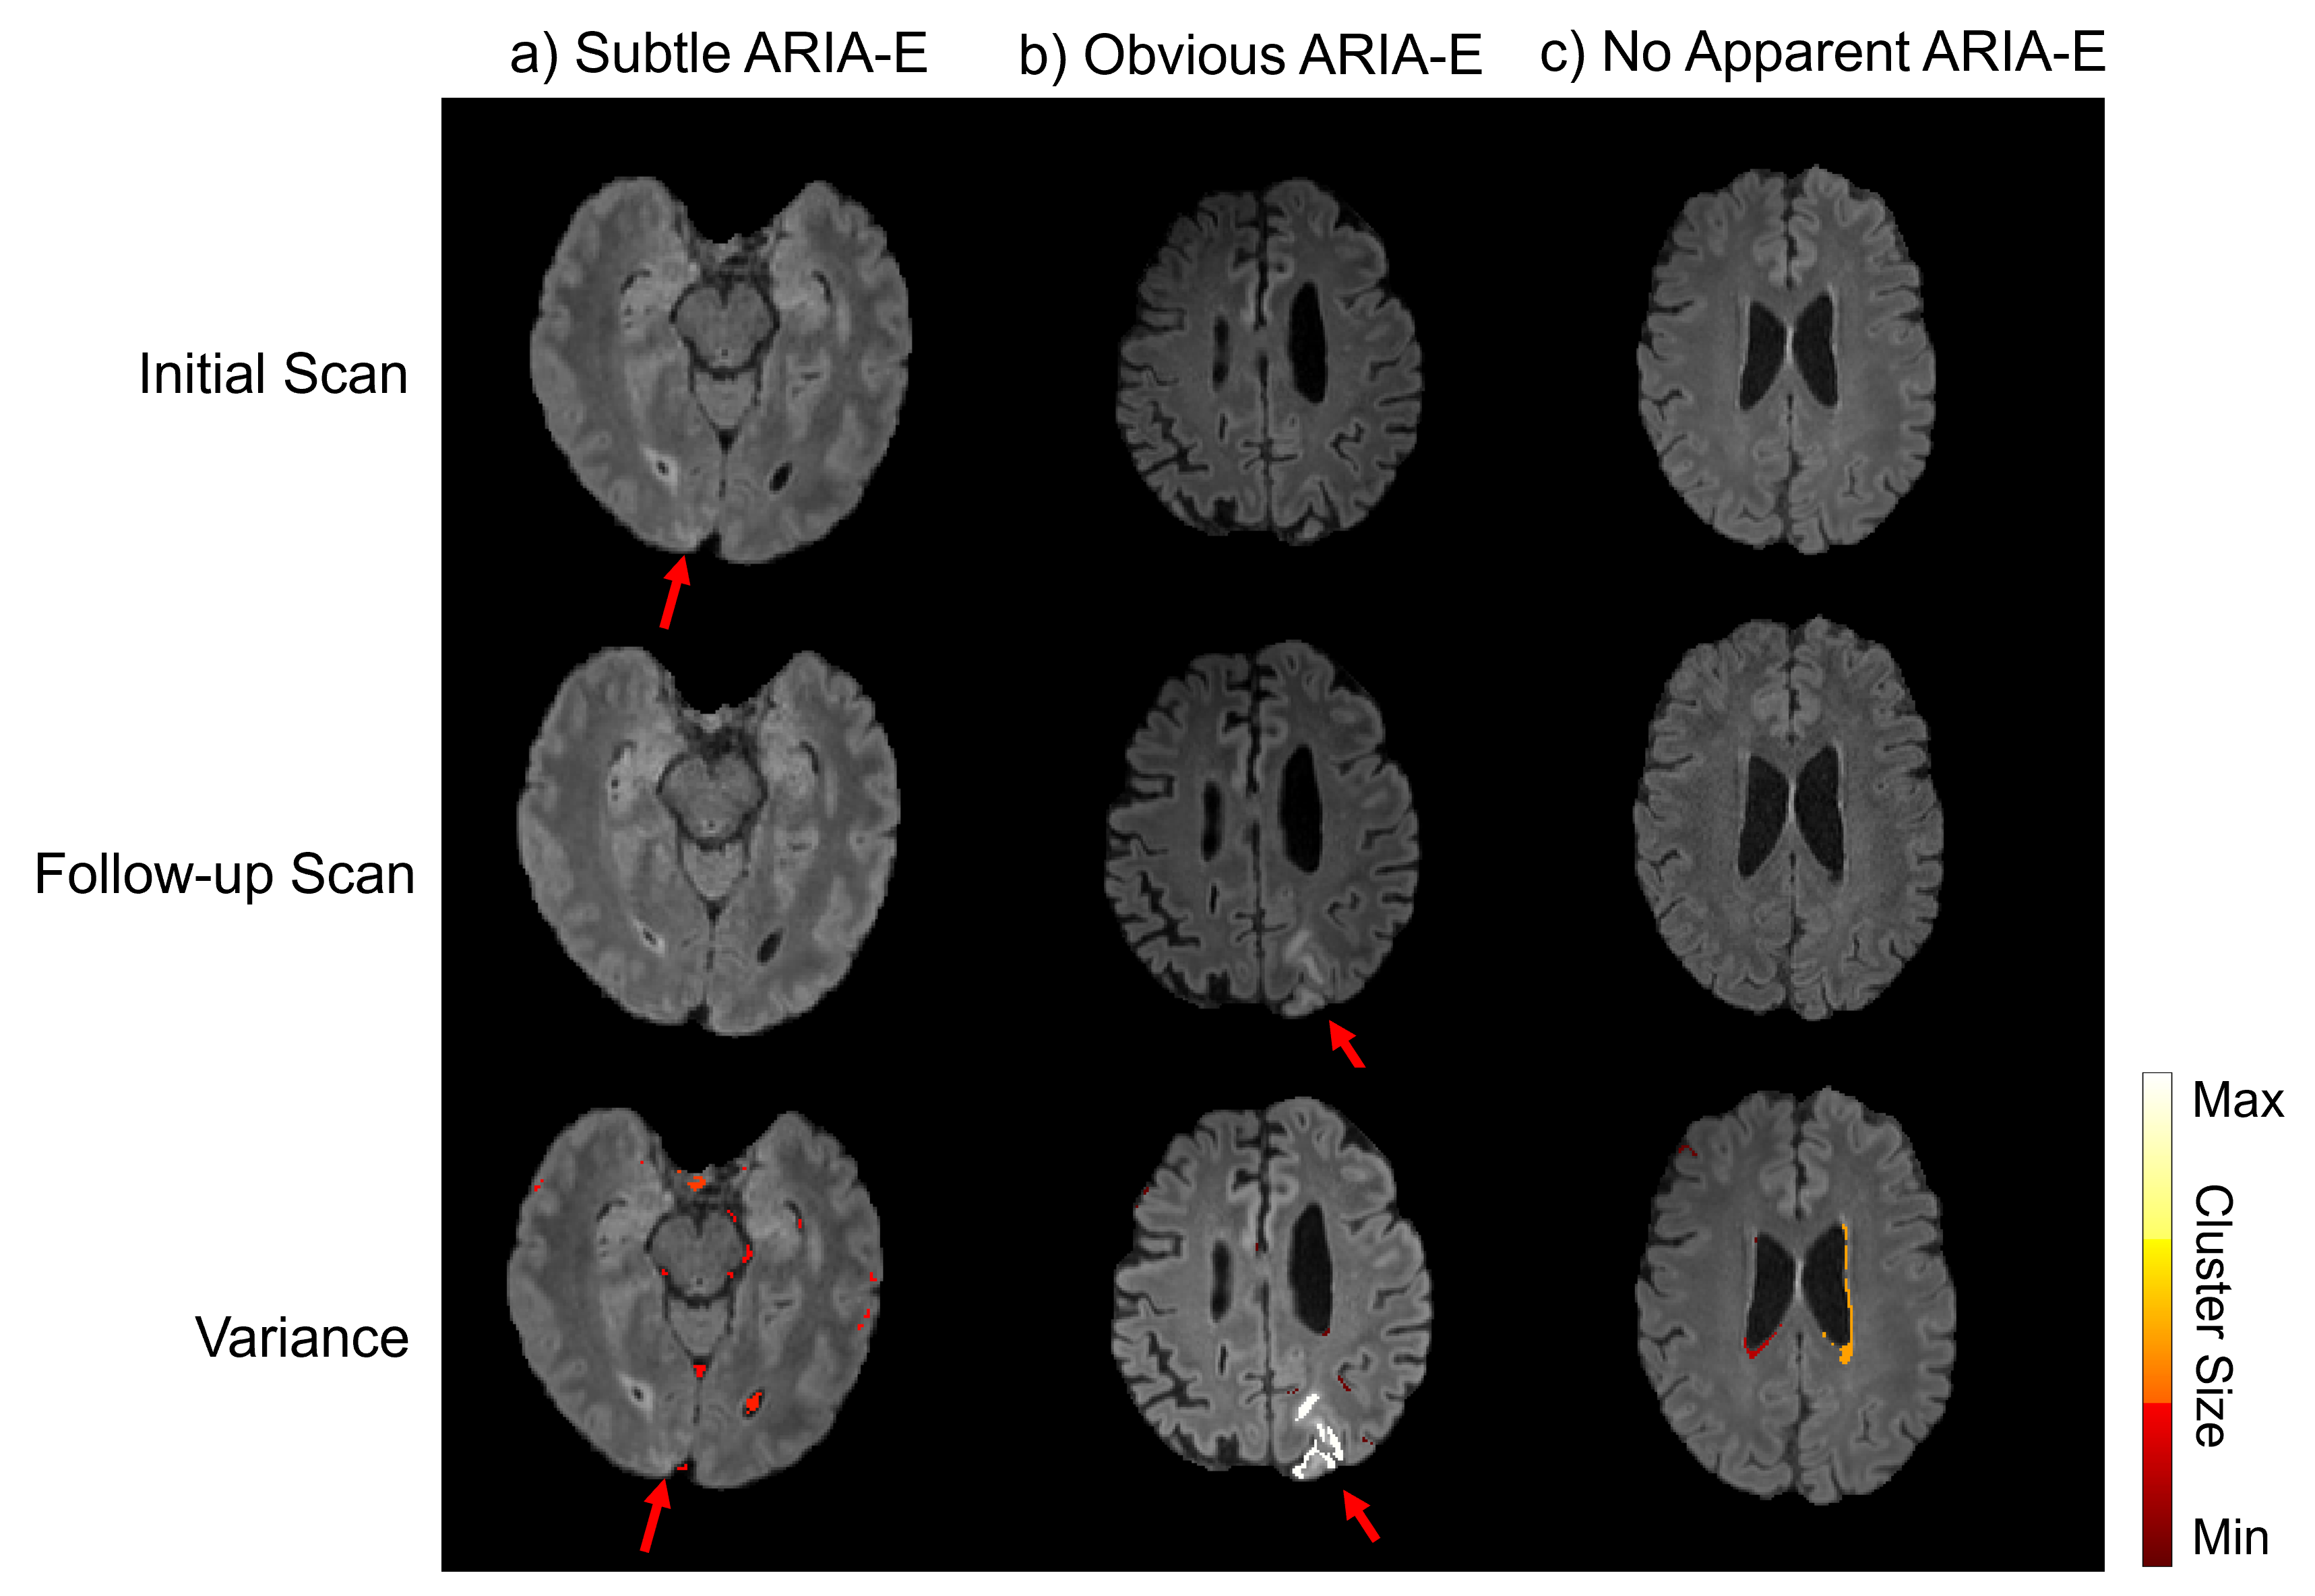
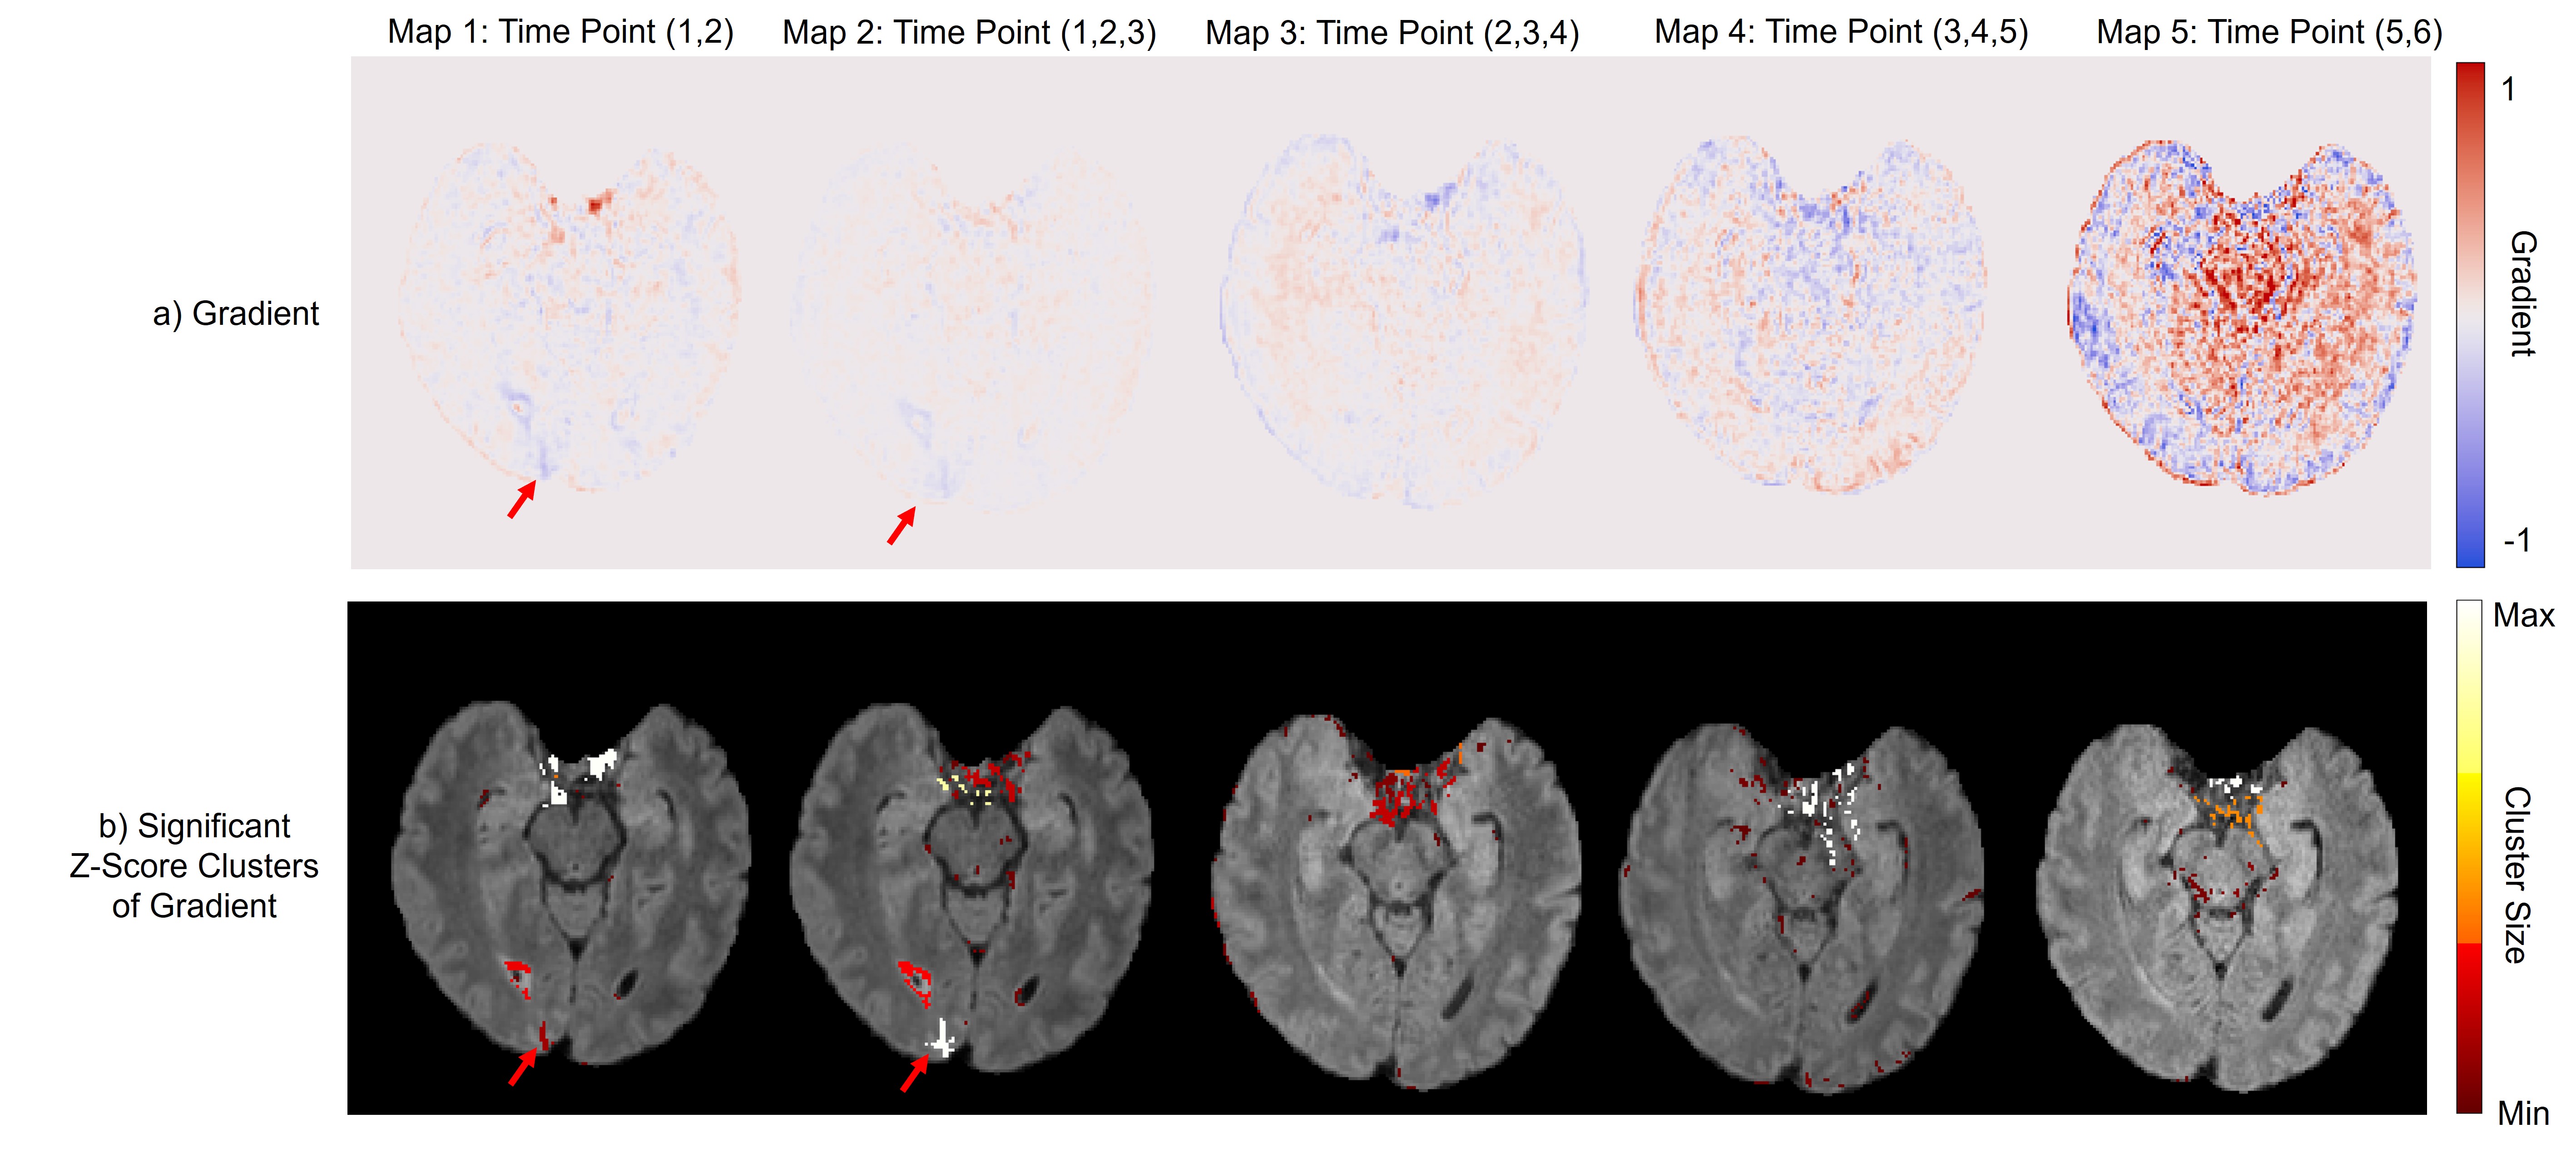
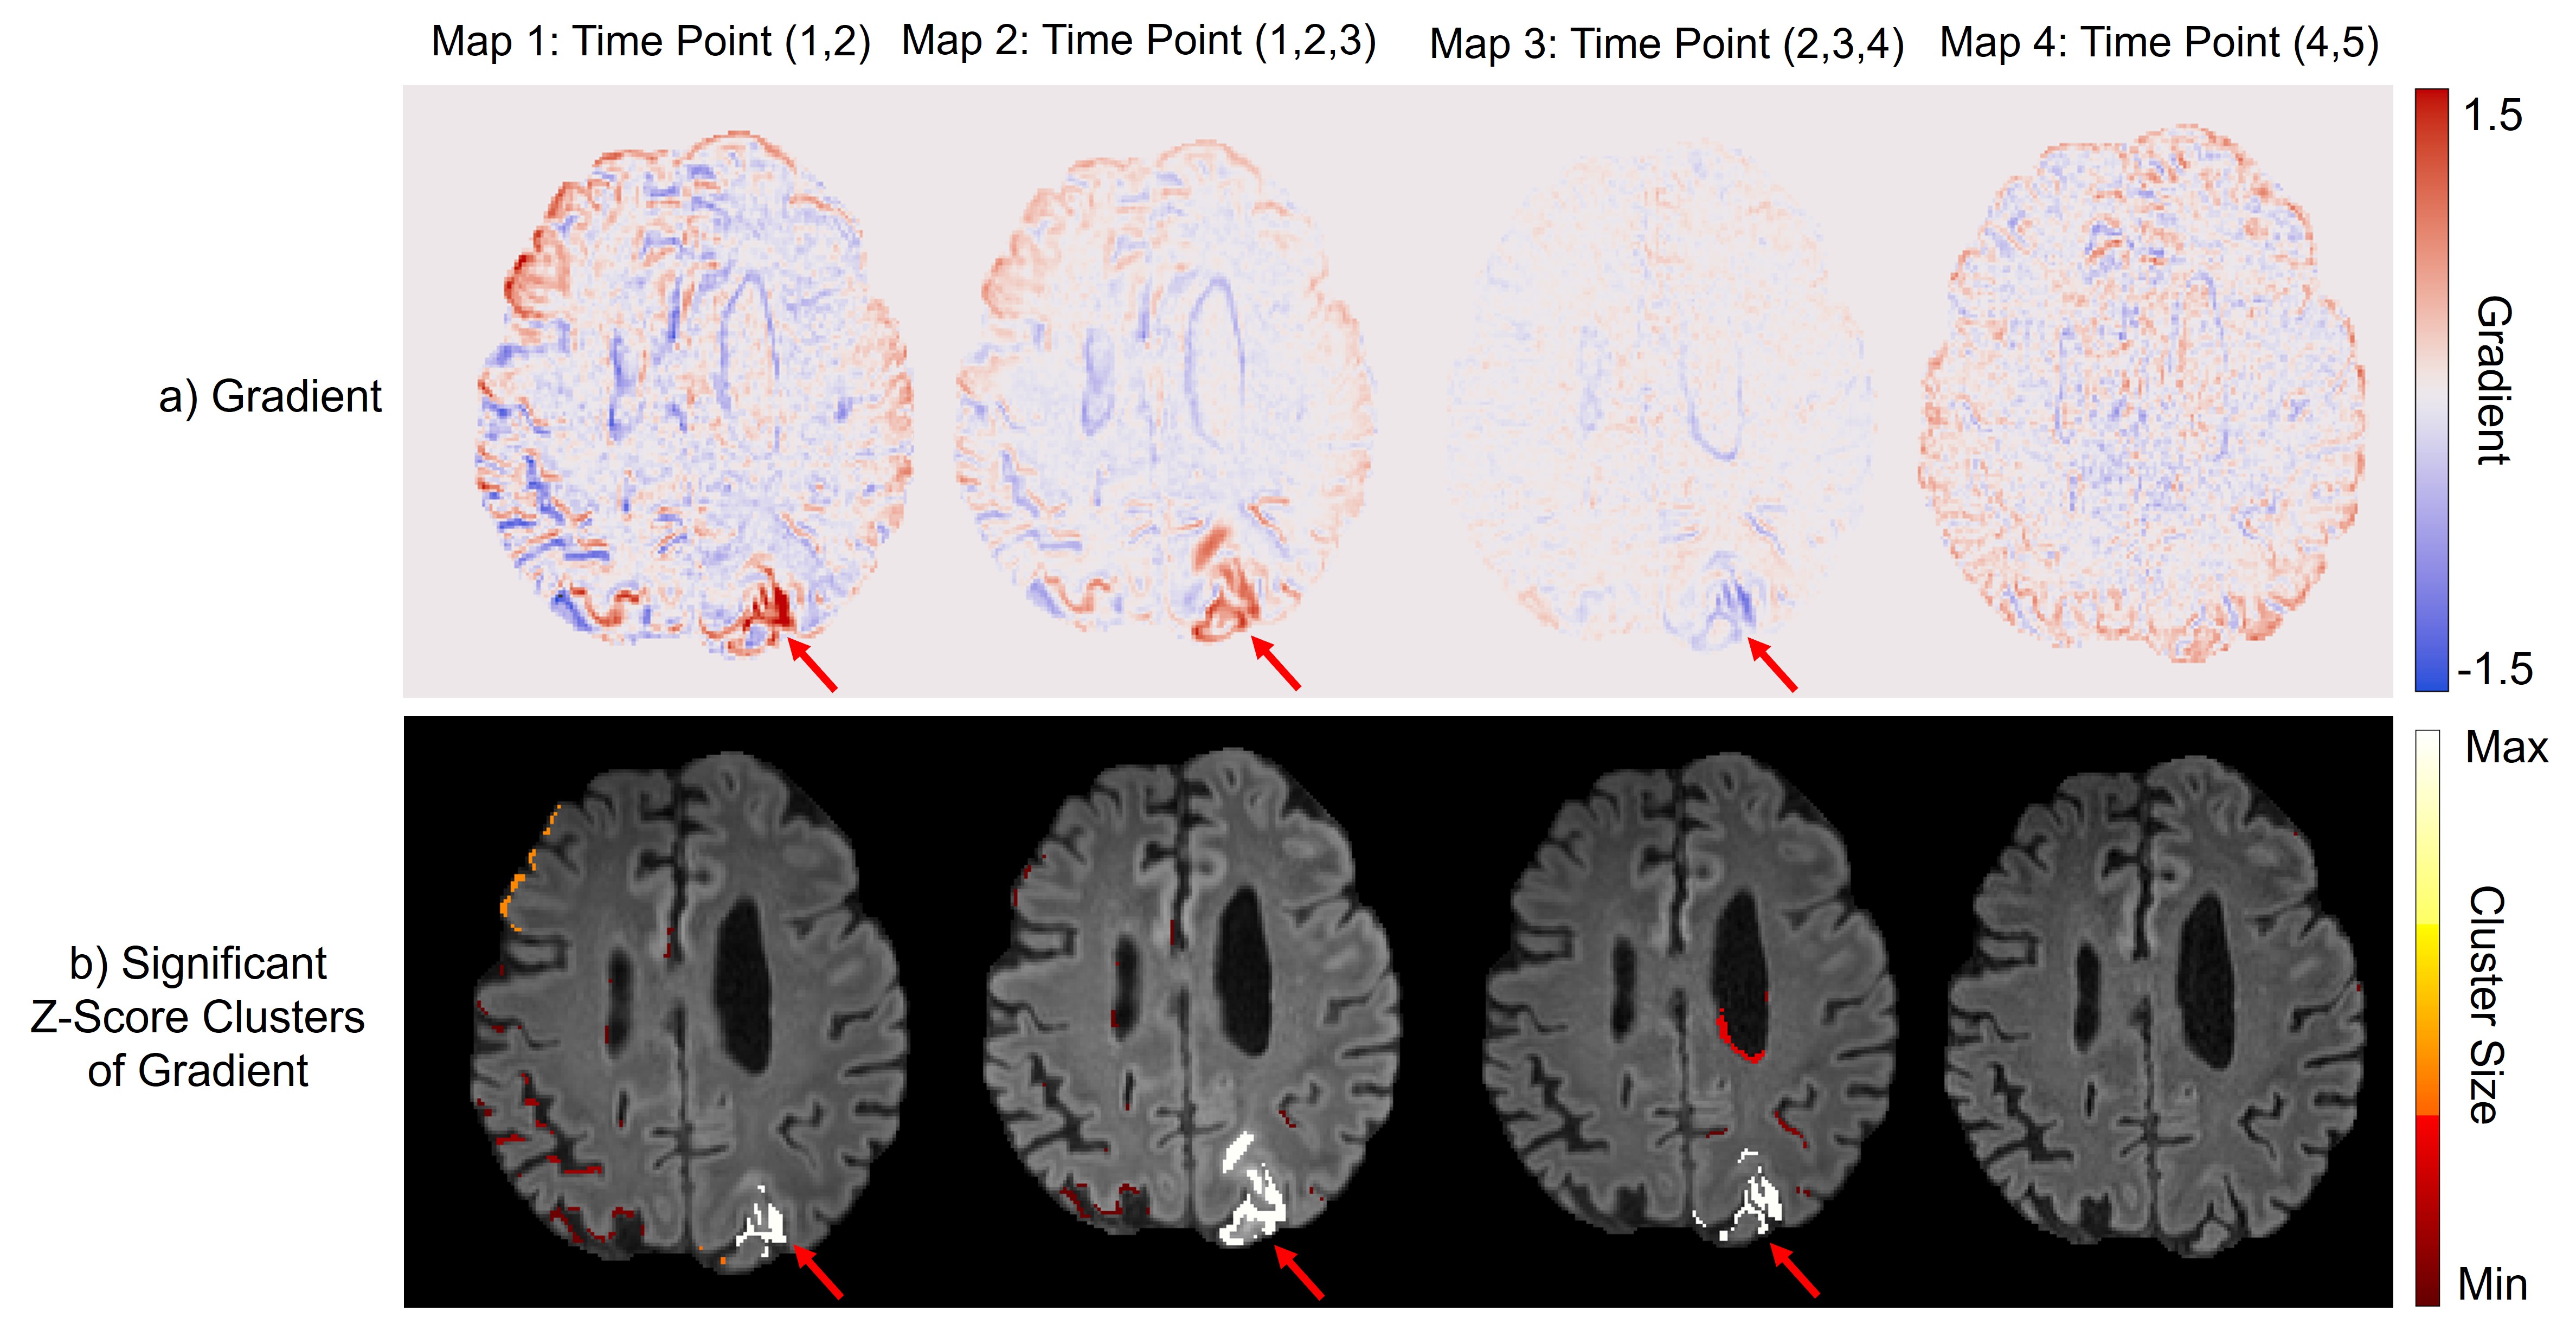
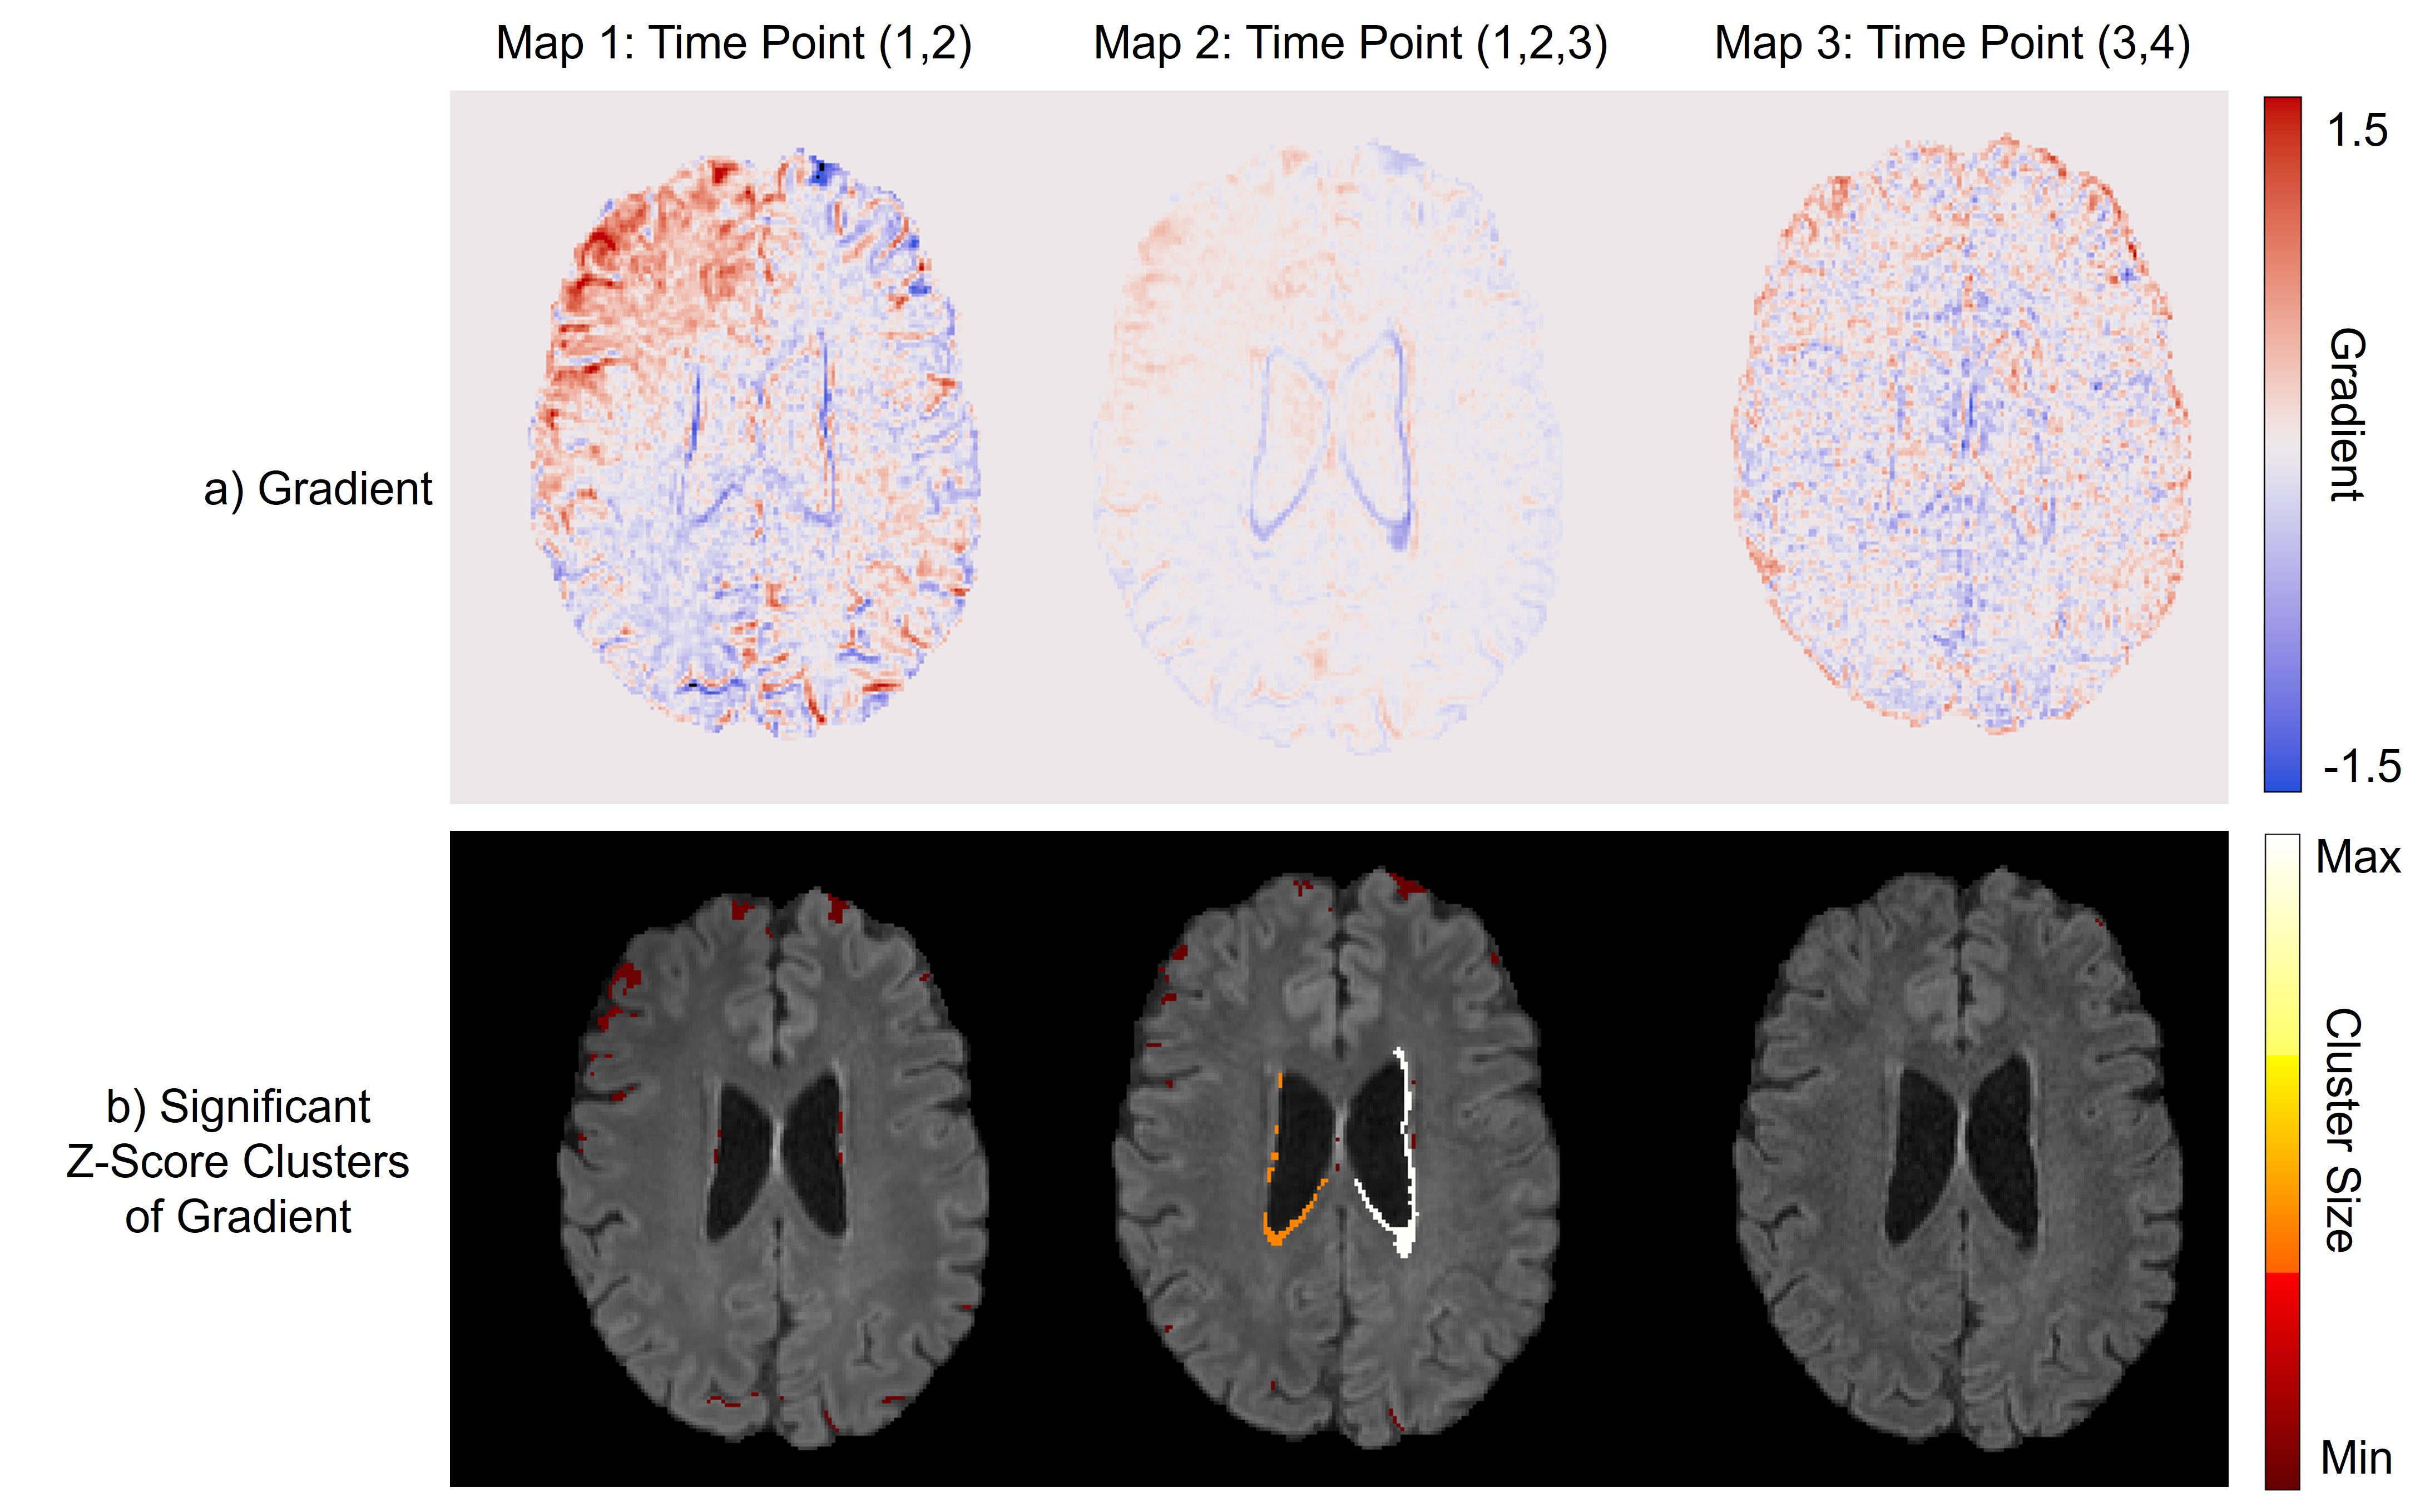
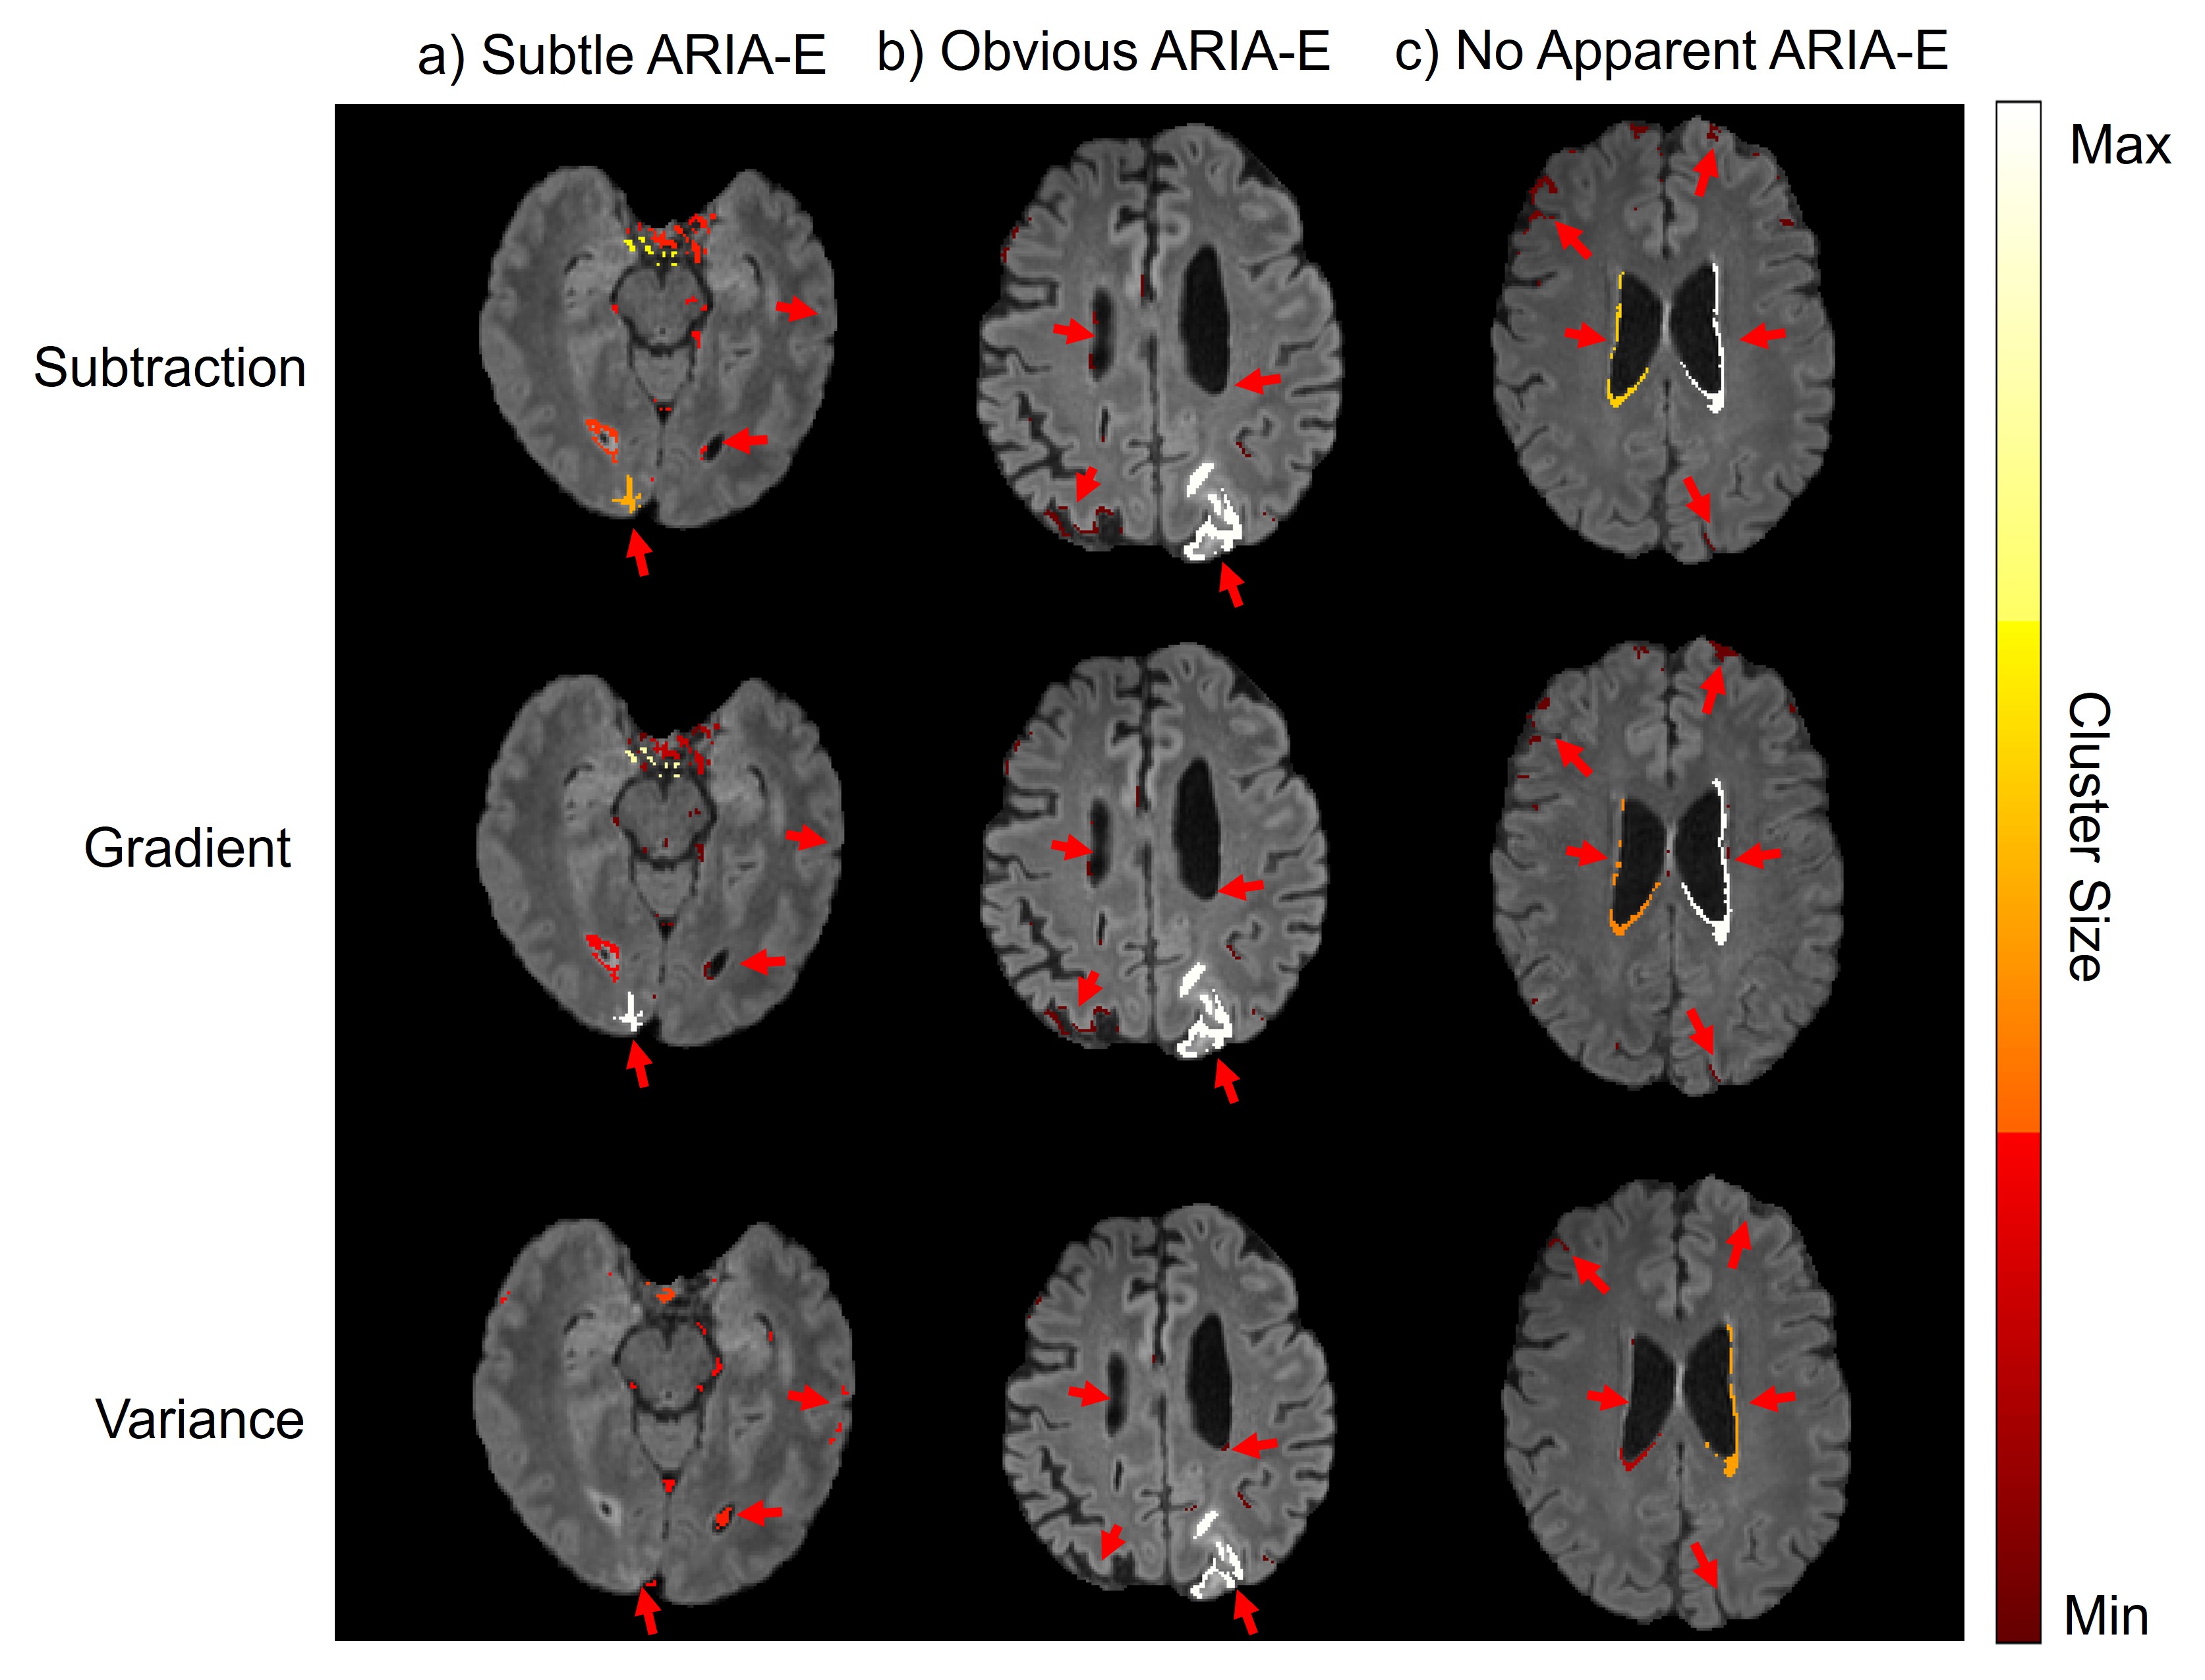
Variance: Figure 1 shows a slice of each subject’s variance map with statistically significant clusters. The clusters identified ARIA-E in the obvious example (Figure 1b). For the subtle case (Figure 1a), the ARIA-E is not highlighted, with significant changes likely due to artefacts in anterior regions. Clusters show increased variance around the ventricles, irrespective of ARIA-E status (Figure 1b-c), potentially reflecting swelling or processing artefact.Gradient: Figures 2-4 highlight the capability of the gradient maps to depict ARIA-E-related changes. Unlike the variance map, significant gradient clusters identify subtle pathology (Figure 2). Changes around the ventricles are seen across cases, as well as clusters around the edges, as was the case for variance analysis.
Figure 5 shows a comparison between our methods and subtraction. The subtraction and gradient maps are similar, although the ARIA-E clusters are larger in the latter. The variance maps show fewer significant regions, where the inclusion of more scans could reduce false positives.
Discussion
We present two quantitative methods for tracking ARIA-E. This analysis provides insight into the changes across the brain, which may indicate further tissue alteration (e.g. swelling) beyond the localised hyperintensity.The variance maps are susceptible to noise, particularly in the frontal lobe (Figure 1a), likely due to eyeball movement or CSF motion. In the subtle case (Figure 1a), some scans suffer from motion noise or poor SNR, leading to ARIA-E variance being sub-threshold.
Long intervals between scans can lead to observation of changes due to AD progression (potentially the cause of the ventricular changes observed in Figure 4b), or introduce large interpolations in daily intensity change, leading to an underestimation in the gradient of change. These quantitative maps exhibit false positives, as a result of image artefacts or misregistration, necessitating further investigation.
Conclusion
We provide novel methods for obtaining quantitative maps for visualising ARIA-E while demonstrating feasibility in subjects with varying degrees of abnormality. These variance and gradient maps offer insight into temporal changes by considering multiple scans, which could ease the increasing burden of ARIA-E detection in clinical trials and clinics, especially because we have verified using ultra-rapid acquisitions. Future work should involve cluster-level statistics, symmetrical registration between scans for tracking, noise mitigation, and more sophisticated gradient map computation.Acknowledgements
This research is supported by the EPSRC-funded UCL Centre for Doctoral Training in Intelligent, Integrated Imaging in Healthcare (i4health) [EP/S021930/1]; the Department of Medical Physics and Biomedical Engineering at University College London; the Alzheimer’s Society (grant number 577 [AS-PG-21-045]); and Biogen Idec UK.References
1. Cummings J. Anti-Amyloid Monoclonal Antibodies are Transformative Treatments that Redefine Alzheimer’s Disease Therapeutics. Drugs. 2023;83(7):569-576. doi:10.1007/s40265-023-01858-9
2. Sperling RA, Jack CR, Black SE, et al. Amyloid-related imaging abnormalities in amyloid-modifying therapeutic trials: Recommendations from the Alzheimer’s Association Research Roundtable Workgroup. Alzheimer’s & Dementia. 2011;7(4):367-385. doi:10.1016/j.jalz.2011.05.2351
3. Barakos J, Purcell D, Suhy J, et al. Detection and Management of Amyloid-Related Imaging Abnormalities in Patients with Alzheimer’s Disease Treated with Anti-Amyloid Beta Therapy. J Prev Alz Dis. 2022. doi:10.14283/jpad.2022.21
4. Martens RM, Bechten A, Ingala S, et al. The value of subtraction MRI in detection of amyloid-related imaging abnormalities with oedema or effusion in Alzheimer’s patients: An interobserver study. Eur Radiol. 2018;28(3):1215-1226. doi:10.1007/s00330-017-5022-6
5. Isensee F, Schell M, Pflueger I, et al. Automated brain extraction of multisequence MRI using artificial neural networks. Human Brain Mapping. 2019;40(17):4952-4964. doi:10.1002/hbm.24750
6. Jenkinson M, Smith S. A global optimisation method for robust affine registration of brain images. Medical Image Analysis. 2001;5(2):143-156. doi:10.1016/S1361-8415(01)00036-6
7. Jenkinson M, Beckmann CF, Behrens TEJ, Woolrich MW, Smith SM. FSL. NeuroImage. 2012;62(2):782-790. doi:10.1016/j.neuroimage.2011.09.015
8. Jenkinson M, Bannister P, Brady M, Smith S. Improved Optimization for the Robust and Accurate Linear Registration and Motion Correction of Brain Images. NeuroImage. 2002;17(2):825-841. doi:10.1006/nimg.2002.1132
9. Zhang Y, Brady M, Smith S. Segmentation of brain MR images through a hidden Markov random field model and the expectation-maximization algorithm. IEEE Trans Med Imaging. 2001;20(1):45-57. doi:10.1109/42.906424
10. Valdés Hernández MDC, González-Castro V, Ghandour DT, et al. On the computational assessment of white matter hyperintensity progression: difficulties in method selection and bias field correction performance on images with significant white matter pathology. Neuroradiology. 2016;58(5):475-485. doi:10.1007/s00234-016-1648-3
11. Nyul LG, Udupa JK, Xuan Zhang. New variants of a method of MRI scale standardization. IEEE Trans Med Imaging. 2000;19(2):143-150. doi:10.1109/42.836373
12. Shah M, Xiao Y, Subbanna N, et al. Evaluating intensity normalization on MRIs of human brain with multiple sclerosis. Medical Image Analysis. 2011;15(2):267-282. doi:10.1016/j.media.2010.12.003
Figures