0765
Automated VOI analysis of amyloid PET-MRI1Department of Diagnostic Imaging and Nuclear Medicine, Kyoto University Graduate School of Medicine, Kyoto, Japan, 2Department of Clinical Radiology Service, Kyoto University Hospital, Kyoto, Japan, 3Department of Psychiatry, Kyoto University Graduate School of Medicine, Kyoto, Japan, 4Department of Regenerative Systems Neuroscience, Human Brain Research Center, Kyoto University Graduate School of Medicine, Kyoto, Japan, 5Department of Human Health Sciences, Kyoto University Graduate School of Medicine, Kyoto, Japan
Synopsis
Keywords: Software Tools, PET/MR, Amyloid
Motivation: Automated analysis of amyloid PET becomes available, however, these results have not been well analyzed on PET/MRI.
Goal(s): To compare the reference regions and VOIs associated with amyloid positivity between the software and Centiloid project on Amyloid PET/MRI.
Approach: We analyzed Amyloid PET/MRI data of 84 subjects automatically and values, SUVr, Centiloid scale were compared.
Results: The reference VOIs and VOIs associated with amyloid positivity showed good correlation between the software and Centiloid project.
Impact: The values obtained with the automated software on amyloid PET/MRI can be utilized with the other quantitative MR data, which may lead to comprehensive analysis of amyloid deposition.
INTRODUCTION
Abnormal amyloid beta (Aβ) deposition in the brain is considered to be the characteristic finding for Alzheimer’ s spectrum [1]. Amyloid PET imaging can be used for the direct evidence of Aβ, and amyloid positivity determined by amyloid PET or CSF measurement of Aβ1–42 will be required for treatment of therapeutic agents for Alzheimer’s drug [2].Amyloid PET provides information on amyloid deposition, but it is known that about 10% of amyloid PET cases are inconclusive in visual interpretation [3]. Standardized uptake value ratio (SUVr) to the reference regions such as cerebellar hemisphere is usually used as a semi-quantitative evaluation. Since SUVr is affected by the amyloid PET tracers, PET scanners, and imaging protocols, the Centiloid scale was proposed in which 11C-PiB PET data was assumed to be standard method of analysis, a method for scaling other 11C-PiB PET imaging protocols and other 18F-PET tracer imaging to the Centiloid scale [4]. Recently to help readers obtain objective information, software has been developed, and SUVr becomes available easily [5, 6, 7]. However, VOIs and the references regions used in the software are not identical to those used in the Centiloid scale. For the moment, the comparison of the reference regions and VOIs associated with amyloid positivity between the software and Centiloid project has not been performed on PET/MRI. The purpose of this study was to evaluate the difference of them on amyloid PET/MRI.
METHODS
Total 84 subjects were recruited in this study. All subjects underwent amyloid PET/MRI (Signa PET/MR, GE Healthcare, Milwaukee, US) 120 minutes after intravenous injection of 18F-flutemetamol (185 MBq, Vizamil). Details of PET/MRI scan are as follows. 3T PET/MR scanner (Signa PET/MR, GE Healthcare, Waukesha, WI), a 19-channel HNU coil was used. PET data was acquired with the 3D acquisition and list mode for 20 min/bed position (89 slices/bed). PET images were reconstructed with time of flight and ordered subset expectation maximization of 16 subsets and 8 iterations, post-smoothing with a 4-mm Gaussian filter, matrix size, 128 × 128. MR attenuation correction was performed with a 2-point Dixon 3D T1-weighted fast SPGR sequence (TR/TE1/TE2, 4.0/1.1/2.2 ms; FOV, 50 × 37.5 cm; matrix, 256 × 128; slice thickness/spacing, 5.2/2.6 mm; 120 image/slab; acquisition time, 18 s) and ZTE sequence for bone identification.Analysis was performed with (VIZCalc included in medi+FALCON ver.1.3, Nihon Medi-Physics Co.,Ltd., Tokyo, Japan). VOIs for the Centiloid scale was created by using the open data source of Centiloid project (https://www.gaaindata.org/data/centiloid/Centiloid_Std_VOI.zip). According to the instructions of the training program for 18F-flutemetamol, the reference region was scaled to the 90% values of pons, therefore, the reference region in VIZCalc was set to the pons. SUVr of following VOIs based on Talairach Daemon were also measured (frontal lobe, parietal lobe, temporal lobe, occipital lobe, posterior cingulate, precuneus, basal ganglia, cerebellum). The composite VOI used for diagnosis of amyloid positivity was created using these VOIs. (i) Composite VOIs and Centiloid VOI, (ii) The difference of reference VOIs (whole cerebellum, cerebellar gray matter, pons, whole cerebellum and brainstem).
RESULTS
The demographics of subjects were shown in Table 1.Representative cases are shown in Figure 1.
SUVr of each VOI of VIZCalc were shown in Figure 2.
(i) Composite VOIs of VIZCalc were correlated well with Centilod VOI (R² = 0.98), especially in the subjects with lower values of VOIs (Figure 3). SUVr of composite VOI were correlated with Centiloid scale (R² = 0.91), especially in the subjects with low Centiloid scale (Figure 3).
(ii) Reference VOIs were compared with corresponding Centiloid VOIs. The values were higher in order of pons, whole cerebellum and brainstem, whole cerebellum, and cerebellar gray matter (Figure 4). These reference VOIs were relatively proportionate to the Centiloid VOI in the subjects with lower value, however, slight disproportionate relationship was observed in subjects with higher values of Centiloid VOI (Figure 4). When reference VOIs were compared with Centiloid scale, relatively constant values were observed except a few outlier cases (Figure 4).
DISCUSSION
SUVr is calculated by dividing VOIs by the reference VOI, and Centiloid scale is calculated with linear equation using SUVr. The value of reference VOI affects may affect both SUVr and Centiloid scale. Unproportionate low value of reference VOI may lead to high SUVr and high Centiloid scale. However, in amyloid-positive patients, unexpectedly high values may be observed in the cerebral cortex, requiring careful observation.CONCLUSION
The reference VOIs and VOIs associated with amyloid positivity showed good correlation between the software and Centiloid project, which may help diagnosis of amyloid PET in clinical practices.Acknowledgements
N/AReferences
1. Jack CR, Bennett DA, Blennow K, et al. NIA-AA Research Framework: toward a biological definition of Alzheimer ’ s disease. Alzheimers Dement. 2018;14:535-562.
2. van Dyck CH, Swanson CJ, Aisen P, et al. Lecanemab in Early Alzheimer's Disease. N Engl J Med. 2023;388(1):9-21.
3. Son HJ, Oh JS, 1 Oh M, et al. The clinical feasibility of deep learning-based classification of amyloid PET images in visually equivocal cases. Eur J Nucl Med Mol Imaging. 2020;47(2):332-341.
4. Klunk WE, Koeppe RA, Price JC, et al. The Centiloid Project: Standardizing quantitative amyloid plaque estimation by PET. Alzheimers Dement. 2015 Jan; 11(1): 1–15.e4.
5. Imabayashi E et al. Automated semi-quantitative amyloid PET analysis technique without MR images for Alzheimer‘s disease. Ann Nucl Med. 2022 Oct;36(10):865-875.
6. Nai YH, Tay YH, Tanaka T, et al. Comparison of Three Automated Approaches for Classification of Amyloid-PET Images. Neuroinformatics. 2022 Oct;20(4):1065-1075.
7. Venkataraman AV, Bai W, Whittington A, et al. Boosting the diagnostic power of amyloid-β PET using a data-driven spatially informed classifier for decision support. Alzheimers Res Ther. 2021 Nov 10;13(1):185.
Figures
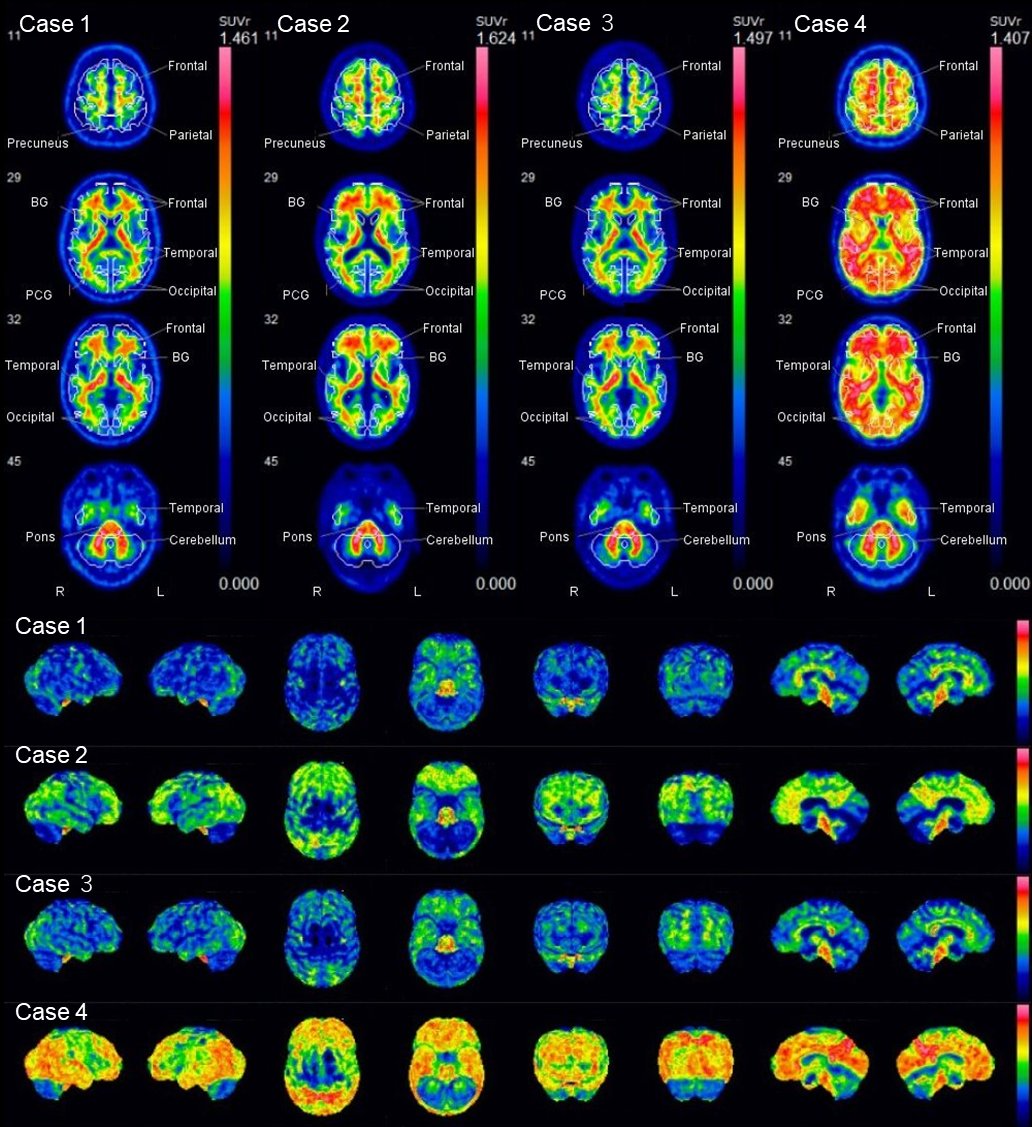
Fig. 1.
Axial images with VOIs (upper row) and surface rendering images (lower row) of VIZCalc are shown. Case 1 and 3 are amyloid negative. Case 2 and 4 are amyloid positive.
Case 1, a 56-year-old male. SUVr of Composite VOI, 0.476; Centiloid scale -11.7.
Case 2, a 79-year-old male. SUVr of Composite VOI, 0.711; Centiloid scale 82.5.
Case 3, a 56-year-old male. SUVr of Composite VOI, 0.517; Centiloid scale -0.6.
Case 4, a 49-year-old female. SUVr of Composite VOI, 0.905; Centiloid scale 76.4.
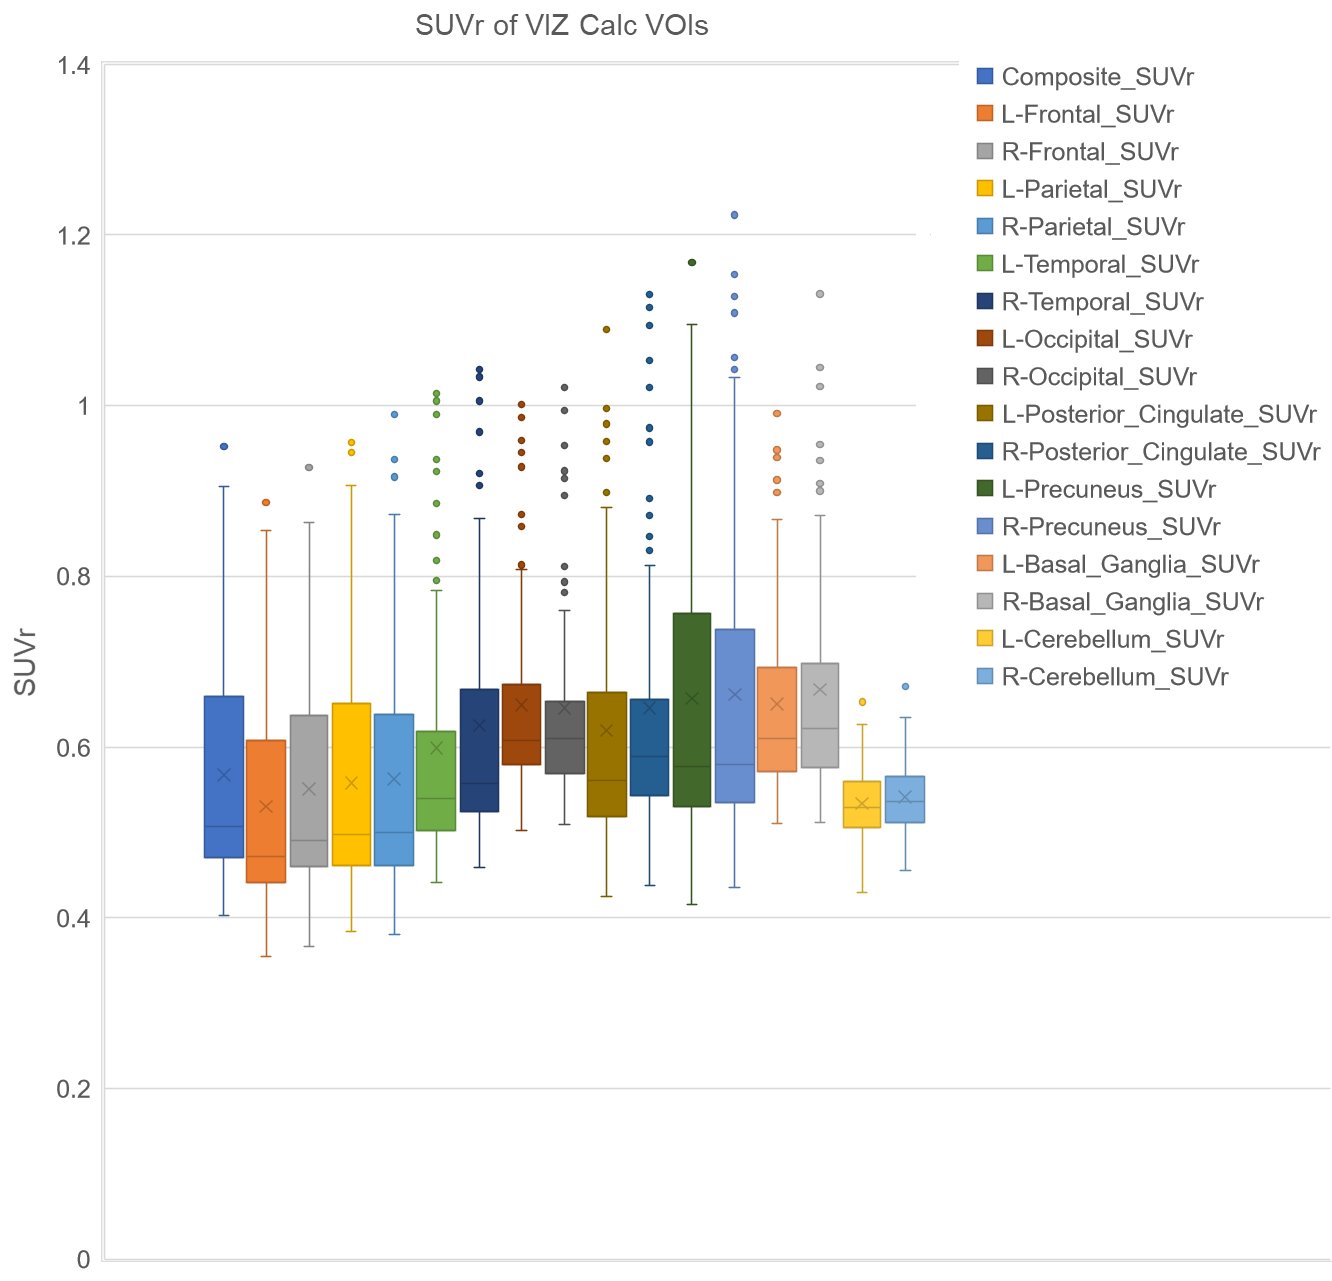
Fig. 2.
Box plots of each VOI are shown. Note that composite VOI represents the average of VOIs (frontal lobe, parietal lobe, temporal lobe, occipital lobe, posterior cingulate, precuneus, basal ganglia, cerebellum).
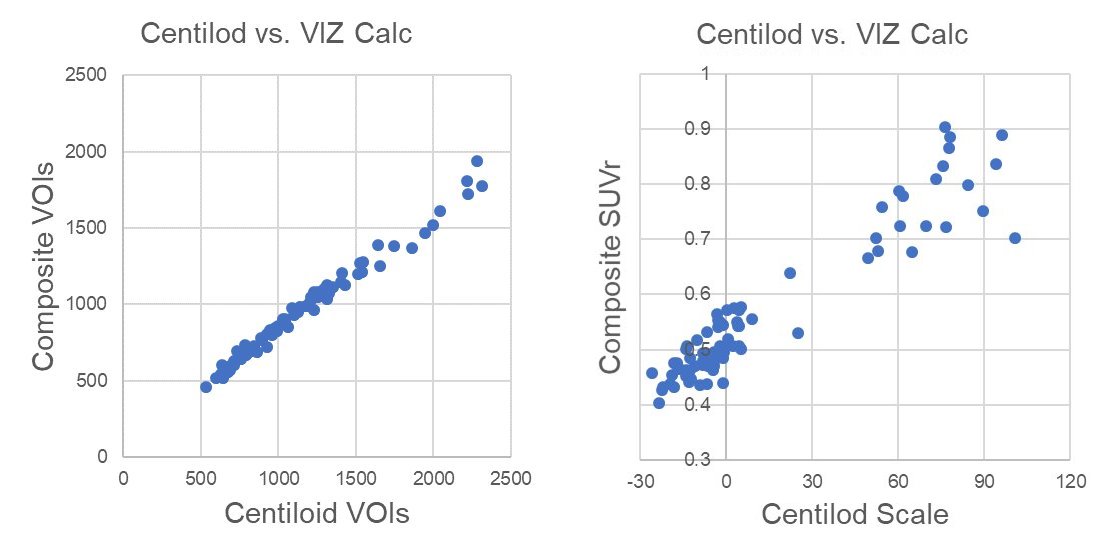
Fig. 3.
Composite VOIs of VIZCalc were correlated well with Centilod VOI (R² = 0.98), especially in the subjects with lower values of VOIs (left). SUVr of composite VOI were correlated with Centiloid scale (R² = 0.91), especially in the subjects with low Centiloid scale (right).
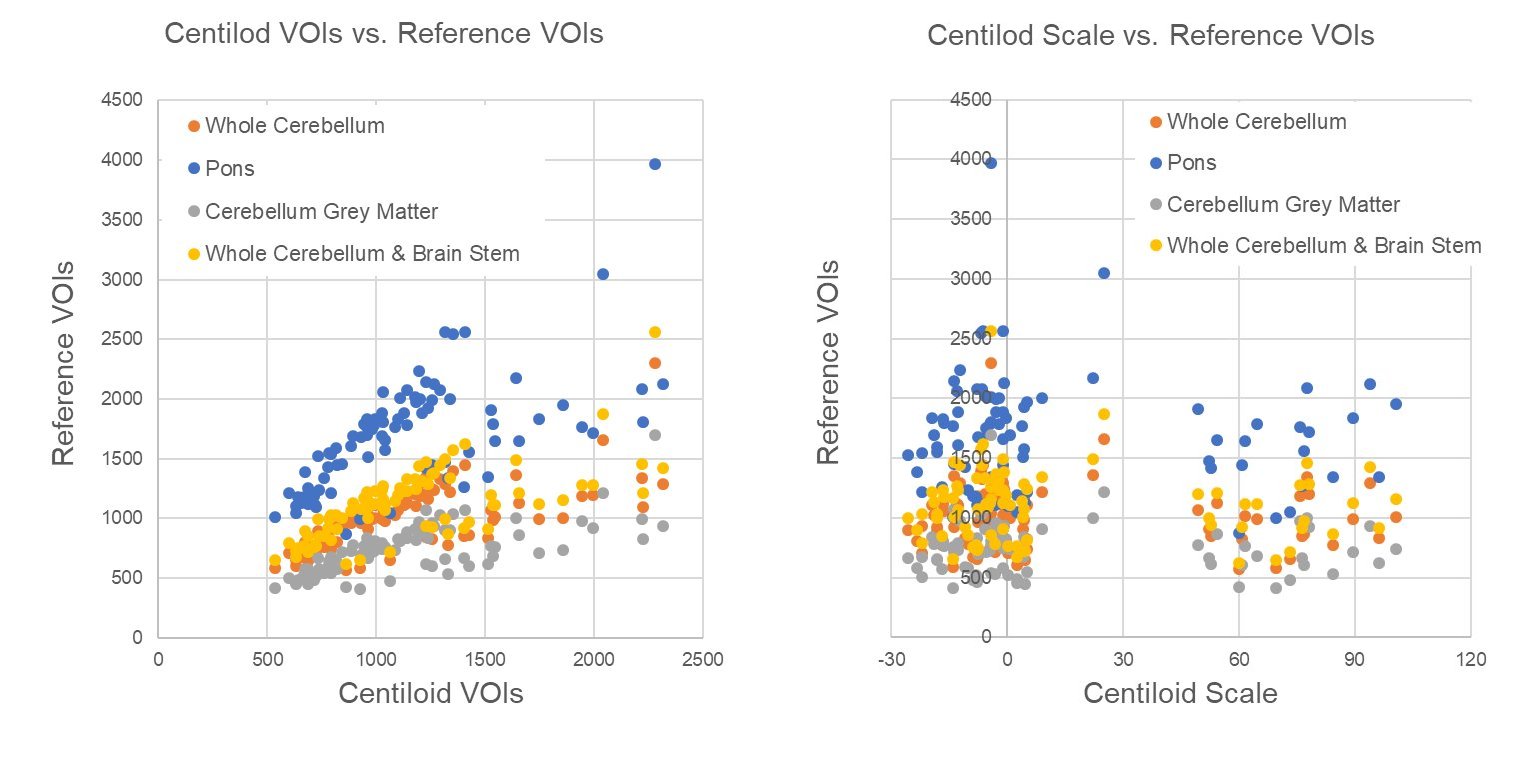
Fig. 4.
Reference VOIs were compared with corresponding Centiloid VOIs (left). The values were higher in order of pons, whole cerebellum and brainstem, whole cerebellum, and cerebellar gray matter (left). These reference VOIs were relatively proportionate to the Centiloid VOI in the subjects with lower value, however, slight disproportionate relationship was observed in subjects with higher values of Centiloid VOI (left). When reference VOIs were compared with Centiloid scale, relatively constant values were observed except a few outlier cases (right).
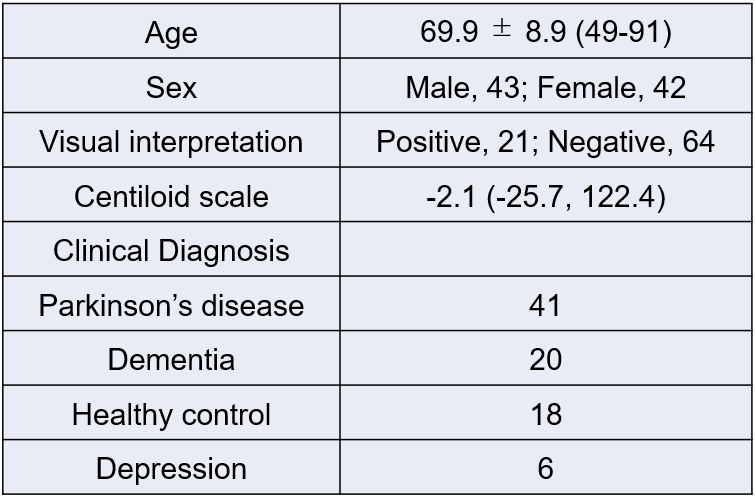
Table 1.
The demographics of subjects were shown.