0761
Intra-Hippocampal Connectivity Differences in Cognitively Normal Subjects with/without Genetic Risk for Alzheimer’s Disease1Brain Imaging and Analysis Center, Duke University, Durham, NC, United States, 2Medical Physics Graduate Program, Duke University, Durham, NC, United States, 3School of Biological and Health Systems Engineering, Arizona State University, Tempe, AZ, United States
Synopsis
Keywords: Structural Connectivity, Brain Connectivity, Hippocampus, APOE4, Streamlines
Motivation: Microstructural changes within the hippocampus, which may occur well before cognitive decline in Alzheimer’s disease (AD), could serve as an early diagnosis biomarker in pre-symptomatic subjects.
Goal(s): We assessed differences in intra-hippocampal connectivity between cognitively normal carriers and non-carriers of the APOE4 allele, a genetic risk factor for AD.
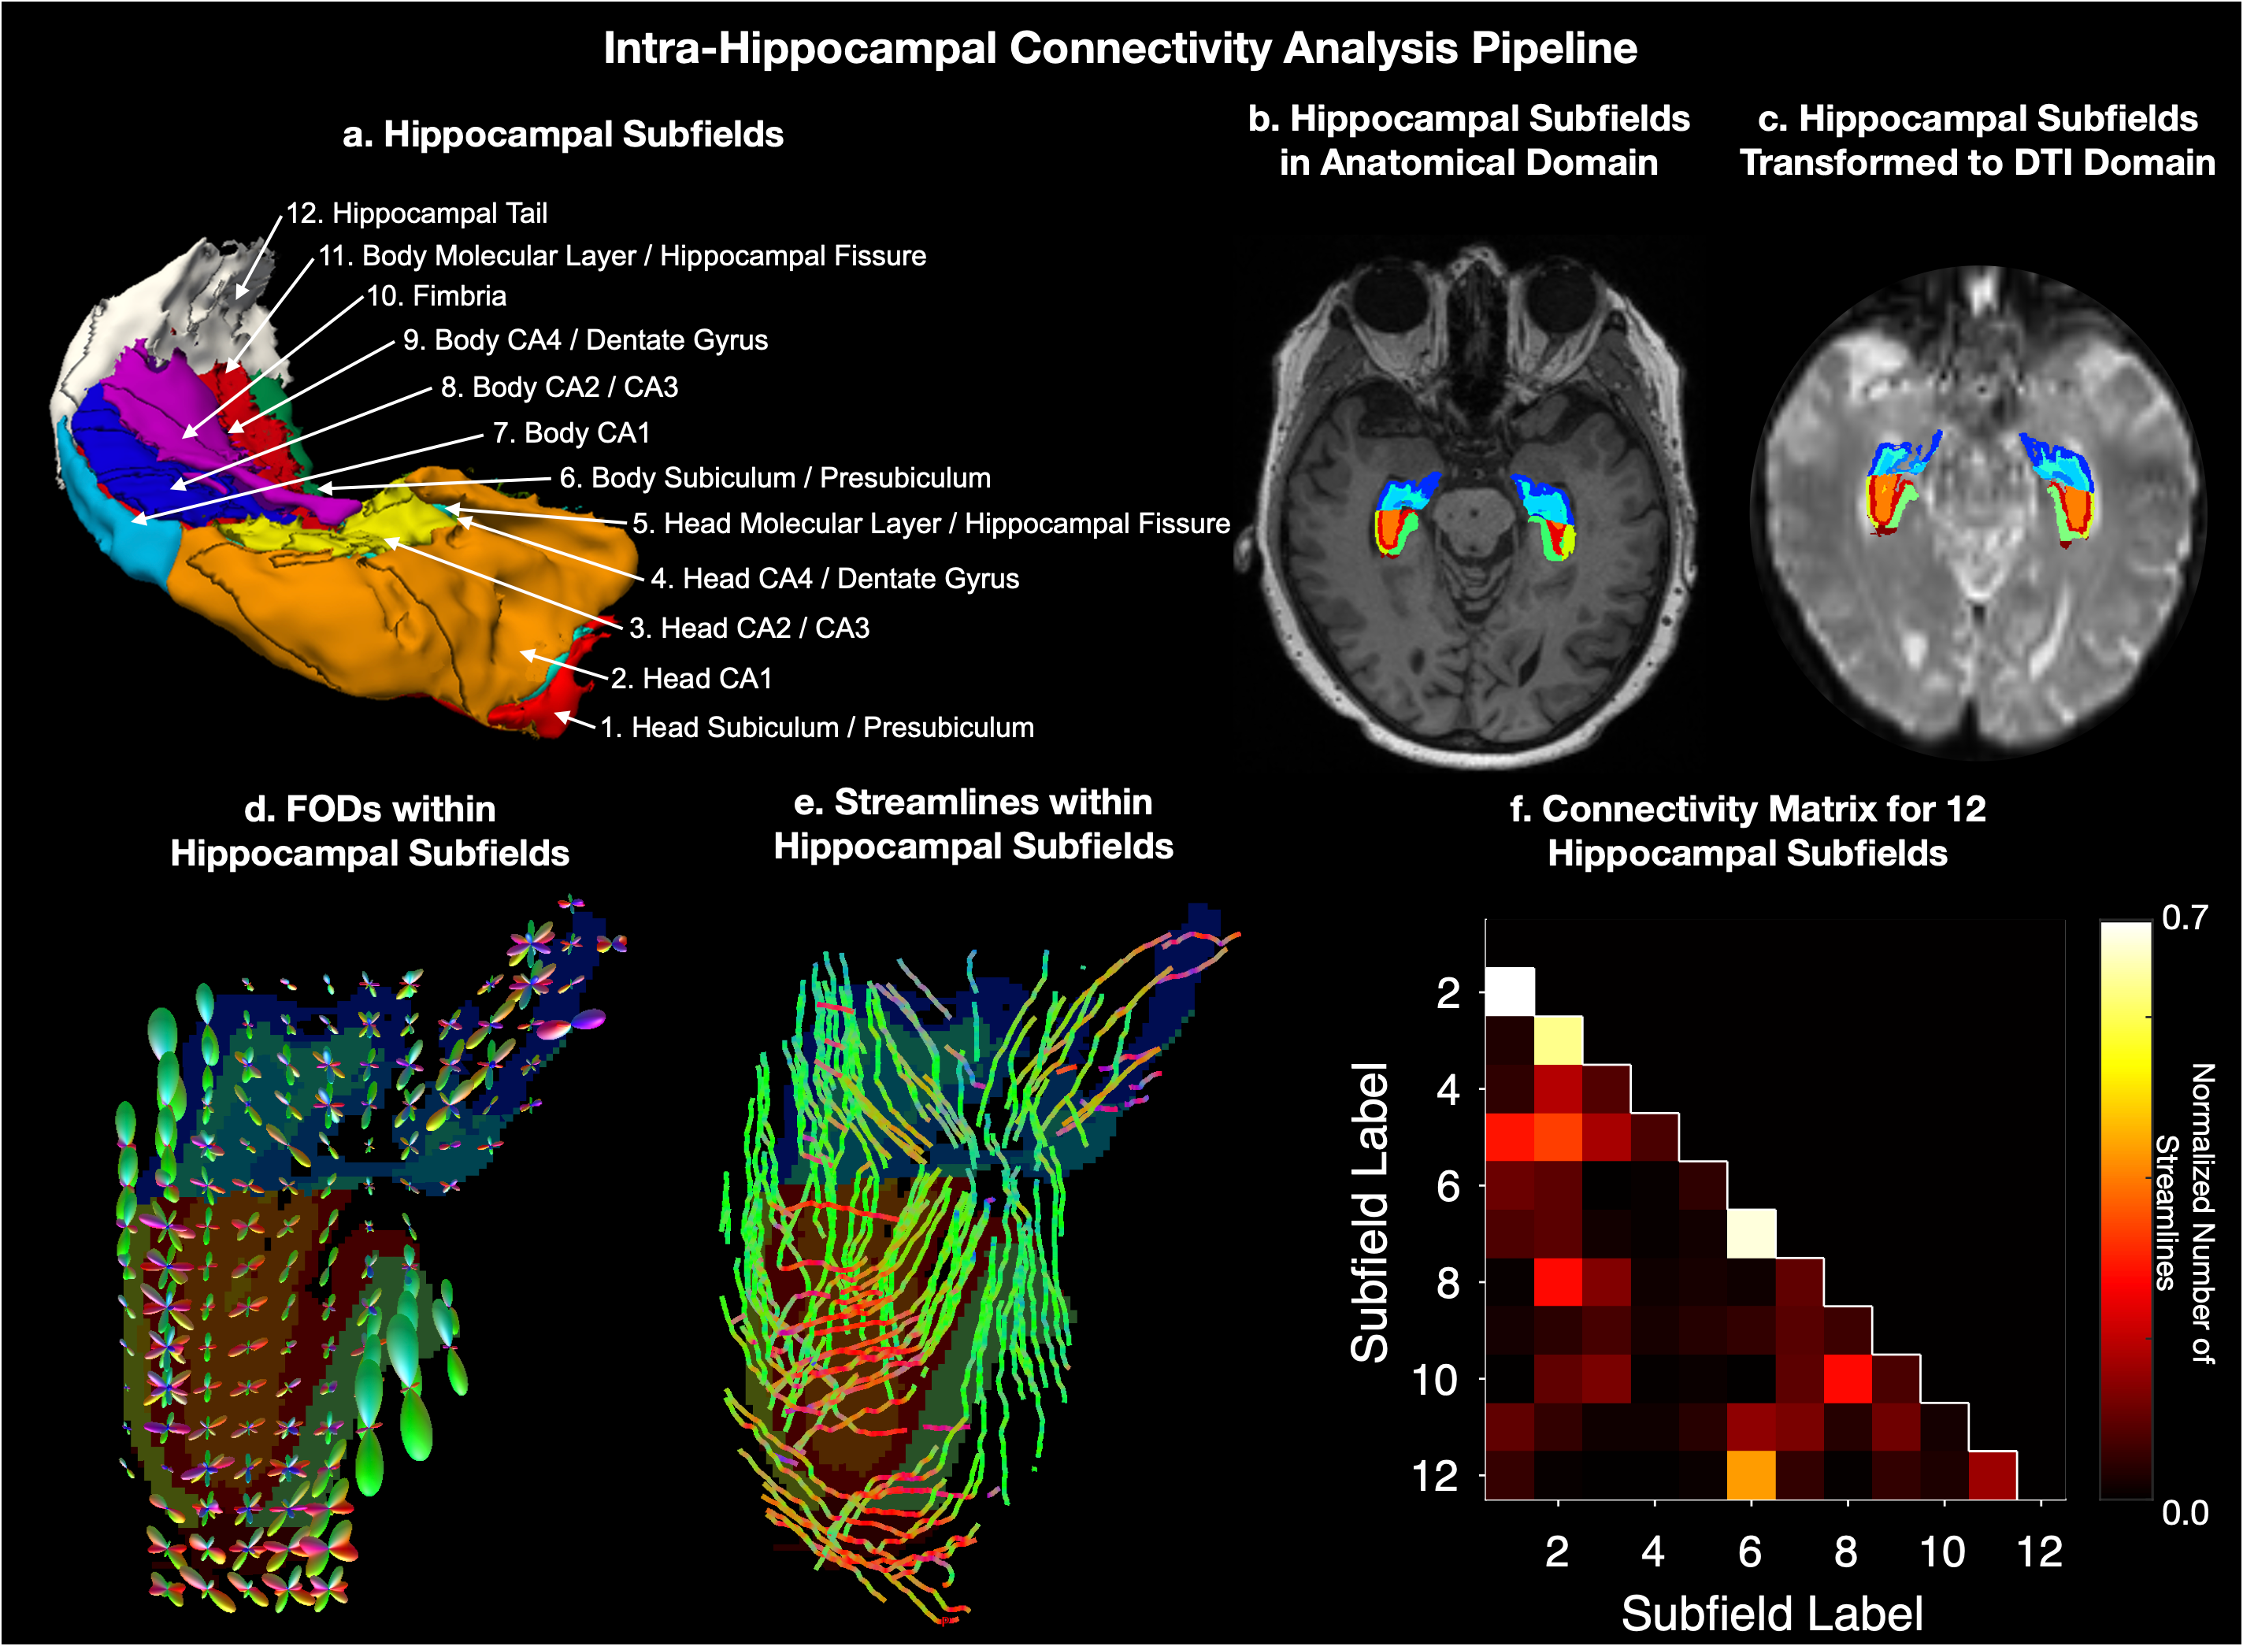
Approach: We segmented the hippocampus into 12 subfields per hemisphere and performed fiber tractography on multi-shell diffusion tensor imaging data to determine the number of streamlines connecting each subfield pair.
Results: 22 subfield pairs had a significantly lower connectivity in the APOE4 carrier group compared to the APOE4 non-carrier group.
Impact: Our analysis shows differences in intra-hippocampal connectivity between cognitively normal subjects with and without a genetic risk factor for Alzheimer’s disease, which could potentially serve as a more definitive biomarker for its early diagnosis and treatment in pre-symptomatic subjects.
Introduction
Neurodegeneration leading to Alzheimer’s disease (AD) starts long before the onset of cognitive decline1, but is not uniformly distributed throughout the brain. Pre-symptomatic AD biomarkers, such as beta-amyloid and tau protein levels or volumetric changes derived from structural MRI, are not sufficiently specific to detect these early microstructural changes2. The hippocampus is especially vulnerable to early neurodegeneration in AD3. Previous studies have used diffusion tensor imaging (DTI) and fiber tractography to investigate the structural connectivity between the hippocampus and other brain regions in vivo4,5, or between different subfields of the hippocampus ex vivo6,7 but few studies have done so in subjects with/at risk for AD or investigated the intra-hippocampal connectivity in vivo.In this study, we assess differences in intra-hippocampal connectivity between age-matched groups of cognitively normal carriers and non-carriers of the apolipoprotein ε4 allele (termed APOE4+ and APOE4-, respectively), a well-established genetic risk factor for developing AD8. Such a non-invasive imaging biomarker could potentially enable the early diagnosis of AD in pre-symptomatic subjects, when the neurodegeneration may be delayed by treatments.
Methods
3T MRI data from 32 APOE4- (21 females, age: 68.9±3.1) and 16 APOE4+ (13 females, age: 67.2±2.7) subjects were obtained from the Alzheimer’s Disease Neuroimaging Initiative (ADNI) data repository (adni.loni.usc.edu)9. T1-weighted anatomical images (1.05 x 1.05 x 1.2 mm) were upsampled to 1-mm isotropic resolution with Freesurfer10 and used to generate 12 hippocampal subfields per hemisphere with HA Segmentation11 (Figure 1a,b). Raw DTI data (2 mm isotropic, 127 volumes with 13x b=0, 6x b=500, 48x b=1000, and 60x b=2000 s/mm2) were pre-processed to correct for susceptibility artifacts, motion, and eddy currents with the synthesized b0 for diffusion distortion correction (Synb0-DISCO)12 algorithm and FSL’s eddy13. After brain extraction with FSL14, the b0 images were registered to the anatomical images with bbregister15 and the inverse of the registration matrix was applied to the hippocampal subfields to transform them to the DTI domain (Figure 1c).To quantify the intra-hippocampal connectivity, the whole-brain response function was calculated16, and fiber orientation distributions (Figure 1d) and streamlines (Figure 1e) were generated within the hippocampal subfields with MRtrix317/iFOD218. The number of streamlines connecting each pair of subfields was calculated with spherical-deconvolution informed filtering of tractograms (SIFT)19 and normalized by the volume of each subfield pair to remove any volumetric bias, resulting in a 12x12 connectivity matrix (Figure 1f).
One-tailed t-tests were performed with R20 between the APOE4- and APOE4+ groups on: 1) the connectivity for each subfield pair (66 per hippocampus) and 2) the connectivity between each subfield and all other subfields (11 per hippocampus).
Results & Discussion
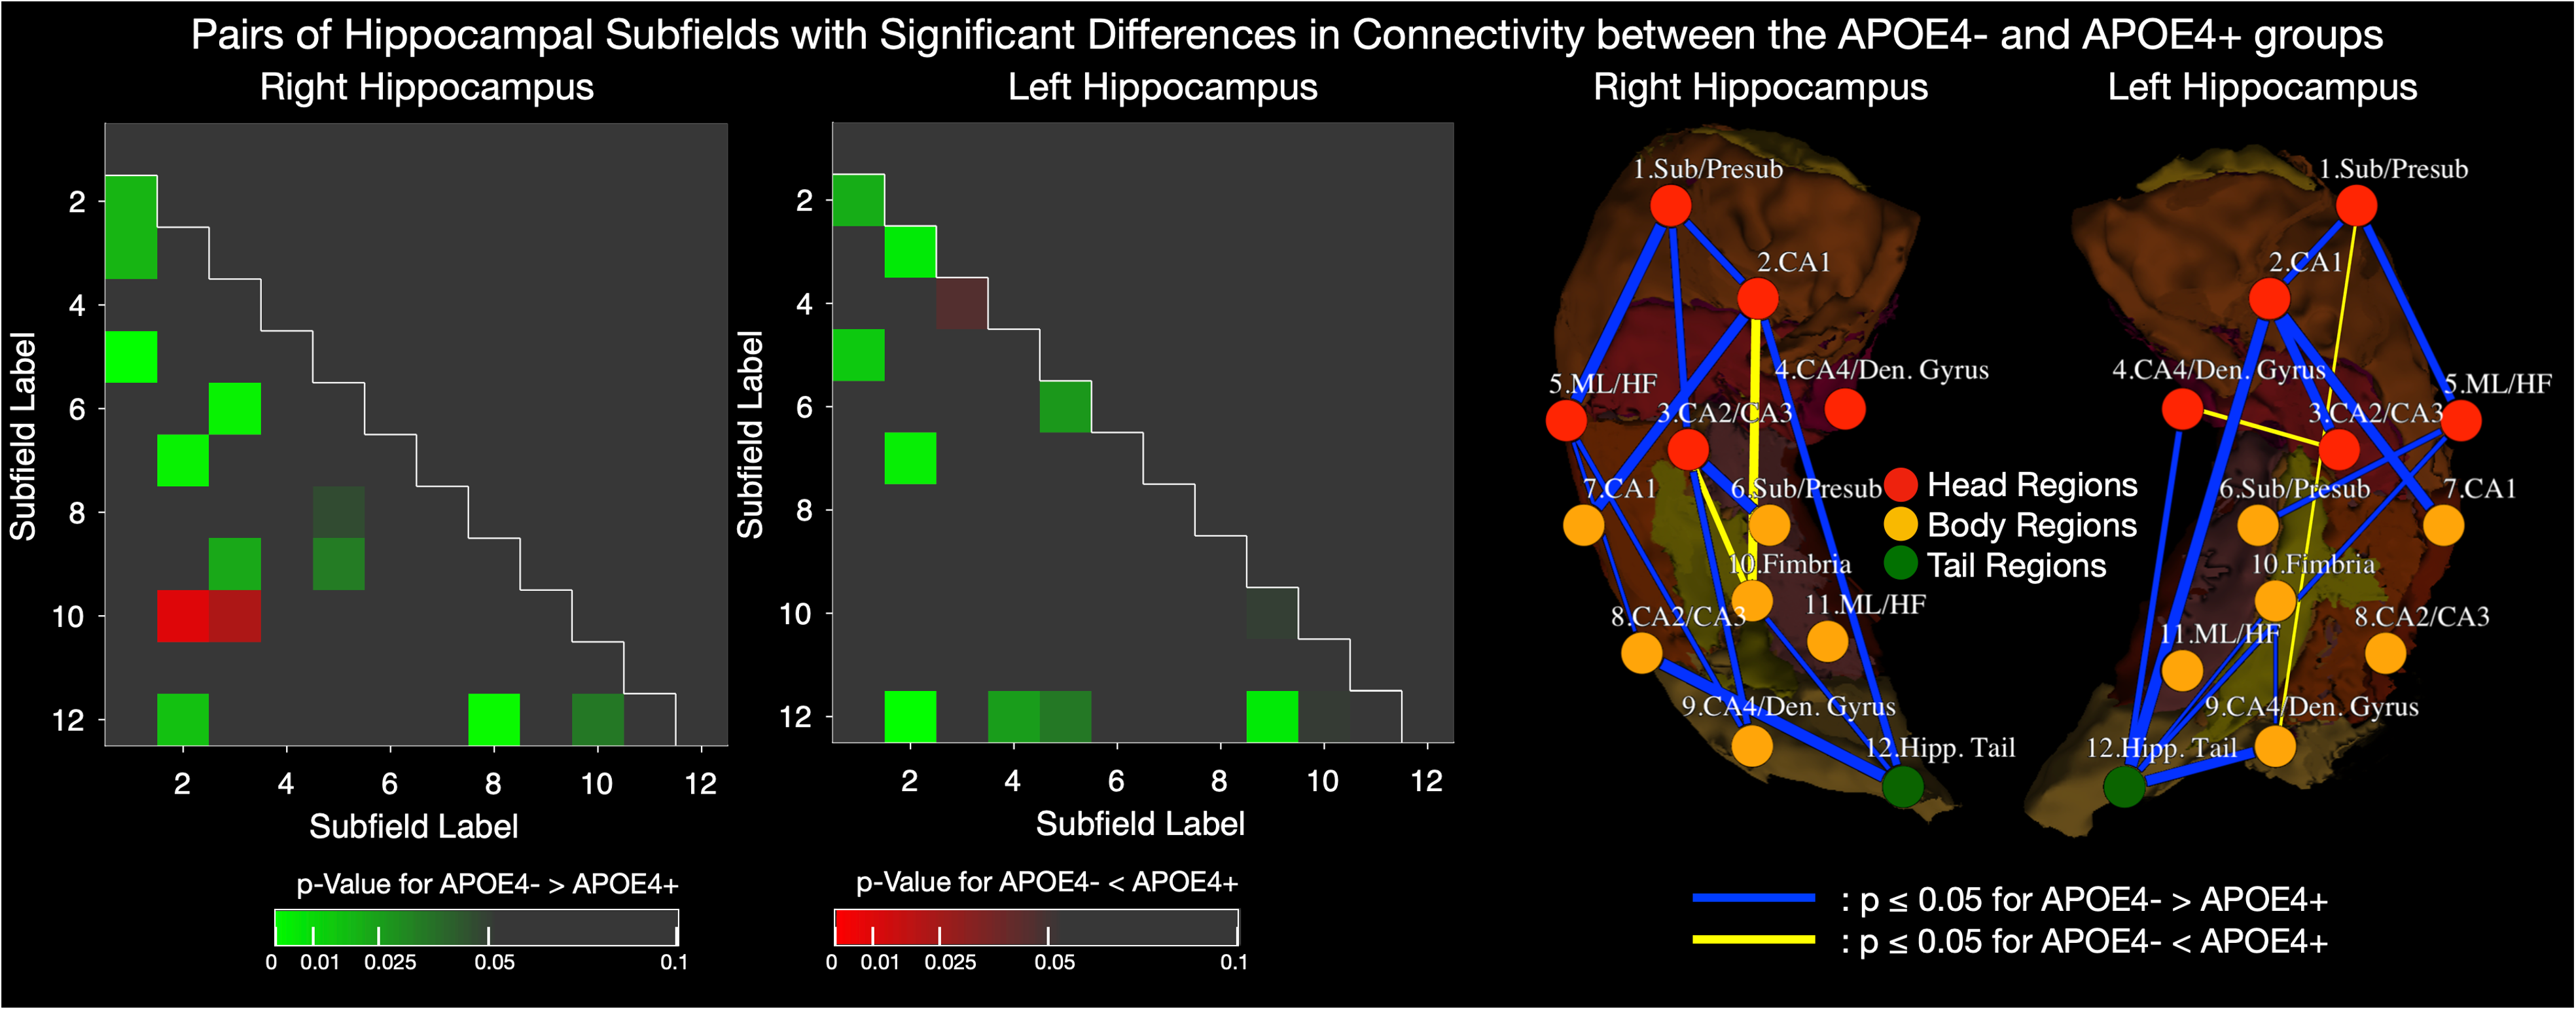
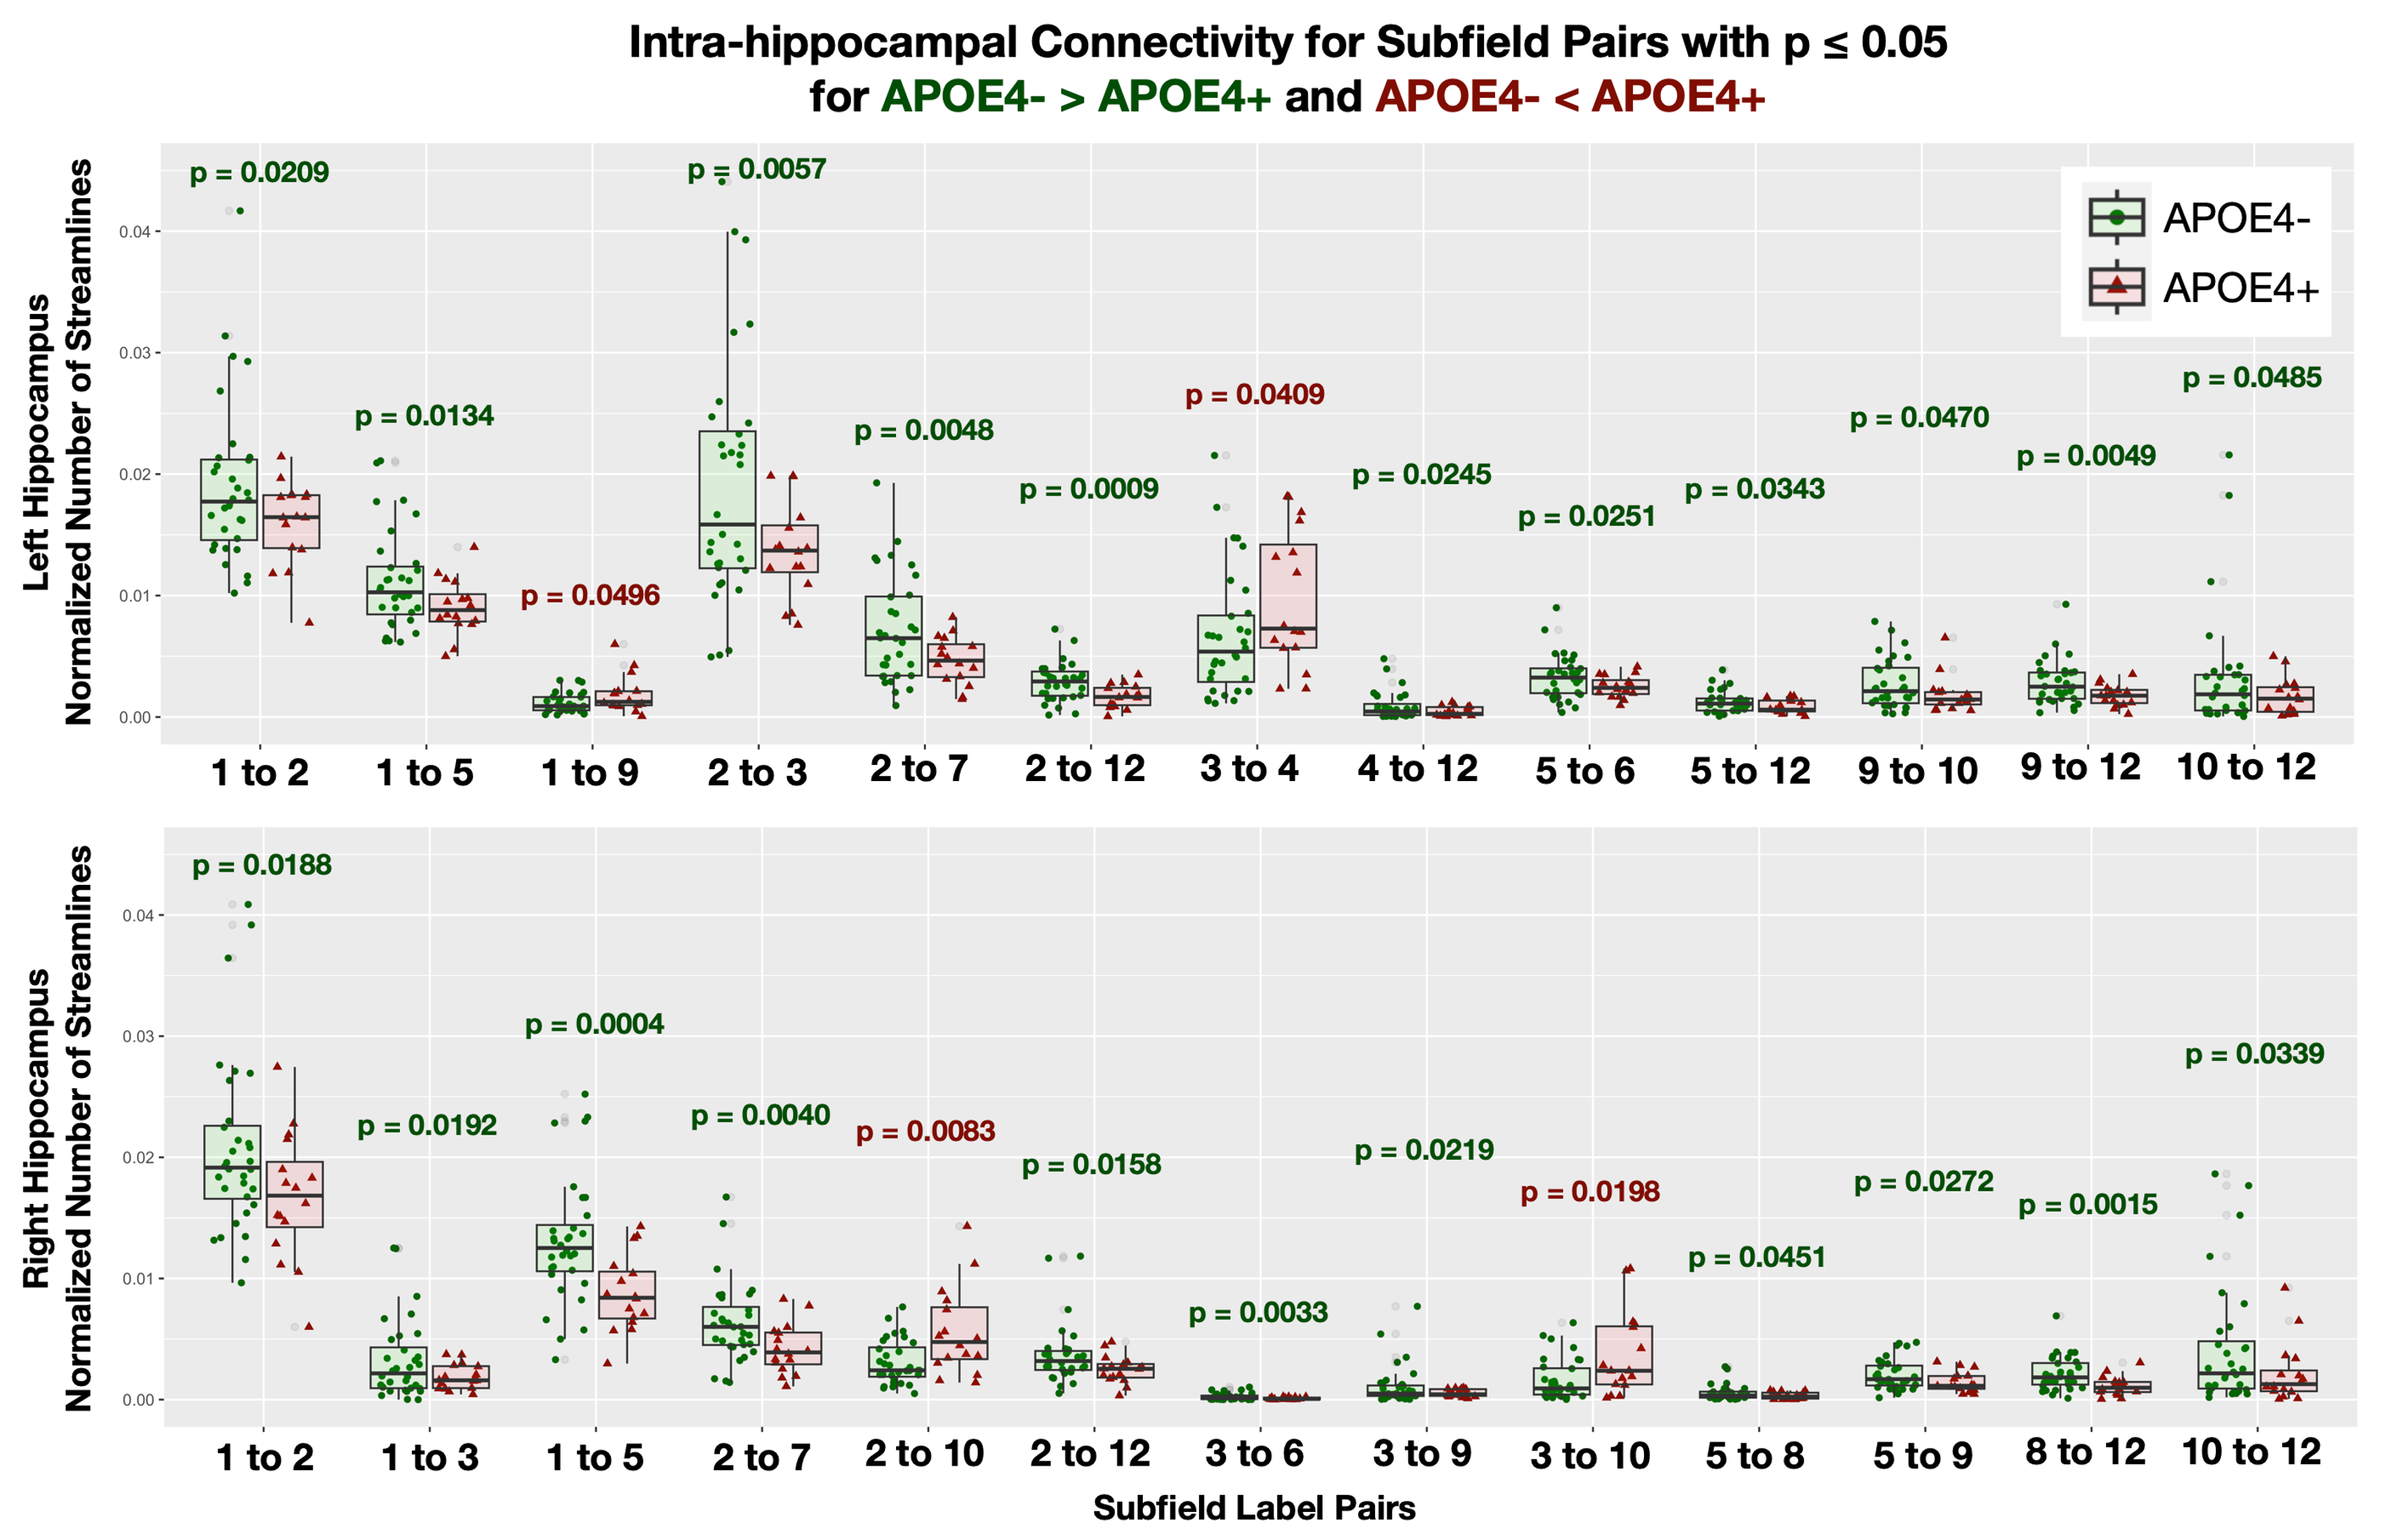
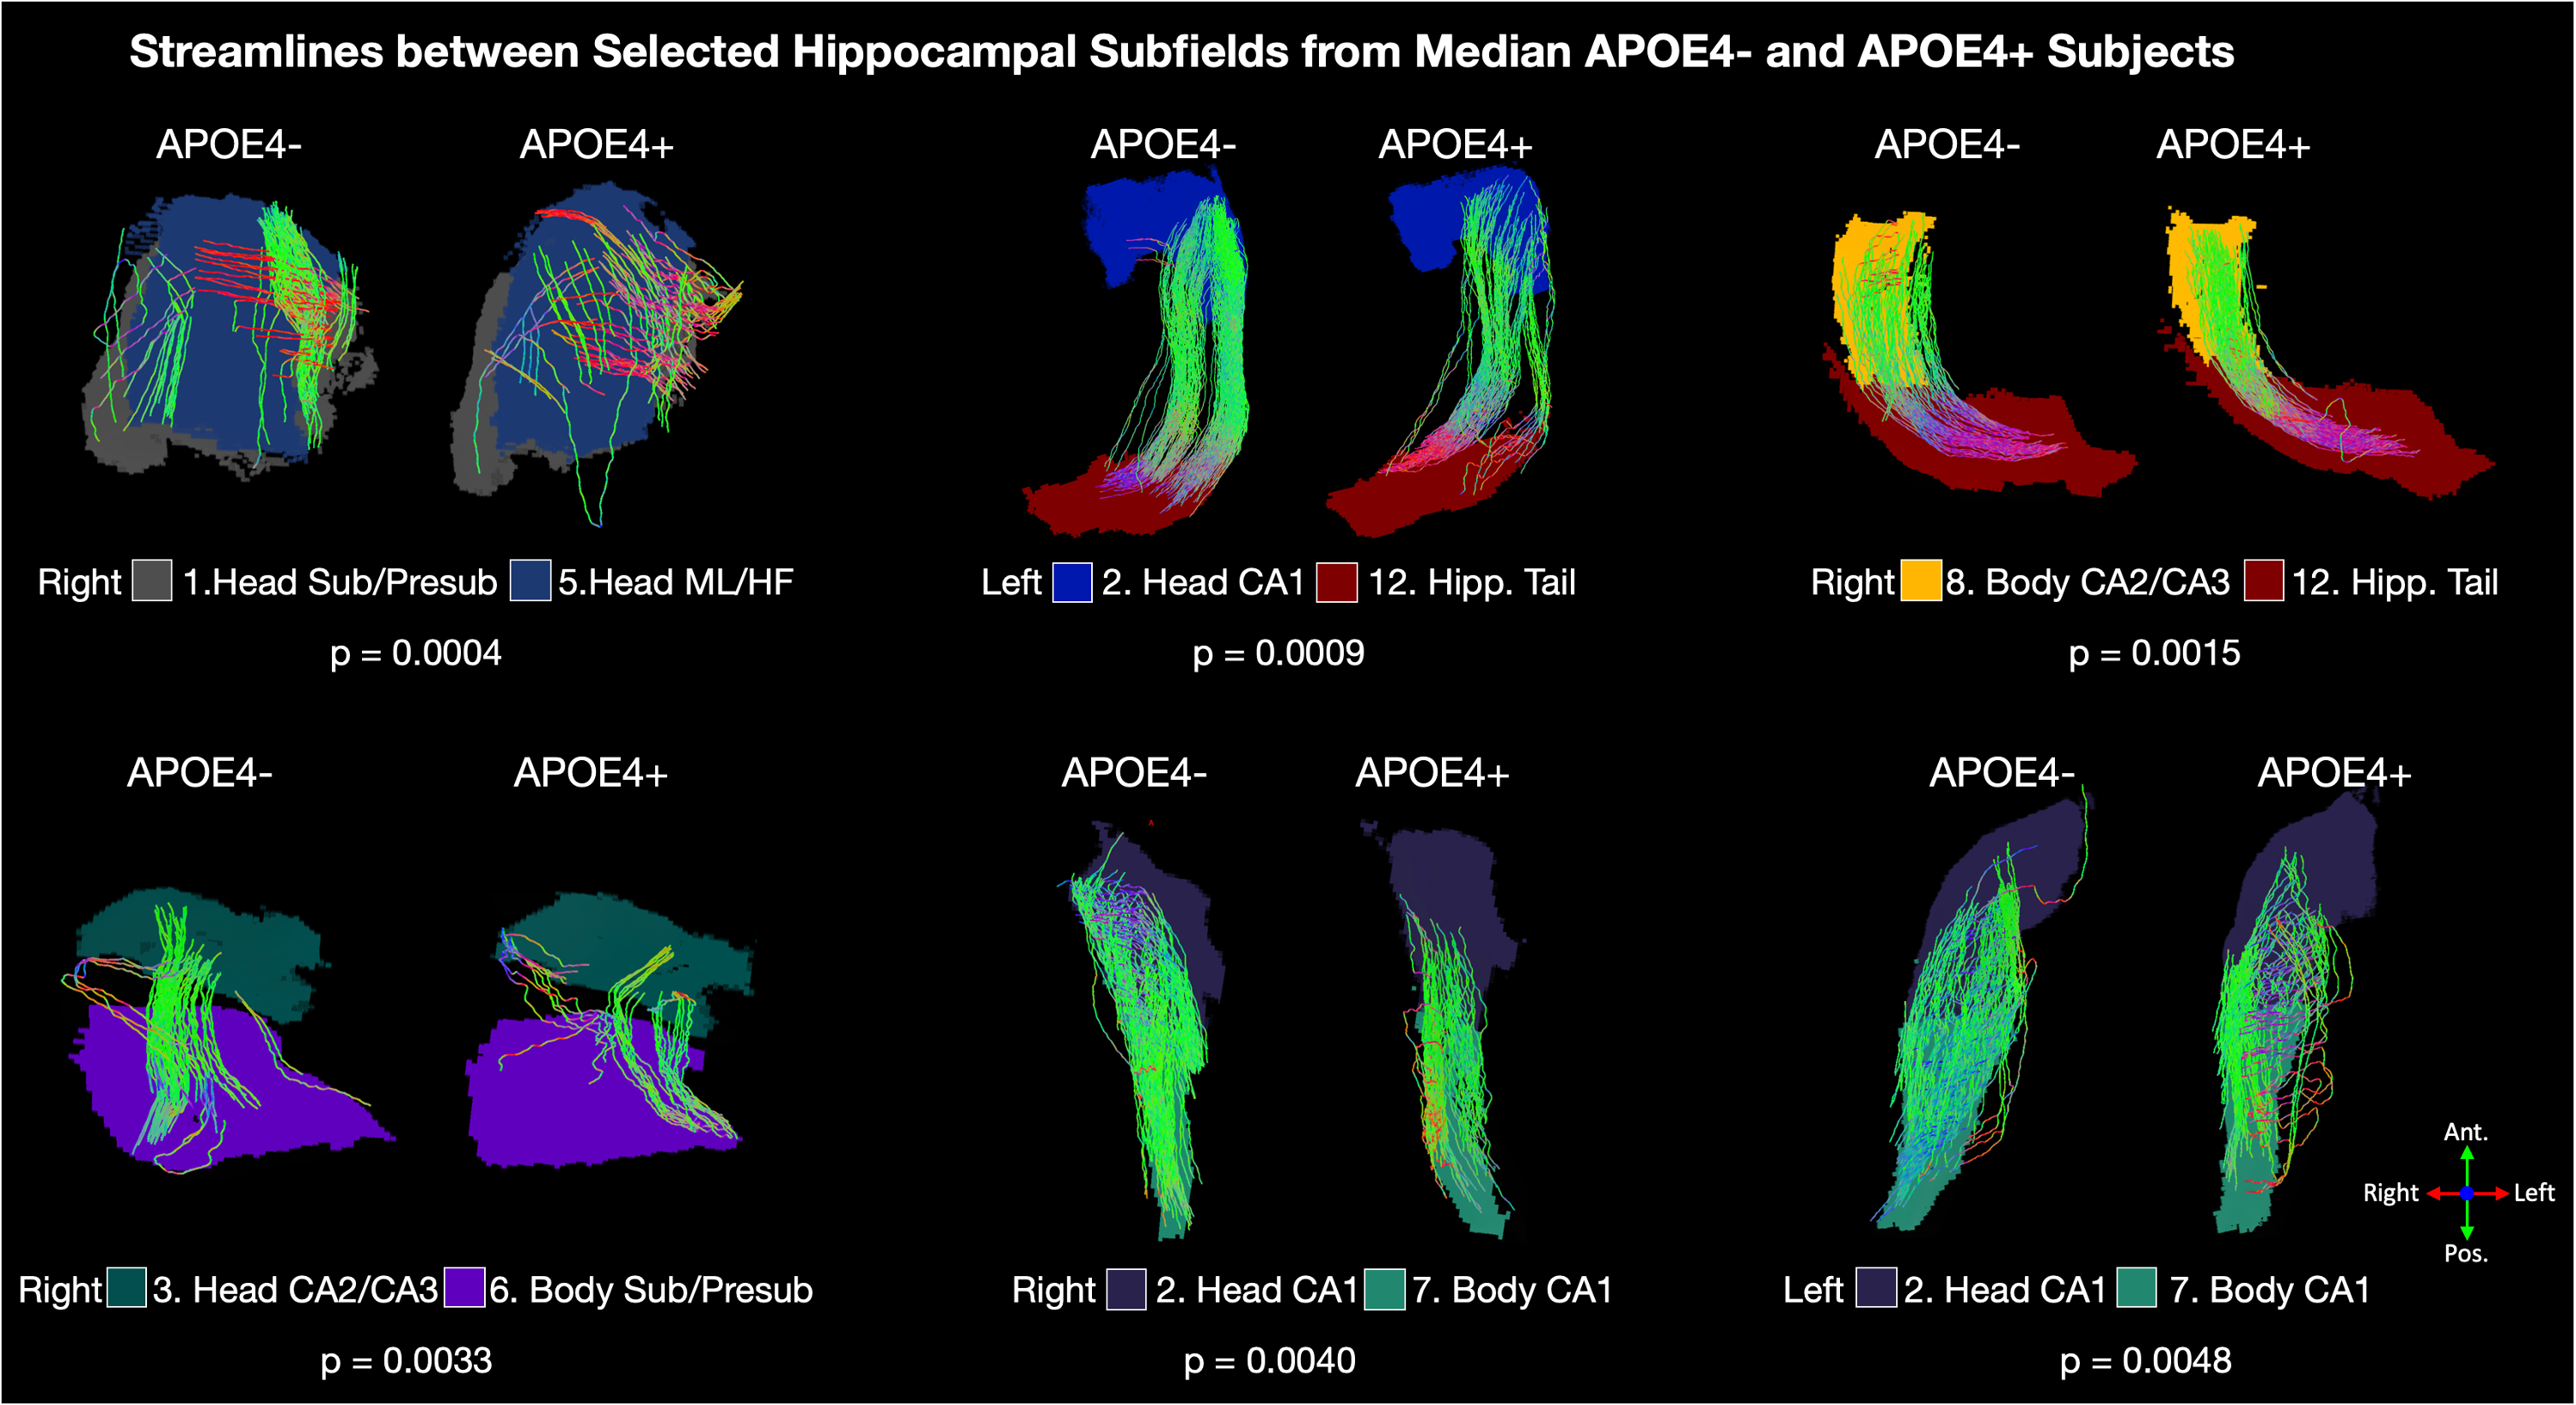
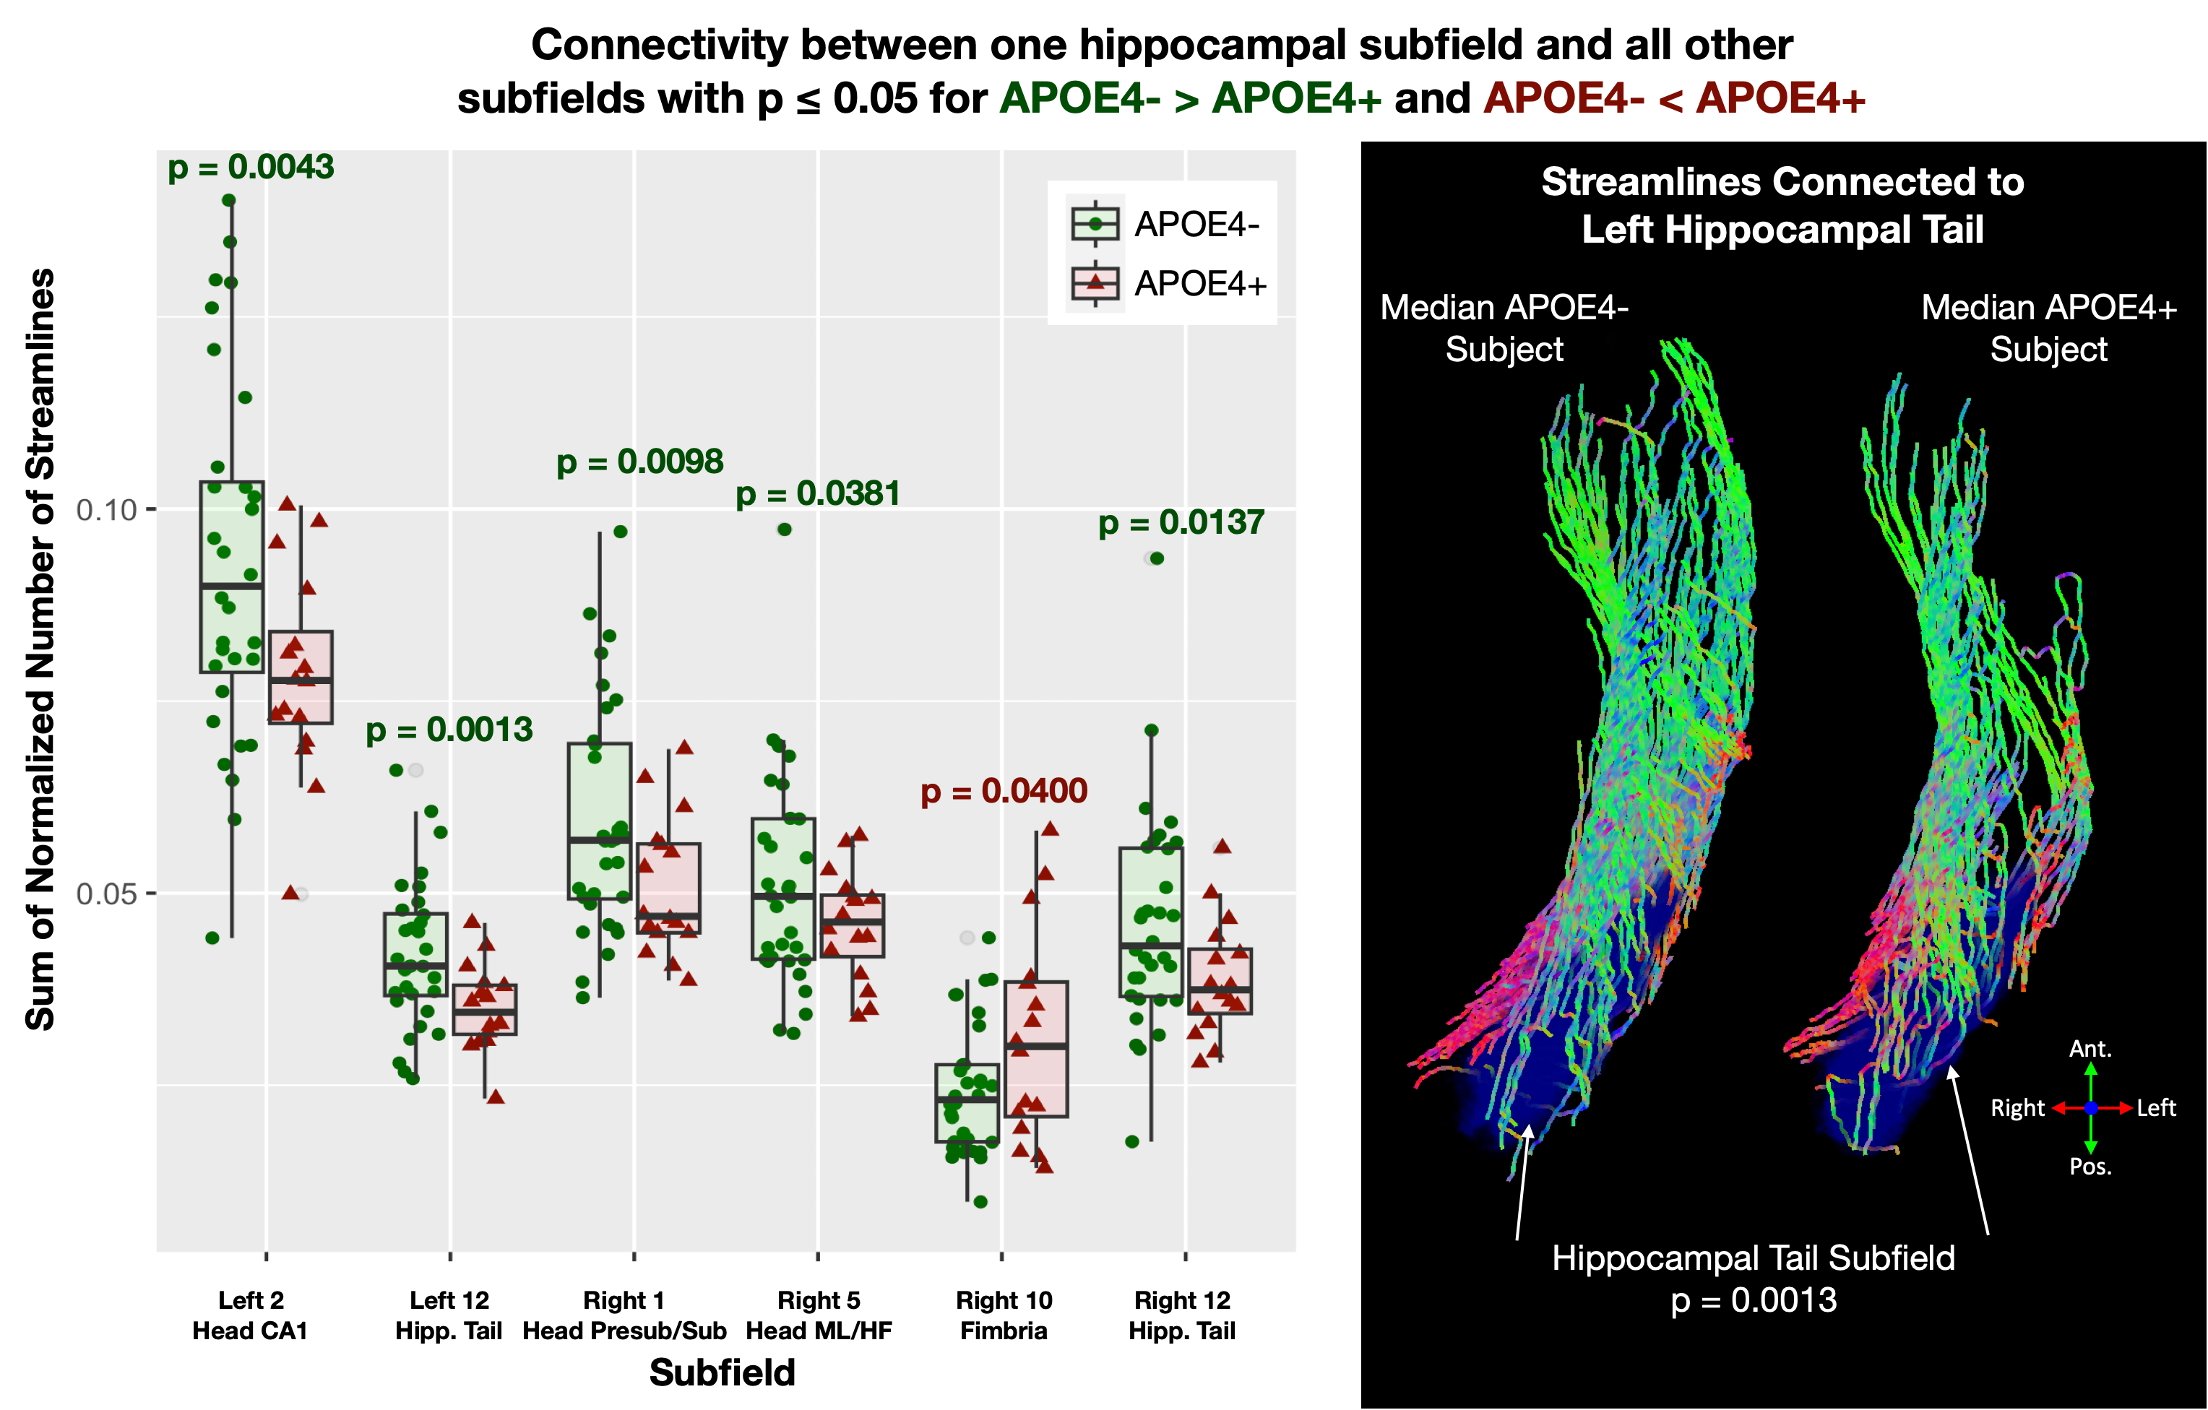
There were 22 (out of 132) subfield pairs with a significantly lower, and 4 subfield pairs with a significantly higher, connectivity (p ≤ 0.05) for the APOE4+ group compared to the APOE4- group (Figures 2-3). Streamlines for the six subfield pairs with the most significant differences clearly show a lower intra-hippocampal connectivity in the median APOE4+ subjects compared to the median APOE4- subjects (Figure 4).As for the connectivity between one subfield and all other subfields, there were 5 (out of 24) subfields with a significantly lower, and one subfield with a significantly higher, connectivity (p ≤ 0.05) for the APOE4+ group compared to the APOE4- group (Figure 5).
Among the subfields with a significant difference in connectivity to another subfield or to all other subfields, 18 (out of 26) and 4 (out of 6), respectively, included the head subiculum/presubiculum, head CA1, and hippocampal tail (subfields 1, 2, and 12). Streamlines in the anterior-posterior direction running through the length of the hippocampus showed the most striking difference between the APOE4- and APOE4+ subjects (green streamlines in Figures 4-5).
Such differences in intra-hippocampal connectivity could be detected even though no significant differences in hippocampal subfield volumes were measured between the APOE4- and APOE4+ groups (p > 0.05), showing the value of our diffusion MRI methodology compared to structural MRI.
Our study used multi-shell DTI data to resolve multiple fiber orientations per voxel, but with a 2-mm isotropic resolution. In contrast, previous similar studies in healthy and AD subjects21,22 used a higher 1-mm isotropic resolution to reduce partial volume effects, but with only a single shell due to the limited signal-to-noise ratio. Given this trade-off, the data acquisition/analysis could be further optimized to improve the assessment of the intra-hippocampal connectivity.
Conclusion
While a more comprehensive study including AD subjects is desirable, our analysis of intra-hippocampal connectivity between cognitively normal APOE4- and APOE4+ subjects shows potential to serve as an imaging biomarker for the early diagnosis and treatment of AD in high-risk pre-symptomatic subjects.Acknowledgements
This work was in part supported by grants R01 EB028644 and S10 OD021480 from the National Institutes of Health. In addition, data collection and sharing for this project was funded by the Alzheimer's Disease Neuroimaging Initiative (ADNI) (National Institutes of Health Grant U01 AG024904) and DOD ADNI (Department of Defense award number W81XWH-12-2-0012).References
- DeTure MA, Dickson DW. The neuropathological diagnosis of Alzheimer's disease. Mol Neurodegener. 2019;1(14):32. doi: 10.1186/s13024-019-0333-5
- Domínguez-Fernández C, et al. Review of Technological Challenges in Personalised Medicine and Early Diagnosis of Neurodegenerative Disorders. Int J Mol Sci. 2023;4(24):3321. doi: 10.3390/ijms24043321
- Rao YL, et al. Hippocampus and its involvement in Alzheimer’s Disease: a review. 3 Biotech. 2022;2(12):55. doi: 10.1007/s13205-022-03123-4
- Maller JJ, et al. Revealing the Hippocampal Connectome through Super-Resolution 1150-Direction Diffusion MRI. Sci Rep. 2019;1(9):2418. doi: 10.1038/s41598-018-37905-9
- Dalton MA, et al. New insights into anatomical connectivity along the anterior-posterior axis of the human hippocampus using in vivo quantitative fibre tracking. Elife. 2022;(11):e76143. doi: 10.7554/eLife.76143
- Ly M, et al. Mesoscale diffusion magnetic resonance imaging of the ex vivo human hippocampus. Hum Brain Mapp. 2020;15(41):4200-4218. doi: 10.1002/hbm.25119
- Modo M, et al. Mapping mesoscale connectivity within the human hippocampus. Neuroimage. 2023;(282):120406. doi: 10.1016/j.neuroimage.2023.120406
- Sienski G, et al. APOE4disrupts intracellular lipid homeostasis in human iPSC-derived glia. Sci Transl Med. 2021;583(13):4564. doi: 10.1126/scitranslmed.aaz4564
- Petersen RC, et al. Alzheimer's Disease Neuroimaging Initiative (ADNI): clinical characterization. Neurology. 2010;3(74):201-9. doi: 10.1212/WNL.0b013e3181cb3e25
- Reuter M, Schmansky NJ, Rosas HD, Fischl B. Within-Subject Template Estimation for Unbiased Longitudinal Image Analysis. Neuroimage. 2012;61(4):1402-1418.
- Iglesias JE, et al. A computational atlas of the hippocampal formation using ex vivo, ultra-high resolution MRI: Application to adaptive segmentation of in vivo MRI. Neuroimage. 2015;15(115):117-37. doi: 10.1016/j.neuroimage.2015.04.042
- Schilling KG, et al. Synthesized b0 for diffusion distortion correction (Synb0-DisCo). Magnetic Resonance Imaging. 2019;(64):62-70. doi: 10.1016/j.mri.2019.05.008
- Andersson JLR, Sotiropoulos SN. An integrated approach to correction for off-resonance effects and subject movement in diffusion MR imaging. Neuroimage. 2016;(125):1063-1078. doi: 10.1016/j.neuroimage.2015.10.019
- Smith SM, et al. Advances in functional and structural MR image analysis and implementation as FSL. NeuroImage, 2004;S1(23):208-19. doi: 10.1016/j.neuroimage.2004.07.051
- Greve DN, Fischl B. Accurate and robust brain image alignment using boundary-based registration. Neuroimage. 2009;48:63-72. doi: 10.1016/j.neuroimage.2009.06.060
- Jeurissen B, et al. Multi-tissue constrained spherical deconvolution for improved analysis of multi-shell diffusion MRI data. Neuroimage. 2014;103:411-426. doi: 10.1016/j.neuroimage.2014.07.061
- Tournier JD, et al. MRtrix3: A fast, flexible and open software framework for medical image processing and visualisation. Neuroimage. 2019;15(202):116137. doi: 10.1016/j.neuroimage.2019.116137
- Tournier JD, et al. Direct estimation of the fiber orientation density function from diffusion-weighted MRI data using spherical deconvolution. Neuroimage. 2004;3(23):1176-85. doi: 10.1016/j.neuroimage.2004.07.037
- Smith RE, et al. SIFT2: Enabling dense quantitative assessment of brain white matter connectivity using streamlines tractography. NeuroImage. 2015;1(119):338-351. doi: 10.1016/j.neuroimage.2015.06.092
- R Core Team (2021). R: A language and environment for statistical computing. R Foundation for Statistical Computing, Vienna, Austria. URL https://www.R-project.org/.
- Ma Y, et al. Intra-hippocampal fiber tracking and connectome from submillimeter DTI of the human hippocampus in vivo and ex vivo. Proc Intl Soc Mag Med 30. 2022:4759
- Overson DK, et al. Comparison of Intra-Hippocampal Fiber Tracks and Connectomes between Alzheimer’s Patients and Age-Matched Healthy Controls. Proc Intl Soc Mag Med 31. 2023:4162
Figures