0760
High-Resolution DTI Cortical Column Analysis for Early Detection of Alzheimer’s Disease in High-Risk Pre-Symptomatic Subjects1Brain Imaging and Analysis Center, Duke University, Durham, NC, United States, 2Medical Physics Graduate Program, Duke University, Durham, NC, United States, 3Department of Radiology, Duke University, Durham, NC, United States, 4Athinoula A. Martinos Center for Biomedical Imaging, Massachusetts General Hospital, Harvard Medical School, Boston, MA, United States, 5Department of Psychiatry and Behavior Sciences, Duke University, Durham, NC, United States
Synopsis
Keywords: Alzheimer's Disease, Gray Matter, Microstructure, Cortical Column, APOE4
Motivation: Microstructural changes in cortical gray matter, occurring potentially well before cognitive decline in Alzheimer’s disease (AD), could serve as an early diagnosis biomarker.
Goal(s): We use high-resolution diffusion tensor imaging to identify such changes among AD subjects, cognitively normal but high-risk (APOE4+) subjects, and healthy controls (APOE4-).
Approach: The variation in fractional anisotropy along cortical columns was analyzed within 68 regions.
Results: 20 regions exhibited a lower variation in the high-risk group compared to the control group. The AD risks of individual high-risk subjects could be further differentiated based on similarities and differences with the AD or control groups.
Impact: Our cortical column-based analysis of high-resolution diffusion tensor imaging data can detect microstructural changes within specific cortical regions of pre-symptomatic subjects with high risk for Alzheimer’s disease, potentially providing a more definitive biomarker for its early diagnosis and treatment.
Introduction
Alzheimer’s disease (AD) typically exhibits neurodegeneration, particularly in cortical gray matter1,2, years before the onset of cognitive decline3,4. However, such neurodegeneration is not uniform throughout the brain and existing biomarkers lack the specificity to detect early microstructural changes within specific cortical regions of pre-symptomatic subjects. We aim to address this limitation and enable the early diagnosis of AD well before the onset of cognitive decline, when the neurodegeneration may be delayed or slowed by treatments.A cortical column-based analysis of high-resolution DTI data from healthy subjects has shown a cortical depth dependence of the fractional anisotropy (FA), with local minima/maxima along the cortical depth reflecting the varying microstructure in different cortical layers5. We hypothesize that such an FA variation is reduced by neurodegeneration within specific cortical regions. We perform a comparative analysis in AD subjects and cognitively normal carriers/non-carriers of the apolipoprotein ε4 allele (APOE4+/APOE4-)6, a well-known risk factor for AD, to investigate the potential of this methodology for the early diagnosis of AD in high-risk pre-symptomatic subjects.
Methods
10 APOE4- (8 females, age: 63.0±8.5), 7 APOE4+ (4 females, age: 59.6±9.0), and 11 AD (6 females, age: 62.8±8.7) subjects were scanned on a GE Healthcare 3T Premier UHP scanner (100 mT/m gradients). Whole-brain DTI data were acquired with a 2-band, 4-shot EPI sequence (TR/TE 7346/61 ms, 1 mm isotropic, 2 b0 + 25 b800 s/mm2, 14 min), reconstructed with multi-band multiplexed sensitivity encoding7,8, and preprocessed with denoising, Gibbs artifact removal, susceptibility-/eddy current-induced distortion correction, bias field correction, and cubic-interpolation to 0.5-mm isotropic resolution with FSL9/MRtrix310.T1-weighted anatomical images (1 mm isotropic) were acquired to derive white matter/gray matter (WM/GM) interface and pial surfaces (Figure 1A) via Freesurfer11. Matching pairs of vertices from these surfaces were connected to generate radial cortical columns (Figure 1B), which were assigned to regions-of-interest (ROIs) from the Desikan-Killiany atlas12,13 (Figure 1C) and registered to the DTI data with Freesurfer’s bbregister14.
FA maps derived from the DTI data were sampled at 21 equidistant cortical depths along each column (Figure 1D). To characterize FA variations along the cortical depth, the absolute value of the gradient of such FA profiles was calculated (Figure 1E) and summed over all depths (∑|∇FA|), averaged over all columns within each ROI (|∇FA|Avg), or both (∑|∇FA|Avg). One-tailed t-tests were performed with R15 to determine significant differences in ∑|∇FA|Avg among the three subject groups.
Results and Discussion
Significant differences in ∑|∇FA|Avg were observed in 33 ROIs for APOE4- > AD, 7 ROIs for APOE4+ > AD, and 20 ROIs for APOE4- > APOE4+ (Figure 2), many of which are associated with AD-related neurodegeneration (e.g., lateral occipital16,17, supramarginal18,19, inferior parietal20), showing that ∑|∇FA|Avg can detect AD-related microstructural changes within specific cortical regions.While APOE4 is a risk factor for AD, some APOE4+ subjects may experience AD-related neurodegeneration, but others may not. Thus, the APOE4+ group does not show a homogeneous reduction in ∑|∇FA|Avg across all subjects and ROIs compared to the APOE4- group, but a distribution that is between those of the APOE4- and AD groups, depending on the ROIs, as shown by box plots of ∑|∇FA|Avg and maps of ∑|∇FA| (Figure 3). Importantly, the results for individual cognitively normal APOE4+ subjects can be closer to those of the median APOE4- subject (subjects B vs. A) or near-median AD subject (subjects C vs. D), which could potentially indicate whether a high-risk pre-symptomatic subject will more likely develop AD.
|∇FA|Avg profiles show that the APOE4+ group has the most/least overlap with the APOE4-/AD group, respectively, near the WM/GM interface and conversely at intermediate cortical depths, suggesting that early microstructural changes occur within the cortex (Figure 4).
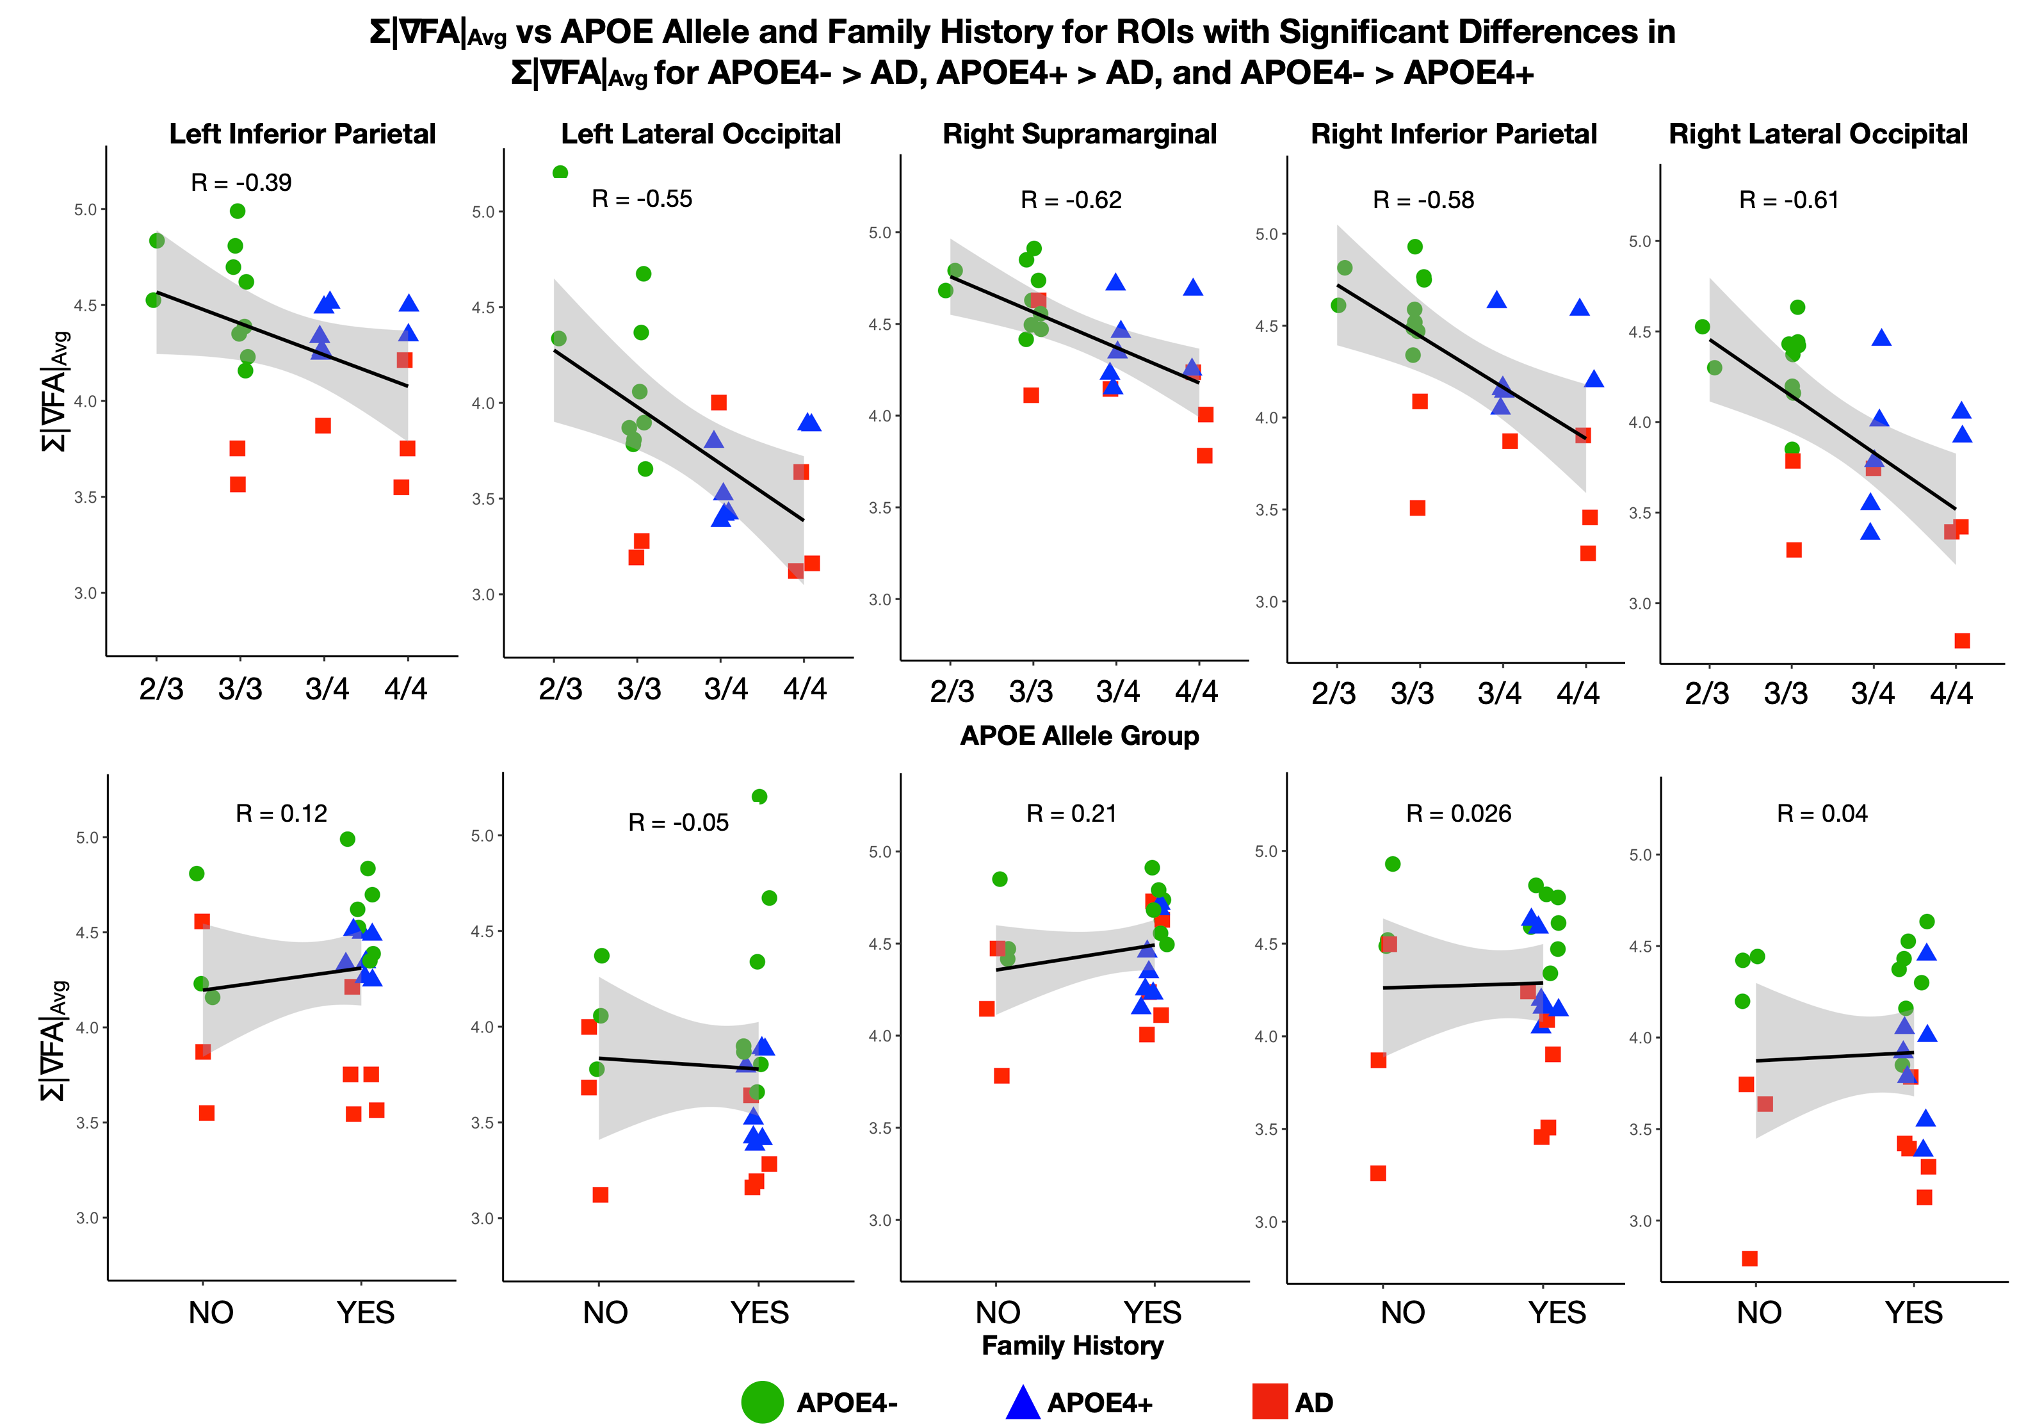
Despite the small sample size, further splitting the three subject groups based on the APOE alleles (2/3, 3/3, 3/4, 4/4, with APOE2/APOE3/APOE4 being a low/neutral/high risk factor for AD)21,22 or family history of AD (yes/no) shows a high correlation between ∑|∇FA|Avg and APOE allele, but not family history (Figure 5), consistent with APOE4 being a stronger risk factor for AD than family history23,24.
Conclusion
Our cortical column-based analysis of high-resolution DTI data from APOE4-, APOE4+, and AD subjects shows the potential of this methodology to provide imaging biomarkers for the noninvasive detection of microstructural changes within specific cortical regions of individual high-risk (APOE4+) but cognitively normal subjects. While a more comprehensive analysis with a larger sample size is ongoing, these preliminary results are a promising step toward improved differentiations of AD risks in high-risk pre-symptomatic subjects and potentially proactive treatment of AD in prodromal patients to delay the onset, or slow the progression, of the disease.Acknowledgements
This work was in part supported by grants R01 EB028644, S10 OD021480, S10 OD028544, and P30 AG072958 from the National Institutes of Health.References
- Lee P, Hang-Rai K, Yong J. Detection of gray matter microstructural changes in Alzheimer’s disease continuum using fiber orientation. BMC neurology. 2020;20(1):1-10. doi: 10.1186/s12883-020-01939-2
- Weston PS, et al. Diffusion imaging changes in grey matter in Alzheimer’s disease: a potential marker of early neurodegeneration. Alzheimer's research & therapy. 2015;7(1):1-8. doi: 10.1186/s13195-015-0132-3
- Rieman EM, et al. Declining brain activity in cognitively normal apolipoprotein E ɛ4 heterozygotes: a foundation for using positron emission tomography to efficiently test treatments to prevent Alzheimer's disease. Proceedings of the National Academy of Sciences. 2001;98(6):3334-3339. doi: 10.1073/pnas.061509598
- Wu Z, et al. Gray Matter Deterioration Pattern During Alzheimer's Disease Progression: A Regions-of-Interest Based Surface Morphometry Study. Front Aging Neurosci. 2021;3(13):593898. doi: 10.3389/fnagi.2021.593898
- Ma Y. et al. Column-based cortical depth analysis of the diffusion anisotropy and radiality in submillimeter whole-brain diffusion tensor imaging of the human cortical gray matter in vivo. Neuroimage. 2023;270:119993. doi: 10.1016/j.neuroimage.2023.119993
- van Duijn CM, et al. Apolipoprotein E4 allele in a population–based study of early–onset Alzheimer's disease. Nature genetics. 1994;7(1):74-78. doi: doi: 10.1038/ng0594-74
- Chen, NK, Guidon A, Chang HC, Song AW. A robust multi-shot scan strategy for high-resolution diffusion weighted MRI enabled by multiplexed sensitivity-encoding (MUSE). Neuroimage. 2013;72:41-47. doi: 10.1016/j.neuroimage.2013.01.038
- Bruce I, Chang HC, Petty C, Chen NK, Song AW. 3D-MB-MUSE: A robust 3D multi-slab, multi-band and multi-shot reconstruction approach for ultrahigh resolution diffusion MRI. Neuroimage. 2017;159:46-56. doi: 10.1016/j.neuroimage.2017.07.035
- Smith et al. Advances in functional and structural MR image analysis and implementation as FSL. Neuroimage. 2004;23 S208-219. doi: 0.1016/j.neuroimage.2004.07.051
- Tournier JD, et al. MRtrix3: A fast, flexible and open software framework for medical image processing and visualisation. Neuroimage. 2019;202:116–137. doi: 10.1016/j.neuroimage.2019.116137
- Reuter M, Schmansky NJ, Rosas HD, Fischl B. Within-Subject Template Estimation for Unbiased Longitudinal Image Analysis. Neuroimage. 2012;61(4):1402-1418.
- Daducci A, et al. The connectome mapper: an open-source processing pipeline to map connectomes with MRI. PLoS One. 2012;7(12):e48121. doi: 10.1371/journal.pone.0048121
- Camoun L, et al. Mapping the human connectome at multiple scales with diffusion spectrum MRI. J. Neurosci Methods. 2012;203(2):386-397. doi: 10.1016/j.jneumeth.2011.09.031
- Greve DN, Fischl B. Accurate and robust brain image alignment using boundary-based registration. Neuroimage. 2009;48:63-72. doi: 10.1016/j.neuroimage.2009.06.060
- R Core Team. R: A Language and Environment for Statistical Computing. R Foundation for Statistical Computing, Vienna, Austria. 2023. https://www.R-project.org/
- Yang H. et al. Study of brain morphology change in Alzheimer’s disease and amnestic mild cognitive impairment compared with normal controls. Gen Psychiatr. 2019;32(2):e100005. doi: 10.1136/gpsych-2018-100005
- Hwang J, et al. Clinical Implications of Amyloid-Beta Accumulation in Occipital Lobes in Alzheimer’s Continuum. Brain Sci. 2021;11(9):1232. doi: 10.3390/brainsci11091232
- Dickerson BC, et al. The Cortical Signature of Alzheimer's Disease: Regionally Specific Cortical Thinning Relates to Symptom Severity in Very Mild to Mild AD Dementia and is Detectable in Asymptomatic Amyloid-Positive Individuals. Cereb Cortex. 2009;19(3):497-510. doi: 10.1093/cercor/bhn113
- Prawiroharjo P, et al. Disconnection of the right superior parietal lobule from the precuneus is associated with memory impairment in oldest-old Alzheimer's disease patients. Heliyon. 2020;6(7):e04516. doi: 10.1016/j.heliyon.2020.e04516
- Greene SJ, Killiany RJ. Subregions of the inferior parietal lobule are affected in the progression to AD. Neurobiol Aging. 2010;31(8):1304-1311. doi: 10.1016/j.neurobiolaging.2010.04.026
- Reiman EM, et al. Exceptionally low likelihood of Alzheimer's dementia in APOE2 homozygotes from a 5,000-person neuropathological study. Nat Commun. 2020;1(11):667. doi: 10.1038/s41467-019-14279-8
- Liu CC, et al. Apolipoprotein E and Alzheimer disease: risk, mechanisms and therapy. Nat Rev Neurol. 2013;2(9):106-18. doi: 10.1038/nrneurol.2012.263.
- Tanzi RE. The genetics of Alzheimer disease. Cold Spring Harb Perspect Med. 2012;2(10):a006296. doi: 10.1101/cshperspect.a006296
- Huang W, et al. APOE genotype, family history of dementia, and Alzheimer disease risk: a 6-year follow-up study. Arch Neurol. 2004;12(61):1930-4. doi: 10.1001/archneur.61.12.1930
Figures
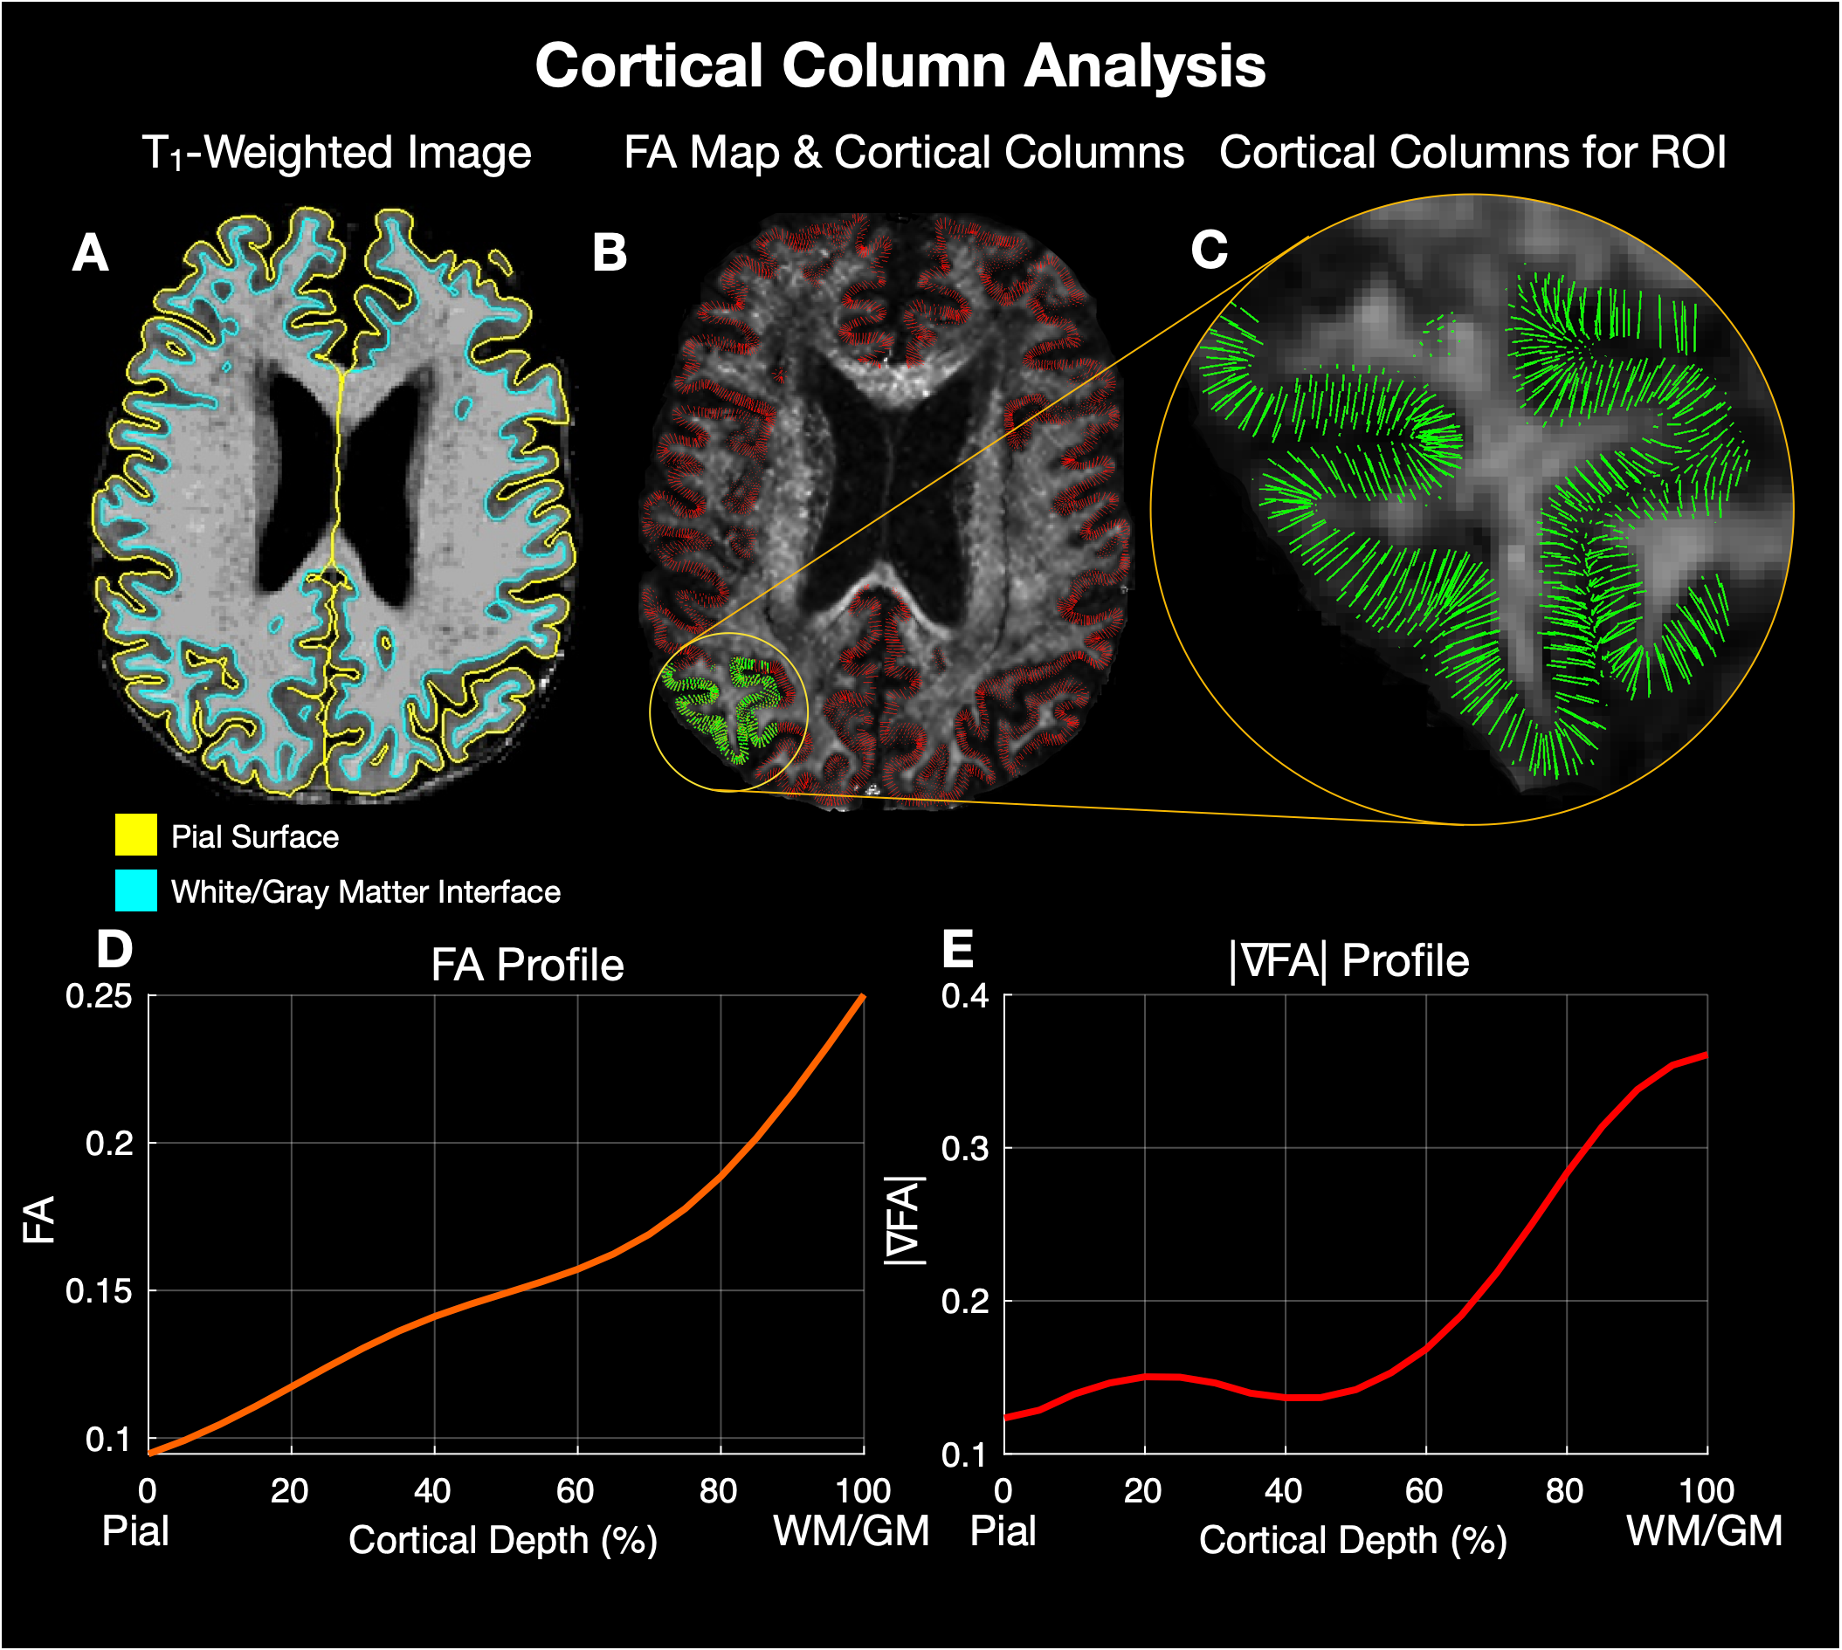
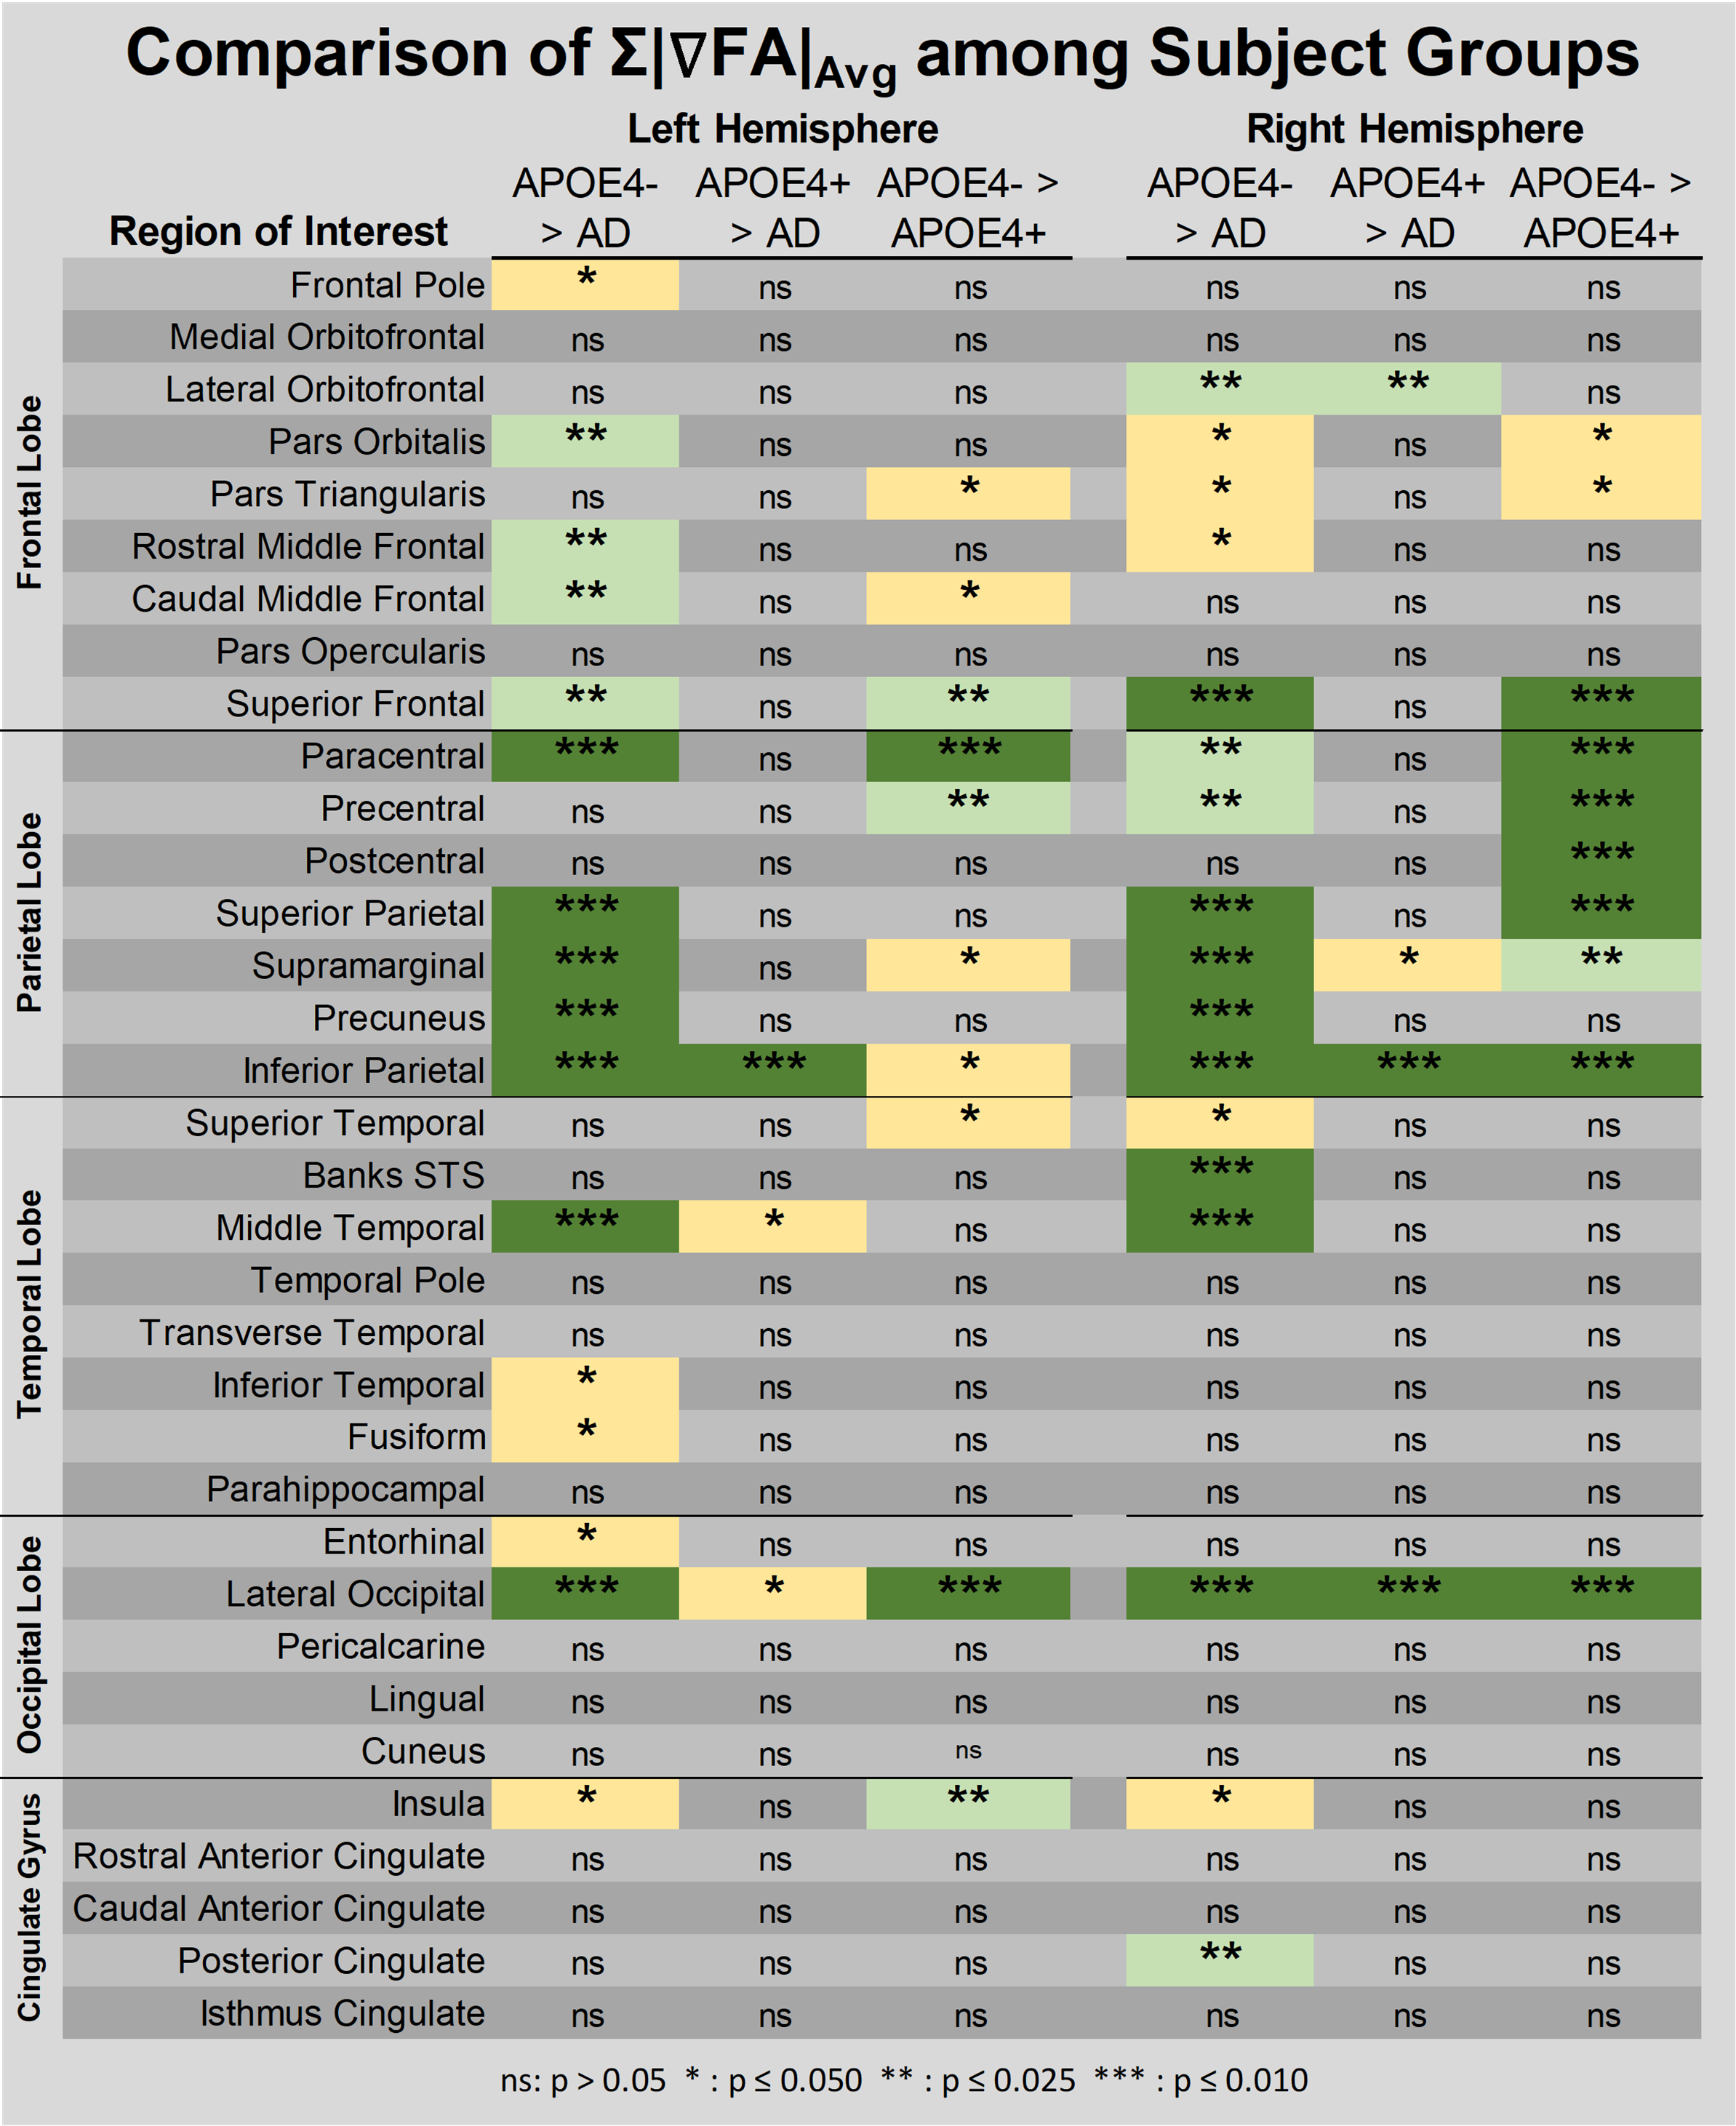
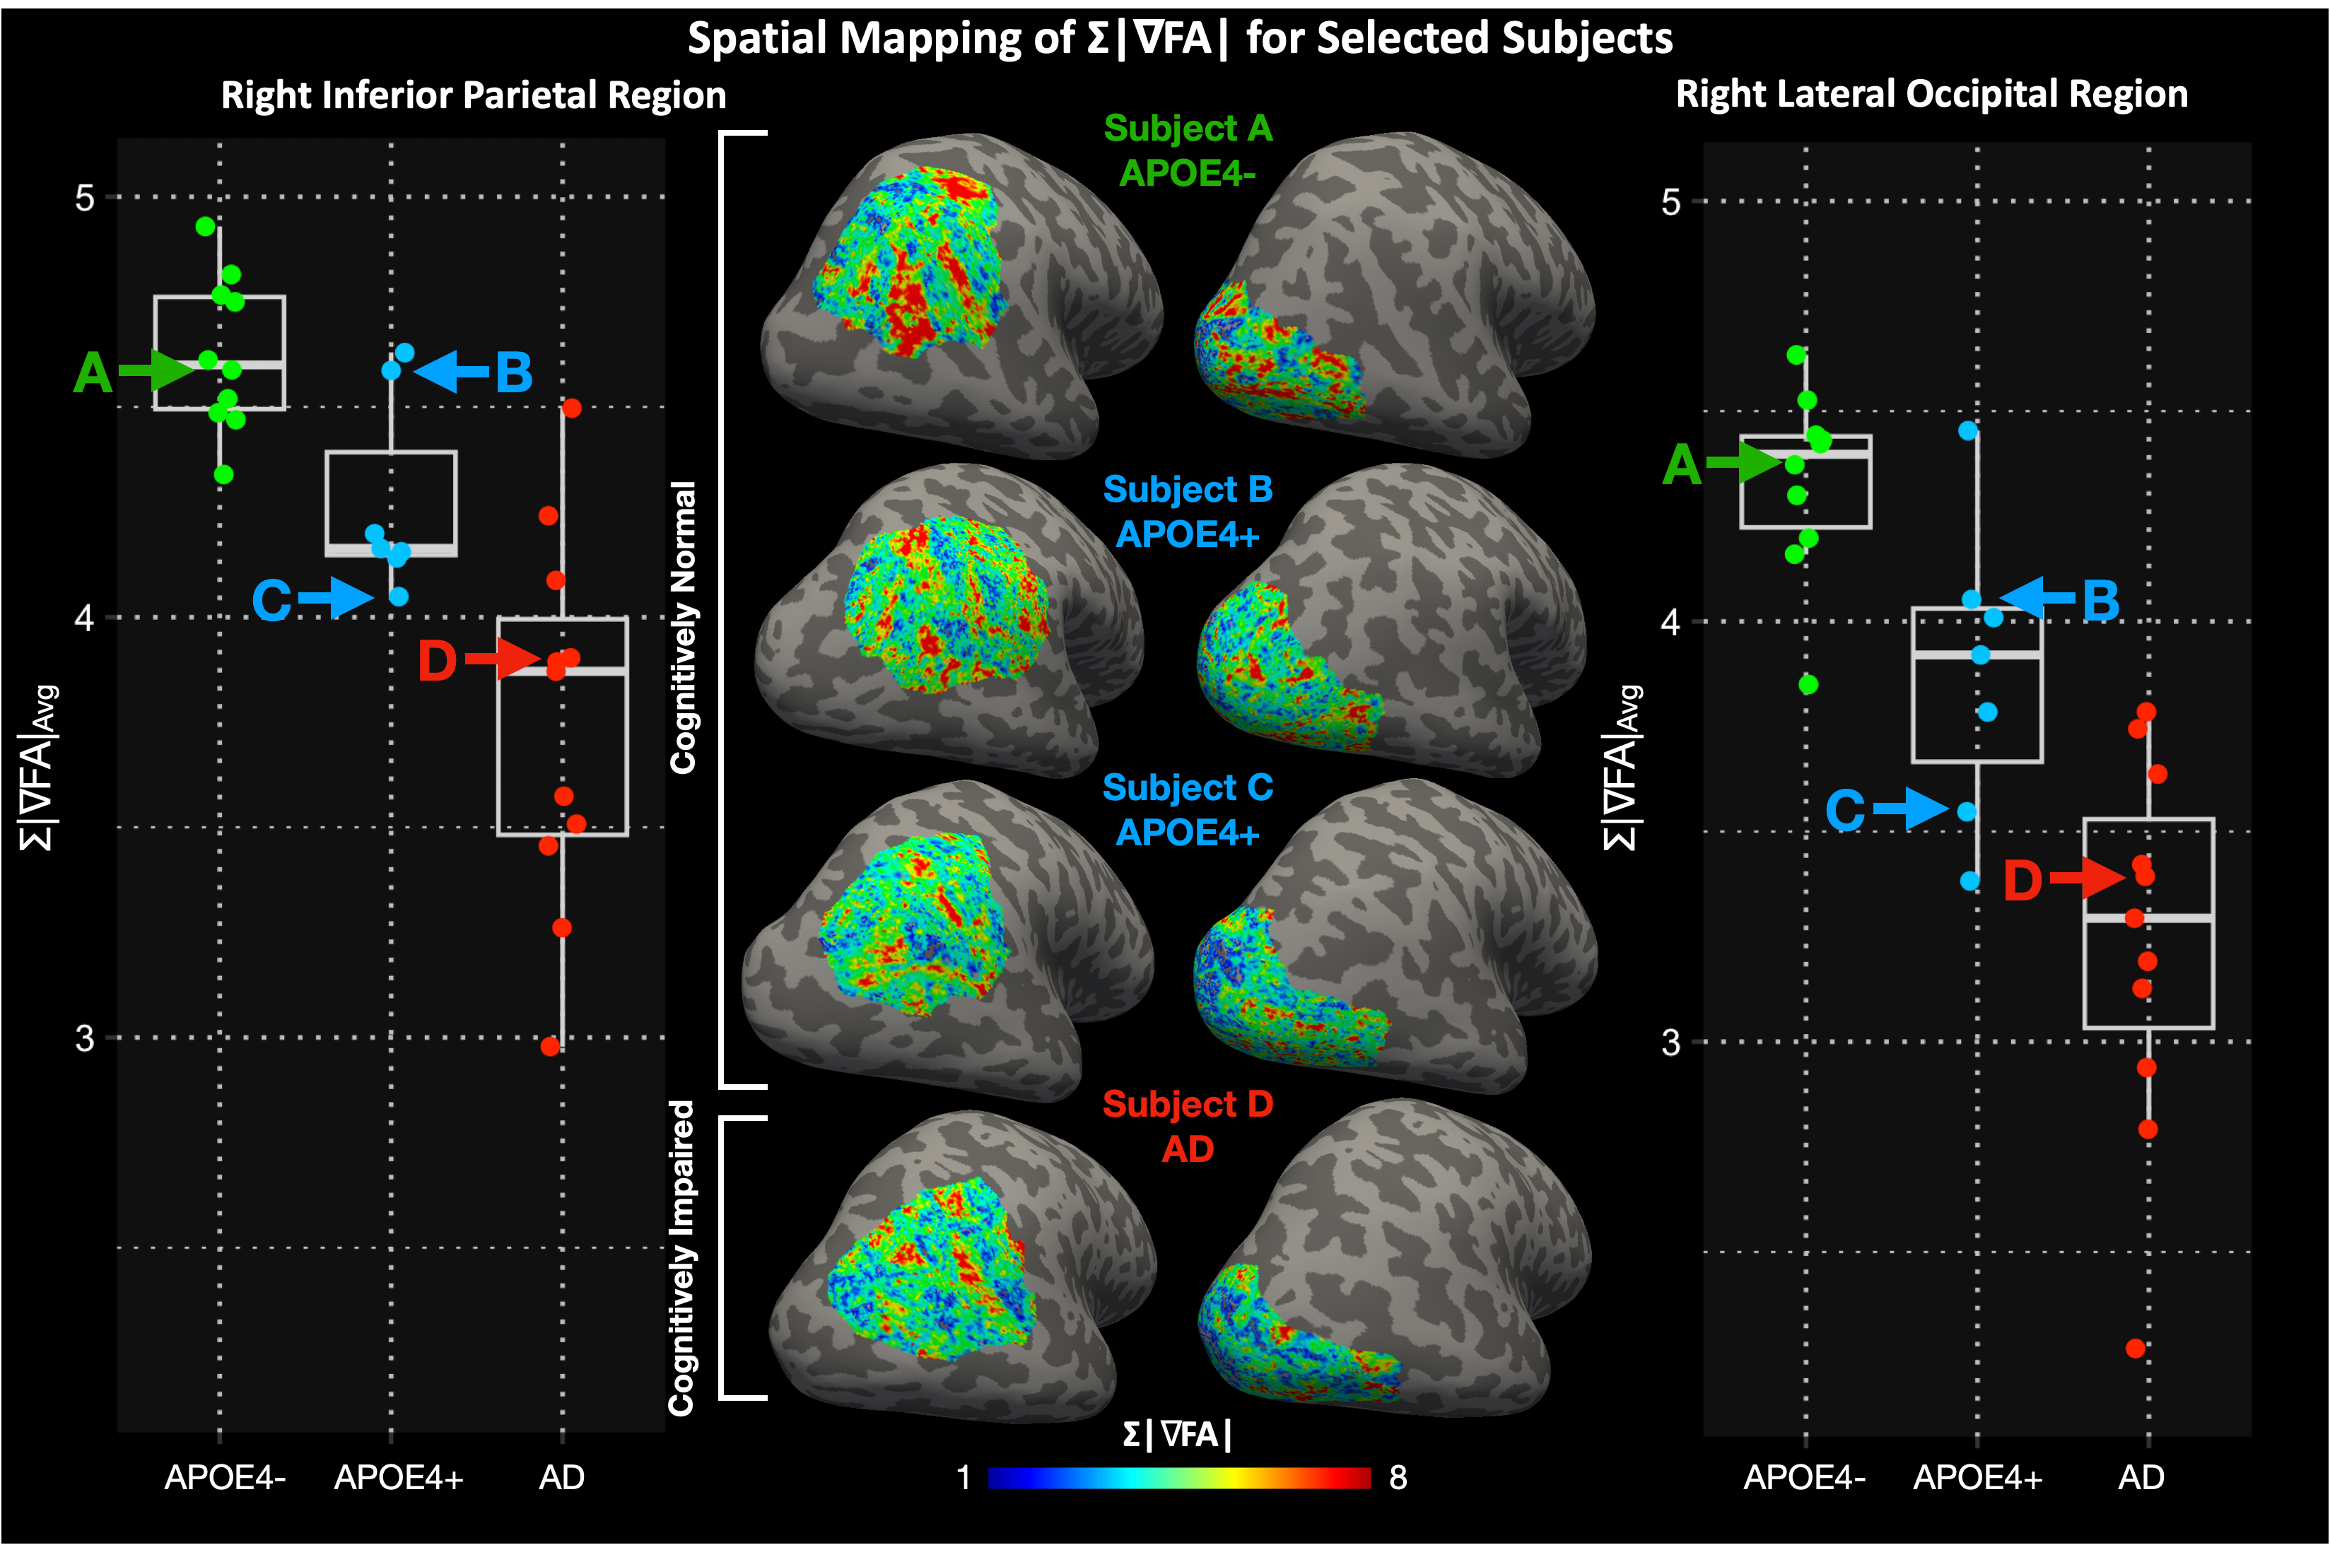
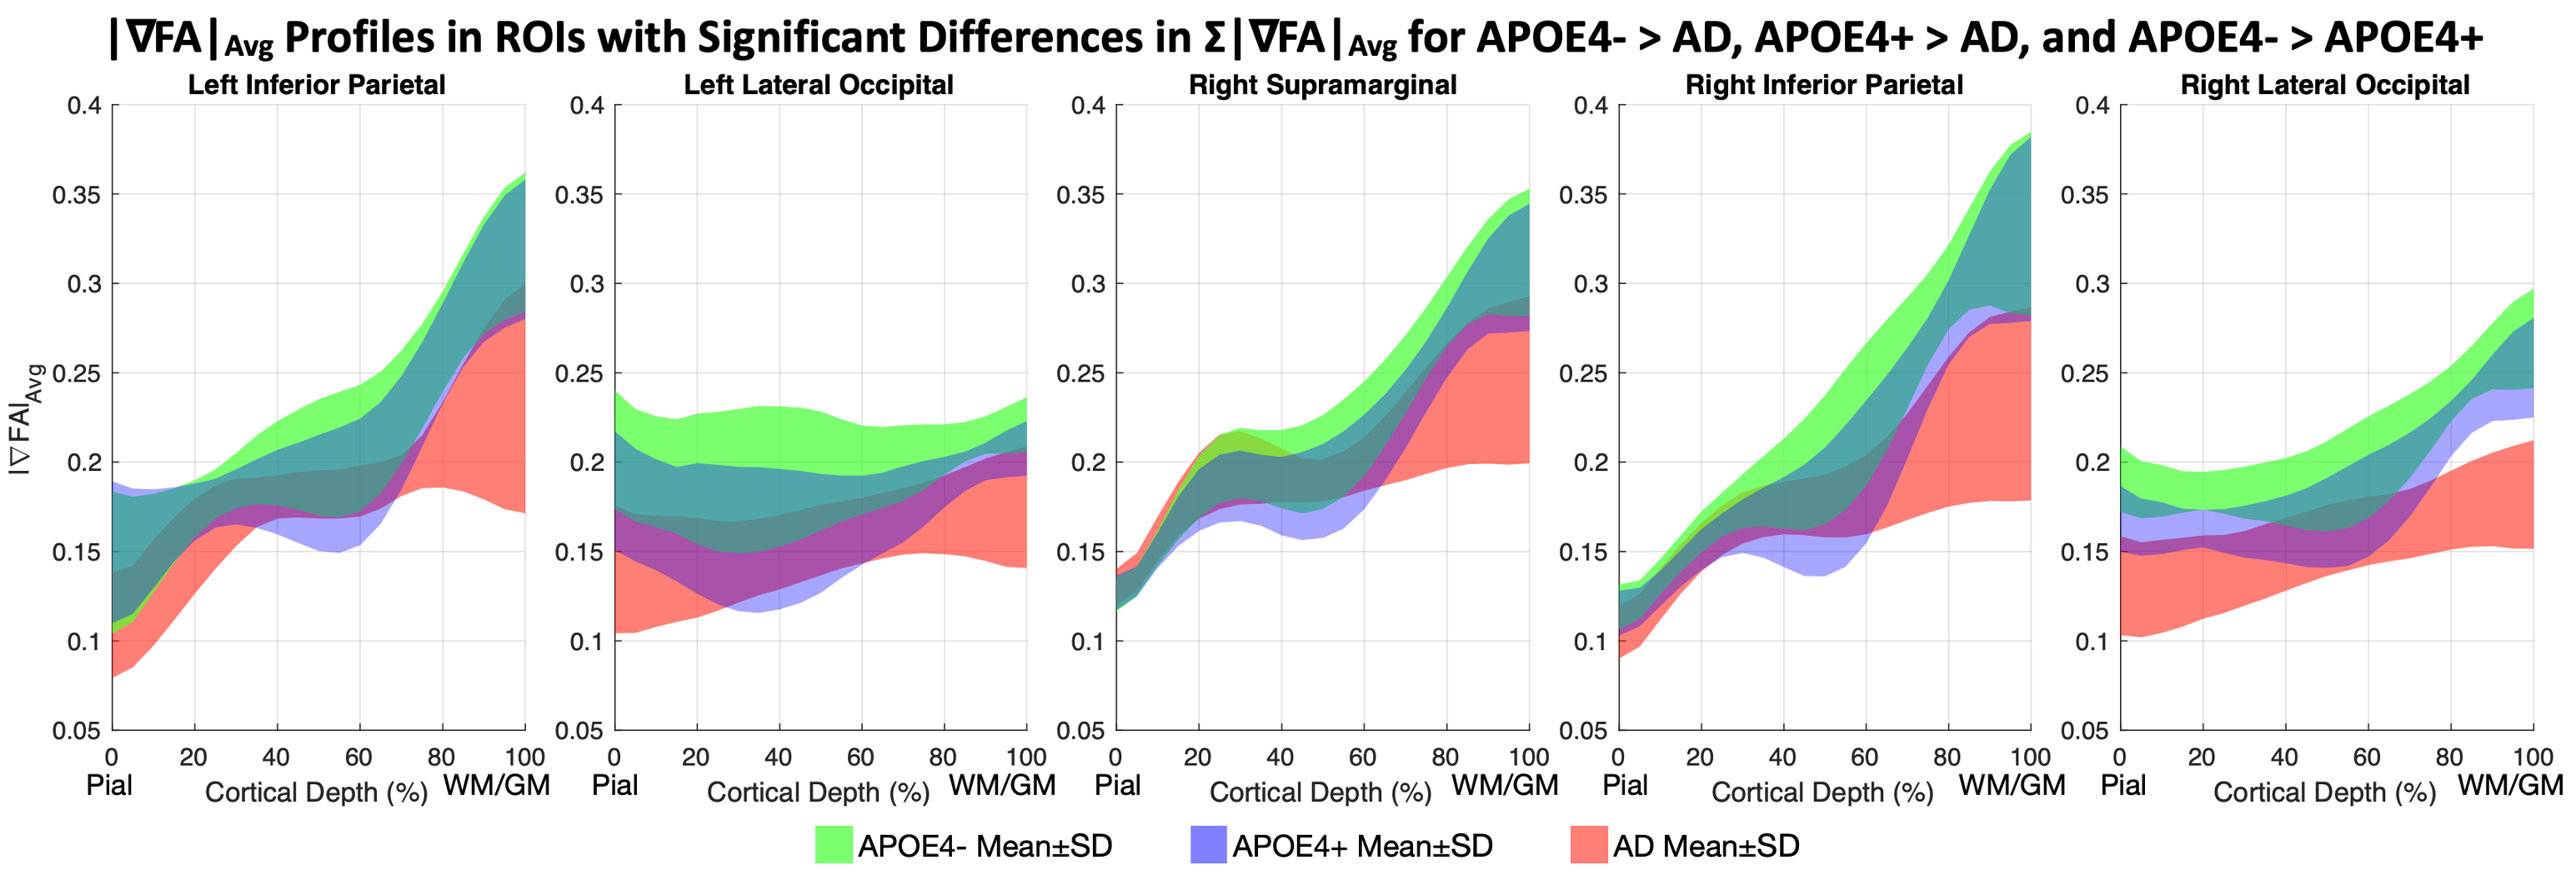
Figure 4: |∇FA|Avg profiles for the three subject groups in the five ROIs with statistically significant differences in ∑|∇FA|Avg for APOE4- > AD, APOE4+ > AD, and APOE4- > APOE4+, showing that the APOE4+ group overlaps more with the APOE4- group near the WM/GM interface and more with the AD group at intermediate cortical depths.