0758
Exploring Preclinical Imaging Biomarkers and Progressive Degeneration in Alzheimer's Disease1Fudan University, shanghai, China, 2East China Normal University, Shanghai, China, 3Institute of Neuroscience, National Yang Ming Chiao Tung University, Taipei, Taiwan, 4Department of Education and Research, Taipei City Hospital, Taipei, Taiwan, 5Institute of Science and Technology for Brain-Inspired Intelligence, Fudan University, Shanghai, China, 6Department of Biomedical Engineering, Chung Yuan Christian University, Taoyuan, Taiwan
Synopsis
Keywords: Alzheimer's Disease, Alzheimer's Disease
Motivation: Preclinical stages of AD offer potential windows for intervention. Investigating individuals in this stages can yield valuable biomarkers and deepen our understanding of disease progression mechanisms.
Goal(s): We aim to investigate brain degeneration mechanisms during AD's preclinical stages and explore early diagnostic markers in gray matter and superficial white matter alterations.
Approach: This study involved 411 participants (including preclinal stages, aMCI and AD) and their diffusion and structural MRI and neuropsychological tests, to assess brain changes.
Results: Cortical atrophy in the temporal lobe may be a trigger for disease onset, while extensive SWM degeneration appears to be associated with disease progression in AD.
Impact: This study provides crucial insights into brain changes in early stages of AD. Identified imaging biomarkers are valuable for early diagnosis and interventions, and the proposed degeneration patterns enhance our understanding of AD's pathophysiology.
Body of the Abstract
INTRODUCTION: The preclinical stages of Alzheimer's disease (AD) offer an opportunity for early intervention as neuropathological changes begin before cognitive symptoms [1]. Individuals with Subjective Cognitive Decline (SCD) and Subtle Cognitive Decline (Obj-SCD) are of interest due to their higher risk of progression to MCI and dementia [2-7]. However, the mechanisms during this phase are unclear. Investigating SCD and Obj-SCD can yield early diagnostic biomarkers and deepen our understanding of disease progression.Superficial White Matter (SWM), composed of intracortical myelin and U-fibers, is susceptible to AD pathology [8-10]. However, it remains uncertain whether SWM alterations manifest during the preclinical stages of AD. White matter changes are suggested as results of Wallerian degeneration secondary to the loss of neurons in the cortical gray matter (GM) [11]. This hypothesis implies a connection between cortical gray matter neuronal loss and white matter changes. Investigating SWM-GM associations can provide insights into pathological changes and mechanisms during disease progression.
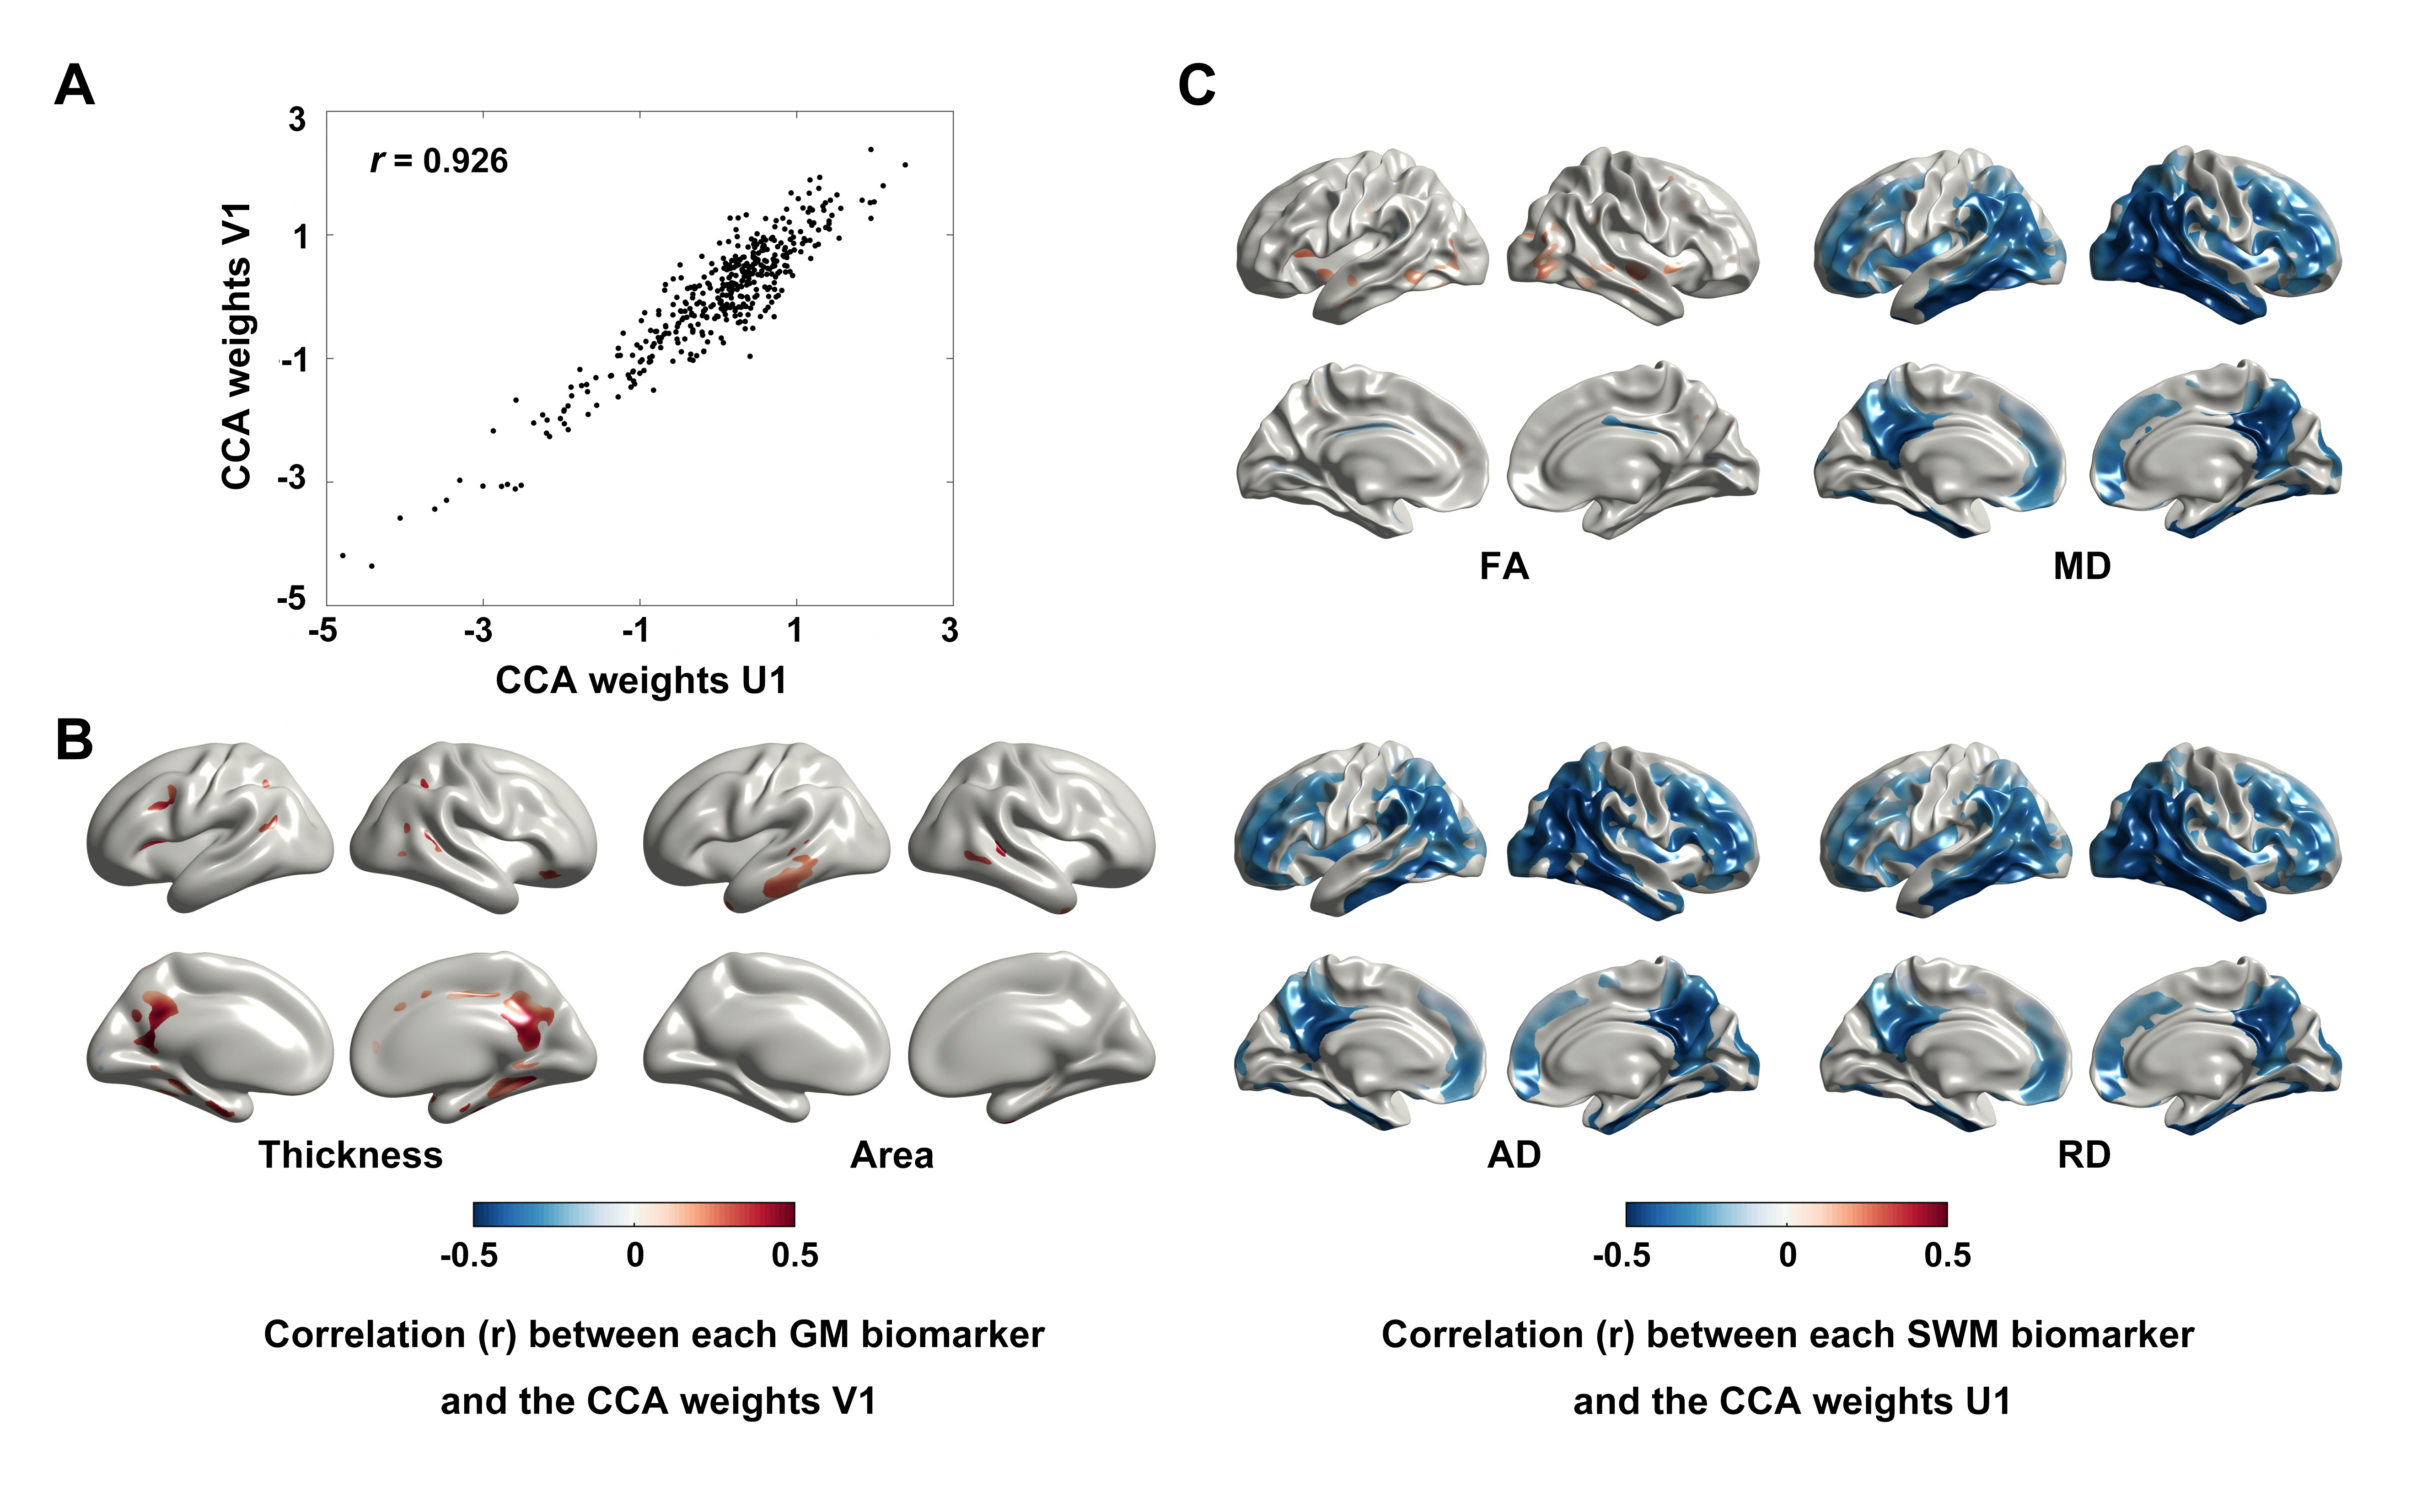
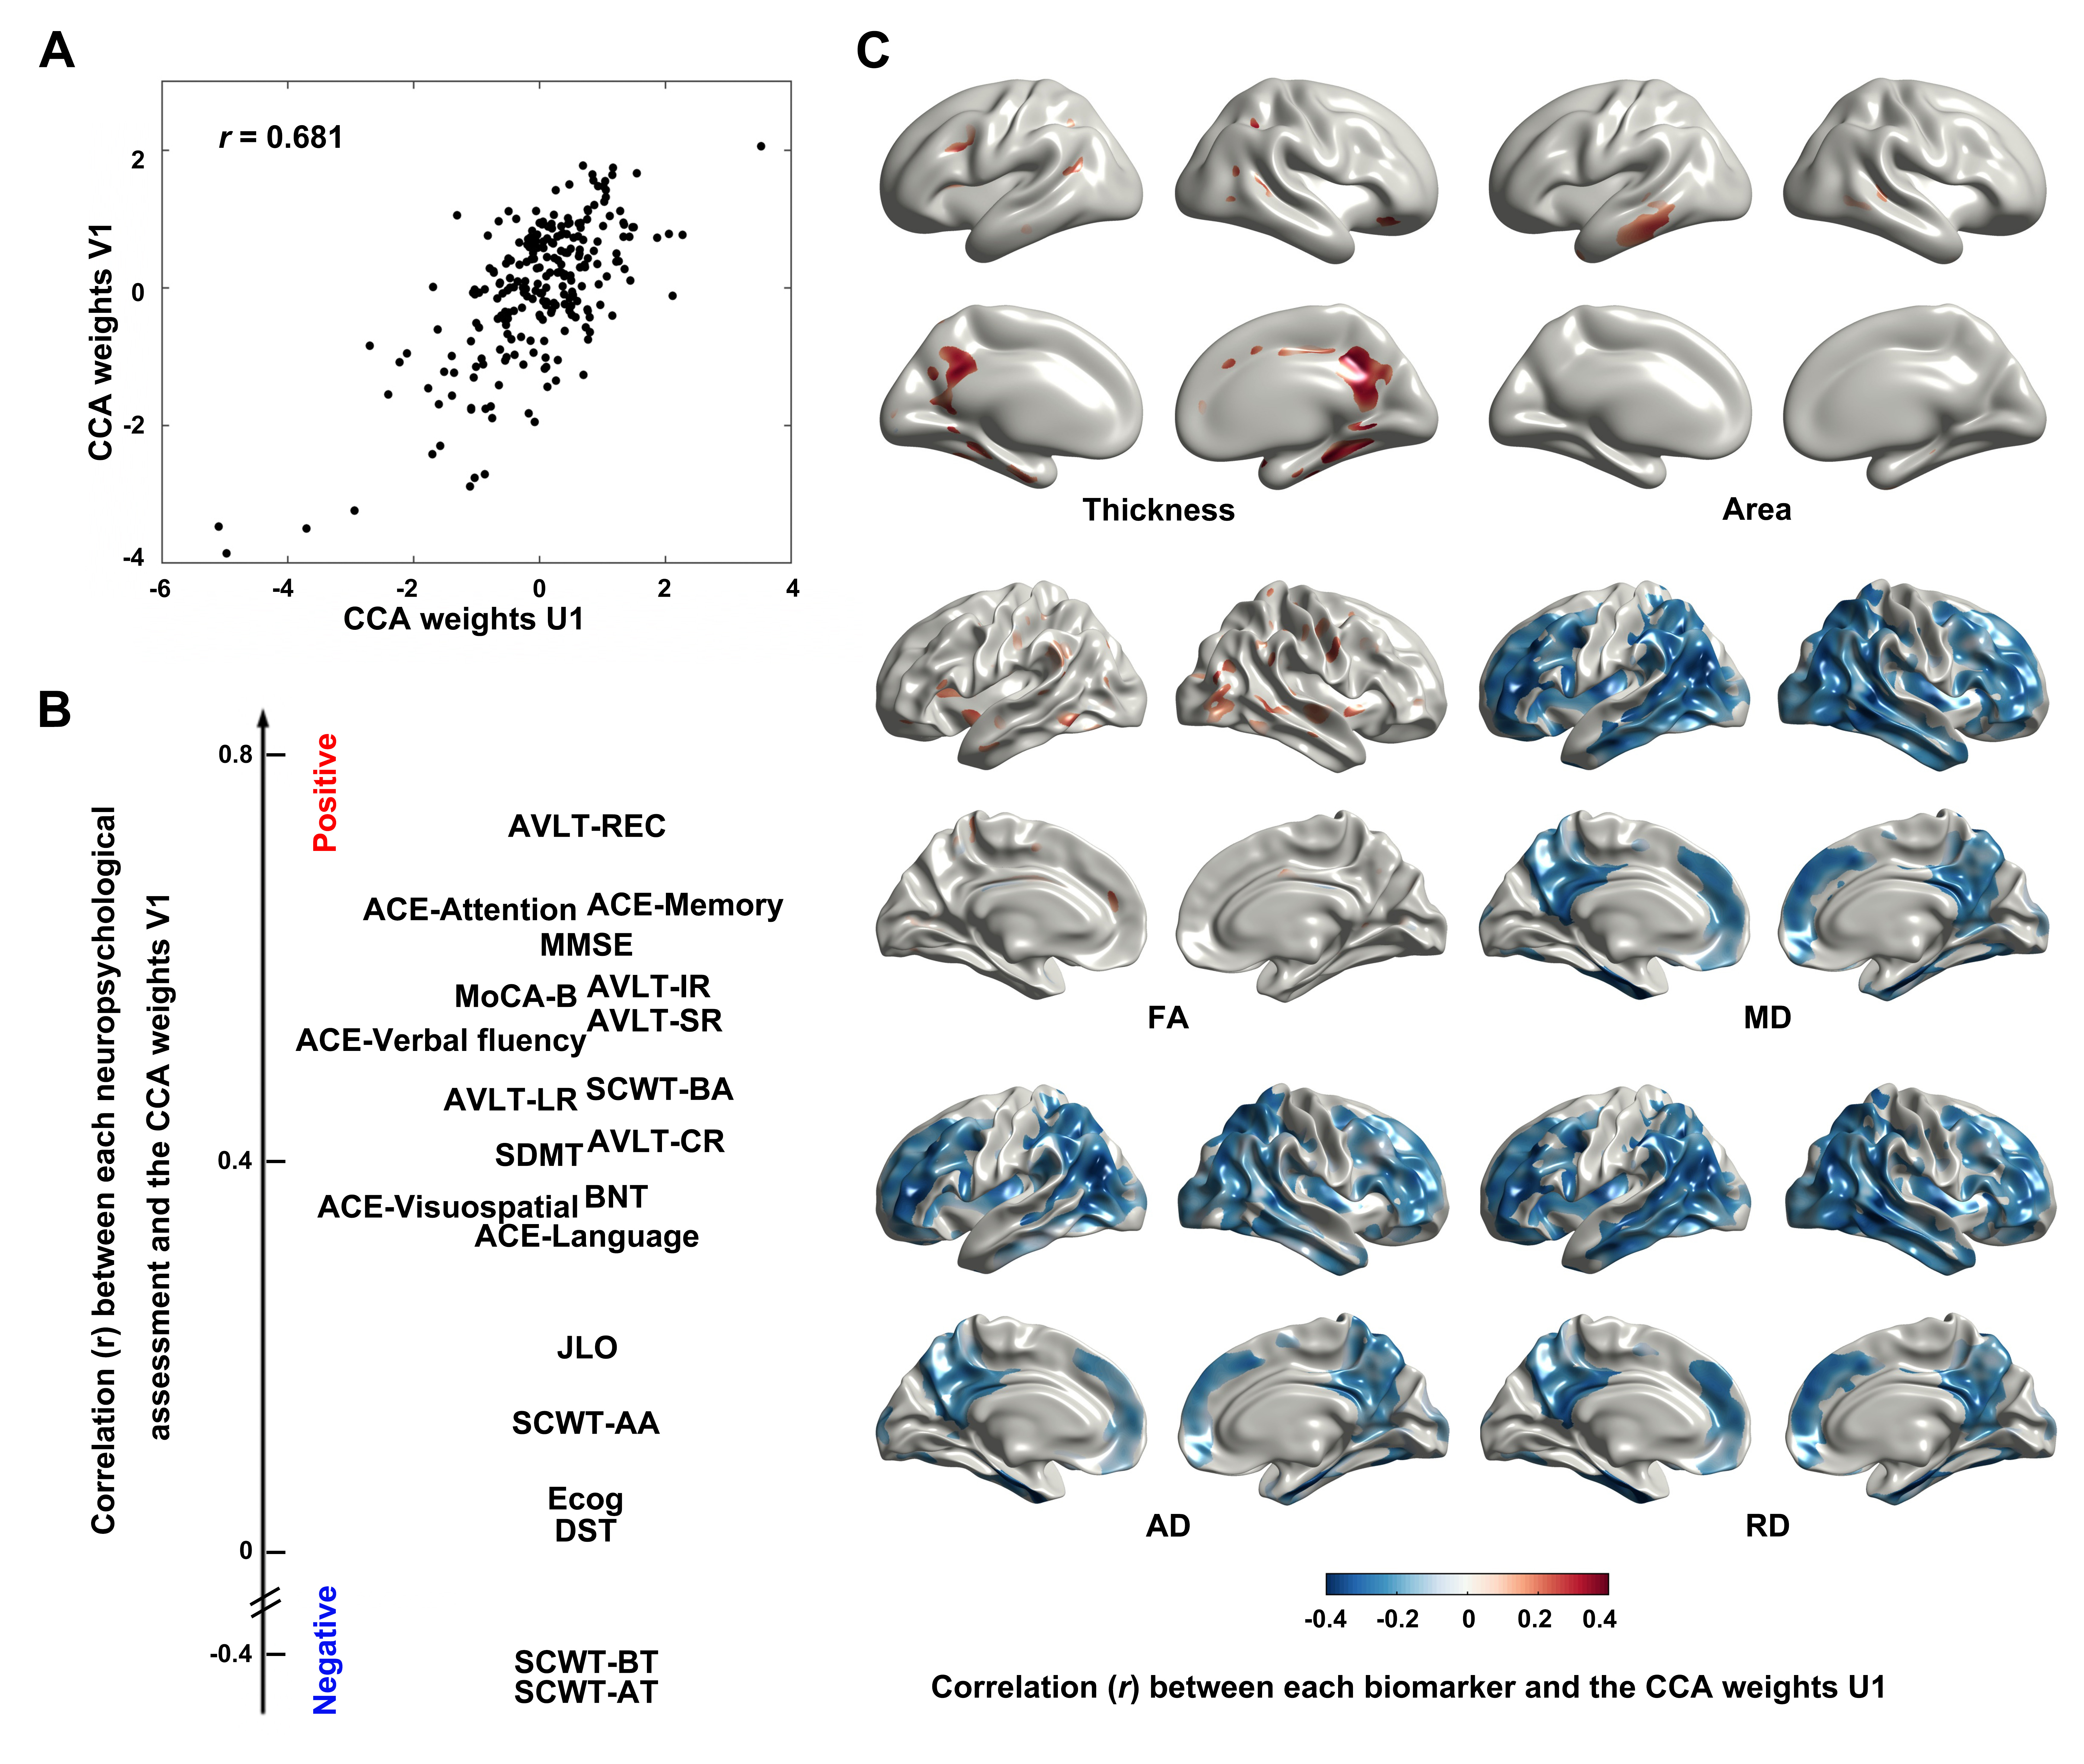
METHODS: This study involved 411 participants, including 129 healthy controls, 64 with subjective cognitive decline (SCD), 53 with objectively-defined subtle cognitive decline (Obj-SCD), 72 with amnestic mild cognitive impairment (aMCI), and 93 with mild AD. We collected diffusion and structural MRI and conducted a battery of neuropsychological tests. Initially, we computed vertex-wise biomarkers in both the superficial white matter (SWM) and cortical gray matter (GM), followed by an assessment of the differences between patients and healthy subjects. Furthermore, we utilized canonical correlation analysis (CCA) to investigate SWM-GM associations during disease progression, as well as the relationship between the patterns of degeneration in these biomarkers and cognitive performance.
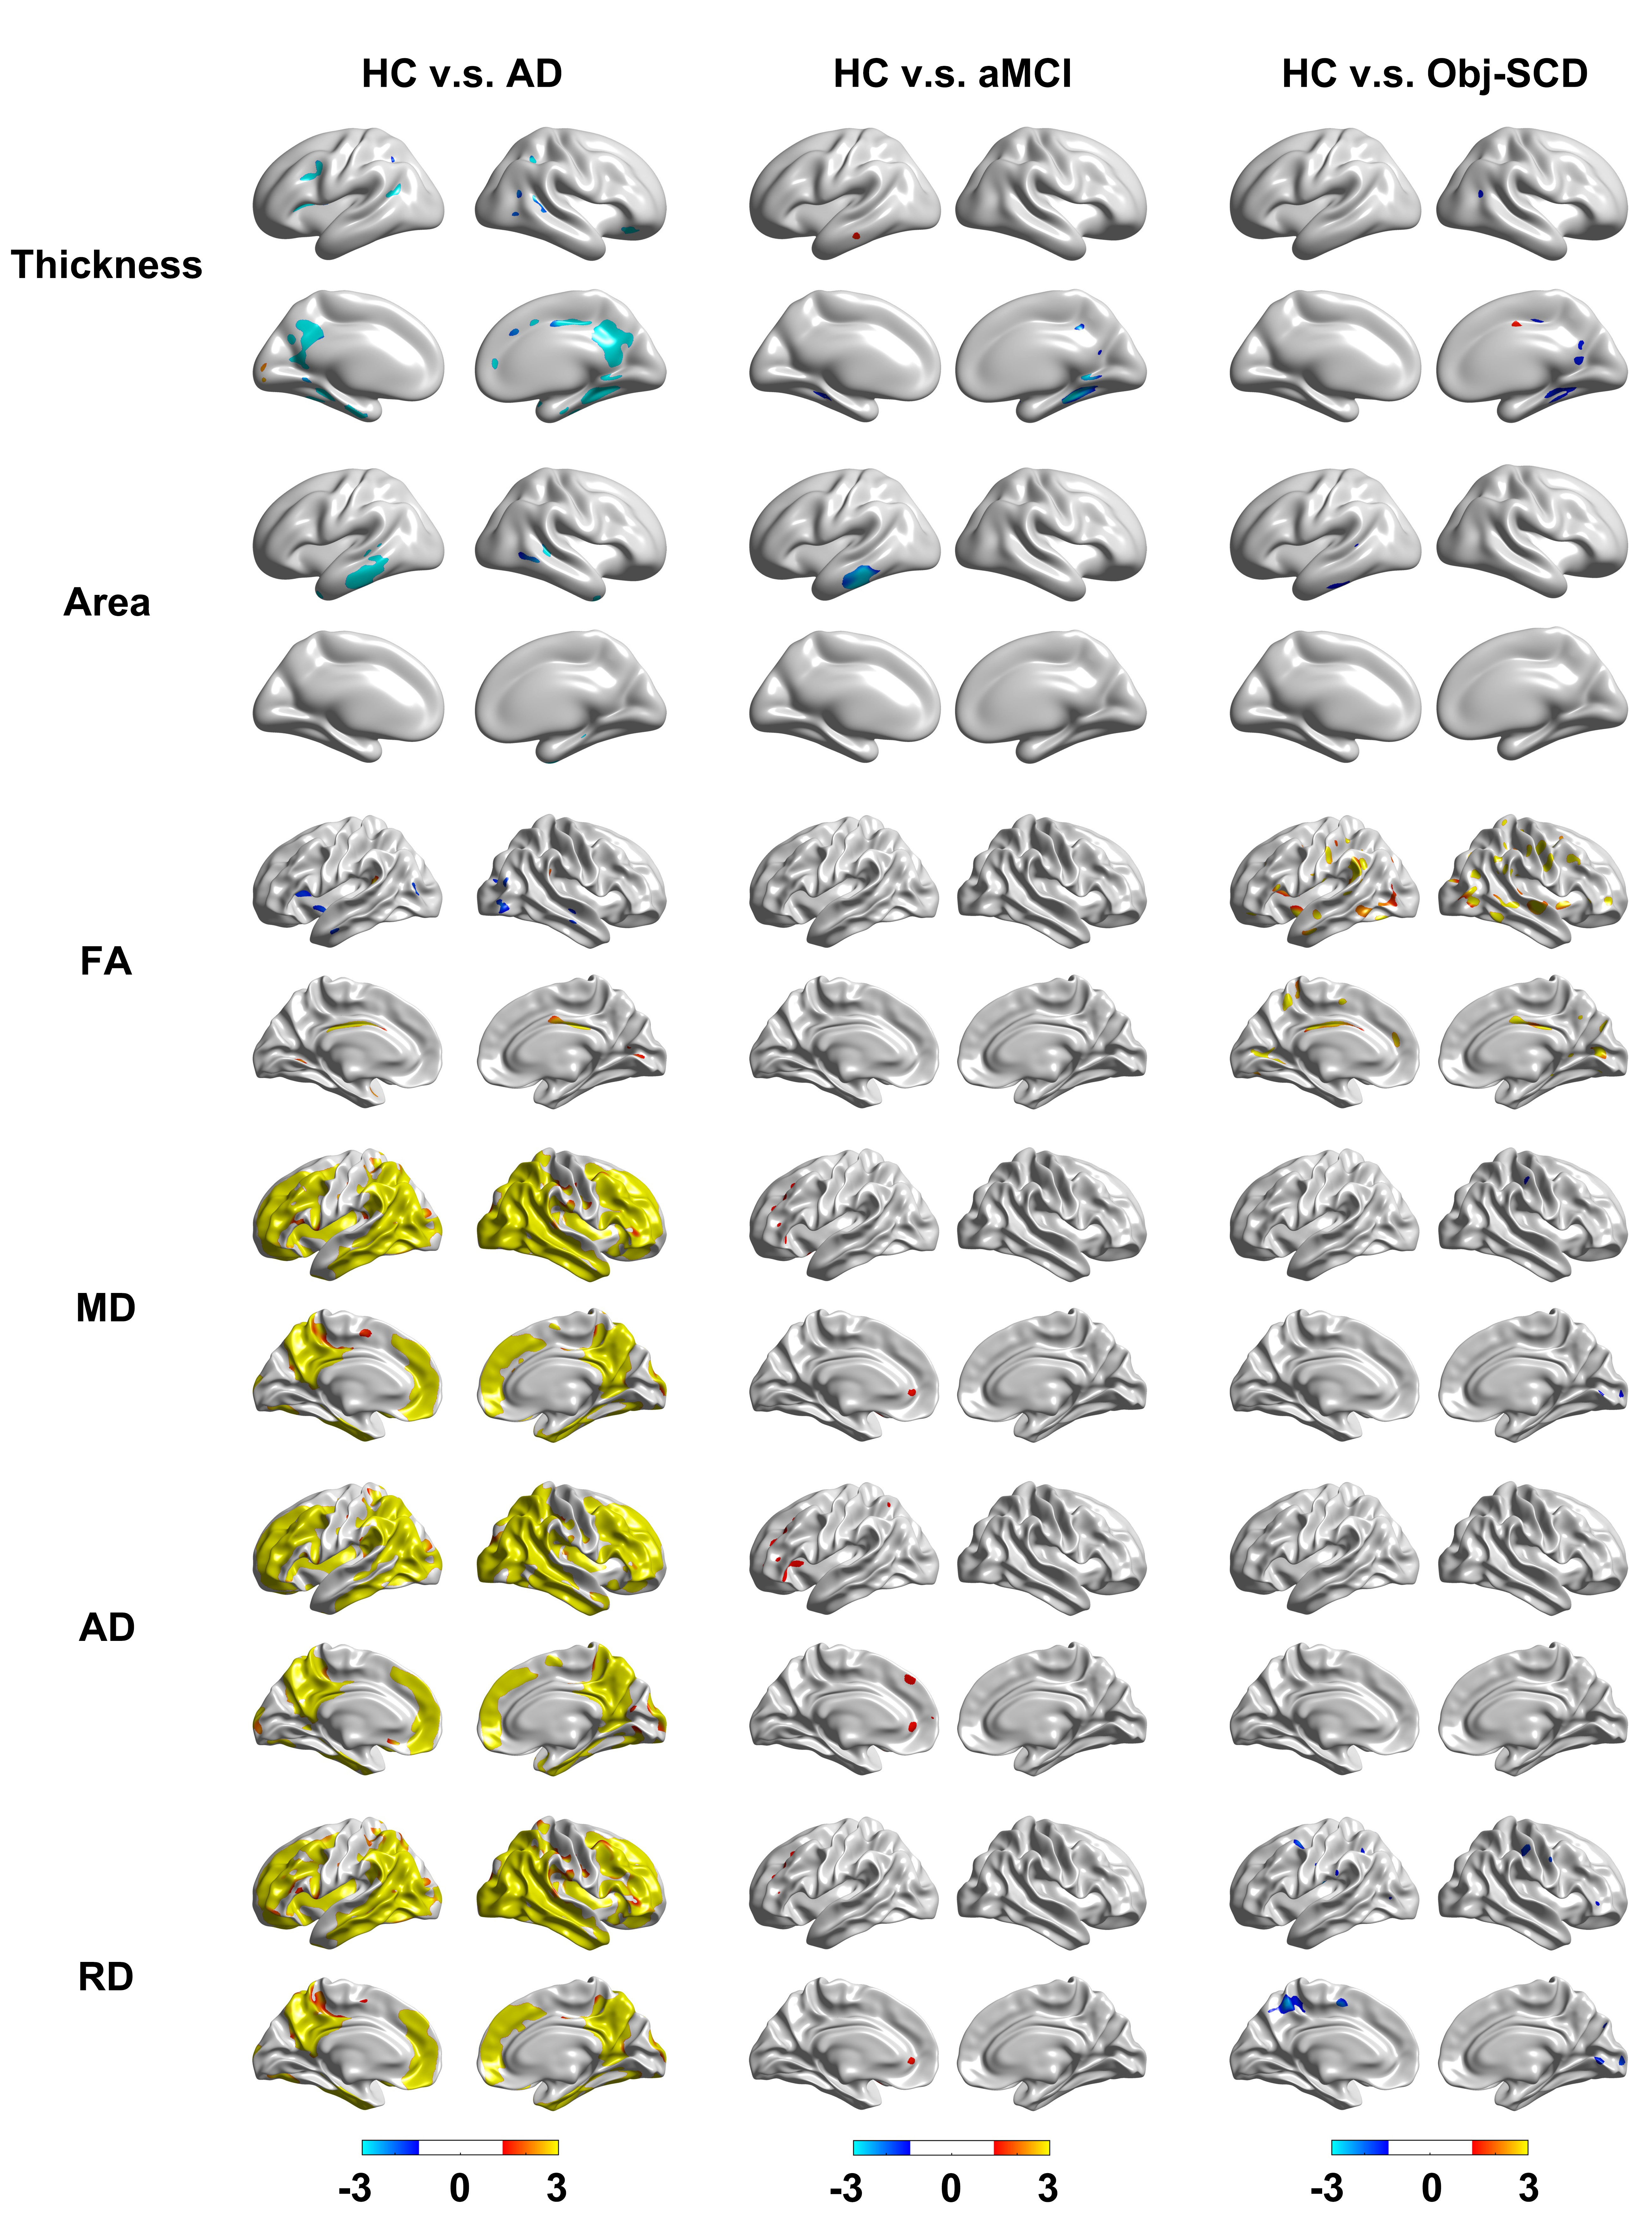
RESULTS: Results revealed distinct degeneration patterns in cortical GM and SWM. Compared to healthy subjects, individuals with Obj-SCD, MCI, and AD all displayed significant cortical thinning and decreased area in regions including the bilateral parahippocampal, precuneus, and entorhinal areas. Additionally, increased diffusivity was observed in extensive SWM regions among AD patients. Results of CCA proved that degeneration of these biomarkers is associated with cognitive impairment. These findings suggest that cortical atrophy in the temporal lobe may be a marker or trigger for disease onset, while extensive SWM degeneration appears to be associated with disease progression and distinctive brain dysconnectomics in AD.
DISCUSSION:
Pathological studies reveal a high concentration of neurofibrillary tangles in the entorhinal cortex and hippocampus in mild AD patients [12,13]. MRI studies support this by showing early AD pathology in the entorhinal cortex, followed by the hippocampus [14, 15]. Significant decreases in cortical thickness and area in the temporal cortex were found in patients with cognitive decline, indicating that GM biomarkers can serve as preclinical markers for early diagnosis and interventions. In SWM, increased diffusivity was observed in various brain regions, supporting the retrogenesis hypothesis that late myelinating regions are more susceptible to AD pathology. These findings suggest axonal atrophy and myelin damage in SWM occur in later disease stages, contributing to distinctive brain dysconnectomics in AD.
Despite distinct degeneration patterns in cortical GM and SWM, a strong correlation between SWM and GM degeneration was identified as a result of Wallerian degeneration during disease progression. Our results indicate that during the preclinical stages, neuronal loss initially occurs in the temporal lobe of individuals with Obj-SCD, limited to the temporal lobe in aMCI patients, and progressing to the precuneus region in AD patients. White matter changes first manifest in the frontal SWM region of aMCI patients, possibly due to the retrogenesis mechanism, and subsequently extend to most SWM regions in AD patients. White matter damage in SWM accelerates and spreads spatially more rapidly than neuronal loss in AD patients. SWM's role in phase synchronization and neuronal synchrony is crucial for optimal brain function [16]. Changes in SWM due to disease-related tissue alterations may disrupt signal propagation across the brain, potentially accelerating white matter degeneration in AD and contributing to whole-brain dysconnectomics in later stages.
Cognitive decline, particularly in memory, attention, and verbal fluency, significantly correlated with cortical degeneration patterns. Specific cognitive declines in AD development were observed, providing potential markers for preclinical diagnosis. Furthermore, reductions in scores for attention and visuospatial tasks in AD patients were linked to cortical thinning in the parietal regions, explaining deficits in parietal lobe functions.
CONCLUSION: This study reveals synergistic changes in cognitive function and imaging biomarkers during the disease progression, which emphasize the importance of multimodal studies in understanding the pathophysiology and underlying mechanisms of cognitive dysfunction. These findings are expected to provide strong support for future early diagnosis, intervention, and development of therapeutic strategies.
Acknowledgements
The authors would like to thank the support from the Institute of Science and Technology for Brain-Inspired Intelligence of Fudan University and Department of Gerontology of Shanghai Jiao Tong University Affiliated Sixth People's Hospital.References
1. Sperling, R.A., et al., Toward defining the preclinical stages of Alzheimer's disease: recommendations from the National Institute on Aging-Alzheimer's Association workgroups on diagnostic guidelines for Alzheimer's disease. Alzheimers Dement, 2011. 7(3): p. 280-92.2.
2. Jessen, F., et al., AD dementia risk in late MCI, in early MCI, and in subjective memory impairment. Alzheimers Dement, 2014. 10(1): p. 76-83.3.
3. Edmonds, E.C., et al., Subtle Cognitive Decline and Biomarker Staging in Preclinical Alzheimer's Disease. J Alzheimers Dis, 2015. 47(1): p. 231-42.4.
4. Jessen, F., et al., A conceptual framework for research on subjective cognitive decline in preclinical Alzheimer's disease. Alzheimers Dement, 2014. 10(6): p. 844-52.5.
5. Jack, C.R., Jr., et al., NIA-AA Research Framework: Toward a biological definition of Alzheimer's disease. Alzheimers Dement, 2018. 14(4): p. 535-562.6.
6. Mitchell, A.J., et al., Risk of dementia and mild cognitive impairment in older people with subjective memory complaints: meta-analysis. Acta Psychiatr Scand, 2014. 130(6): p. 439-51.7.
7. Thomas, K.R., et al., Using Neuropsychological Process Scores to Identify Subtle Cognitive Decline and Predict Progression to Mild Cognitive Impairment. J Alzheimers Dis, 2018. 64(1): p. 195-204.
8. Braak, H. and E. Braak, Development of Alzheimer-related neurofibrillary changes in the neocortex inversely recapitulates cortical myelogenesis. Acta Neuropathol, 1996. 92(2): p. 197-201.22.
9. Barkovich, A.J., Concepts of myelin and myelination in neuroradiology. AJNR Am J Neuroradiol, 2000. 21(6): p. 1099-109.23.
10. Schuz, A., et al., Quantitative aspects of corticocortical connections: a tracer study in the mouse. Cereb Cortex, 2006. 16(10): p. 1474-86.
11. Bozzali, M., et al., White matter damage in Alzheimer's disease assessed in vivo using diffusion tensor magnetic resonance imaging. J Neurol Neurosurg Psychiatry, 2002. 72(6): p. 742-6.
12. Haroutunian, V., et al., Neurofibrillary tangles in nondemented elderly subjects and mild Alzheimer disease. Arch Neurol, 1999. 56(6): p. 713-8.53.
13. Haroutunian, V., et al., Regional distribution of neuritic plaques in the nondemented elderly and subjects with very mild Alzheimer disease. Arch Neurol, 1998. 55(9): p. 1185-91.54.
14. Braak, H., E. Braak, and J. Bohl, Staging of Alzheimer-related cortical destruction. Eur Neurol, 1993. 33(6): p. 403-8.55.
15. Budde, M.D. and J. Annese, Quantification of anisotropy and fiber orientation in human brain histological sections. Front Integr Neurosci, 2013. 7: p. 3.
16. Grydeland, H., et al., Intracortical myelin links with performance variability across the human lifespan: results from T1- and T2-weighted MRI myelin mapping and diffusion tensor imaging. J Neurosci, 2013. 33(47): p. 18618-30.
Figures