0747
Longitudinal Changes of BBB Permeability and transcytolemmal permeability in Alzheimer’s Disease Mice: A Non-Contrast MRI Study1College of Biomedical Engineering and Instrument Science, Zhejiang University, Hangzhou, China, 2Department of Chemistry, Zhejiang University, Hangzhou, China, 3Department of Radiology, Johns Hopkins University, Baltimore, MD, United States
Synopsis
Keywords: Alzheimer's Disease, Alzheimer's Disease
Motivation: BBB disruption is demonstrated in Alzheimer’s disease (AD) but how does it change during the progression of disease, and its relationship with transcytolemmal water exchange are not clear.
Goal(s): We aimed to evaluate the longitudinal changes of water exchange across BBB and across cytomembrane in AD mice.
Approach: BBB permeability and transcytolemmal permeability to water were assessed in 3xTg-AD mouse from 6 to 10 months of age using WEPCAST and tDKI MRI, respectively.
Results: Elevation of BBB permeability in AD mice started as early as 6 months. Transcytolemmal permeability was found to increase in the hippocampus.
Impact: Current results suggested the potential role of BBB and transcytolemmal permeability as a biomarker in the early detection of AD. Their co-increase may be related to the altered glymphatic function.
Introduction
Water exchange occurs at several locations in the central nervous system, including blood-brain barrier (BBB) and cytomembrane, which has been associated with the glymphatic system and contribute to the waste clearance1. BBB dysfunction was demonstrated to be an early event in AD2, but how does it change in the progression of disease, and its relationship with transcytolemmal water exchange remain unclear.In this study, we aim to investigate the longitudinal changes of BBB permeability and transcytolemmal permeability to water with newly developed non-contrast MRI techniques in the 3xTg-AD mouse model.
Methods
Animals:Female 3xTg-AD and normal control (NC) C57BL/6 mice were imaged at 5, 6, 7, 8, 9 and 10 months of age (NAD,5=5, NNC,5=5; NAD,6=5, NNC,6=5; NAD,7=4, NNC,7=5; NAD,8=4, NNC,8=5; NAD,9=4, NNC,9=5; NAD,10=4, NNC,10=5)(at 5, 6, 7 months only BBB permeability was assessed). All MRI data was acquired on a 7.0 T Bruker Biospec scanner. Anesthesia of mice was induced with 3% isoflurane and maintained at 1.5% during the experiments. Breathing rate and temperature were monitored.
MRI acquisition:
Water-extraction-with-phase-contrast-arterial-spin-tagging (WEPCAST) was used to assess BBB permeability in mice3,4, which quantifies the fraction of labeled spins exchange into the cerebral tissue (E), yielding BBB permeability-surface-product (PS) (Figure 1a). The images were acquired in sagittal with labeling duration=2038.2 ms, and PLD=25 ms.
CBF were obtained using Phase-Contrast (PC) MRI at four feeding arteries (Figure 1b), with encoding velocity (VENC) of ICA and VA=20/10 cm/s, respectively.
The tDKI model was used to evaluate the transcytolemmal permeability in mice5–7, using the relationship between diffusion kurtosis (K) and diffusion time to obtain the transcytolemmal water exchange time (tex). Images were acquired using PGSE-EPI sequence, with δ=4 ms, ∆=10/15/20/25/30/35/40/45/50 ms, b-values=800/1500/2500 s/mm2 in 18 directions, resolution=0.1 mm×0.1 mm and 12 axial slices with 1 mm thickness.
MRI data analysis:
WEPCAST ΔM images were obtained by pairwise subtraction between control and label image. A ROI was manually delineated on ΔM/M0 images including vein of Galen (VG) to obtain ΔMvein/M0. E can be calculated based on4:
$$∆M_{vein}=2α(1-E) M_{0,blood} e^{-\frac{BAT_{vein}}{T_{1b}}}$$
where α is the labeling efficiency and BATvein is the bolus arrival time.
For PC MRI, ROIs were drawn on left/right ICA and VA and the total blood flow was calculated by the integration of voxles on the velocity map, which was normalized by the brain weight to obtain CBF8.
Then Permeability-Surface-Area-Product (PS) can be determined to represent BBB permeability9:
$$PS=-ln(1-E)×CBF$$
PGSE data post-processing was performed using DKE toolbox10 to obtain mean, axial and radial diffusivity and kurtosis (MD/AD/RD and MK/AK/RK) maps for each diffusion time(Figure 2b). D(t) curve was used to confirm the feasibility of the tDKI model assumptions 6. Least-squares nonlinear fitting on the K(t) curve (Figure 2c) was then used to estimate K0 and tex6,7:
$$K(t)=\frac{2K_0 t_{ex}}{t}[1-\frac{t_{ex}}{t}(1-e^{-\frac{t}{t_{ex}}})]$$
1/tex can be used to indicate transcytolemmal permeability.
Student’s t-test was employed to examine the statistical difference between AD and NC mice at each month. Linear mixed-effect model (LMM) was used to isolate the dependence of physiological parameters on age and group effects.
Results
Figure 3 presents age-dependent curves of CBF, brain volume, water extraction fraction (E), and PS in both groups of mice. AD mice showed smaller CBF and brain volume than controls but not significant. E significantly increased as early as 6 months of age and PS increased starting from 7 months.Figure 4 shows age-dependent curves of K0 and tex in whole brain, cortex, hippocampus and thalamus. Overall, smaller K0 and tex were shown in AD mice compared with controls, especially at older age.
LMM (Table 1) suggested that CBF (p=0.021), brain volume (p<0.001) and whole brain tex (p=0.038) changed significantly with age. AD mice showed significantly higher E (p<0.001) and PS (p<0.001), and lower CBF (p=0.0014), K0 in whole brain (p=0.0010) and hippocampus (p=0.027), tex in hippocampus (p=0.041) than controls.
Discussion and Conclusion
Increase in BBB permeability to water was reported in MCI patients2. Here our results showed a significant elevation of E and PS as early as 6 months in AD mice (corresponding to 30 years old in human), suggesting a dysregulation of substance exchange between blood and tissue at very early stage of the disease.This coexisted with a decreased tex, i.e. increased transcytolemmal water exchange permeability, especially at hippocampal region, indicating that the overall water transport may be altered in AD brain. This can be associated with a dysfunction in the glymphatic system, which regulates the clearance of waste and may be an underlying mechanism of amyloid deposition in AD. Continuing follow-up studies in combination with histological examination can be beneficial.
Acknowledgements
No acknowledgement found.References
1. Reeves BC, Karimy JK, Kundishora AJ, et al. Glymphatic System Impairment in Alzheimer’s Disease and Idiopathic Normal Pressure Hydrocephalus. Trends Mol Med. 2020;26(3):285-295.
2. Lin Z, Sur S, Liu P, et al. Blood–Brain Barrier Breakdown in Relationship to Alzheimer and Vascular Disease. Ann Neurol. 2021;90(2):227-238.
3. Lin Z, Li Y, Su P, et al. Non-contrast MR imaging of blood-brain barrier permeability to water. Magn Reson Med. 2018;80(4):1507-1520.
4. Wei Z, Liu H, Lin Z, et al. Non-contrast assessment of blood-brain barrier permeability to water in mice: An arterial spin labeling study at cerebral veins. NeuroImage. 2023;268:119870.
5. Kärger J. NMR self-diffusion studies in heterogeneous systems. Advances in Colloid and Interface Science. 1985;23:129-148.
6. Fieremans E, Novikov DS, Jensen JH, Helpern JA. Monte Carlo study of a two-compartment exchange model of diffusion. NMR Biomed. 2010;23(7):711-724.
7. Fieremans E, Lemberskiy G, Veraart J, Sigmund EE, Gyftopoulos S, Novikov DS. In vivo measurement of membrane permeability and myofiber size in human muscle using time-dependent diffusion tensor imaging and the random permeable barrier model. NMR Biomed. 2017;30(3).
8. Wei Z, Chen L, Lin Z, et al. Optimization of phase‐contrast MRI for the estimation of global cerebral blood flow of mice at 11.7T. Magn Reson Med. 2019;81(4):2566-2575.
9. Renkin EM. Transport of potassium-42 from blood to tissue in isolated mammalian skeletal muscles. Am J Physiol. 1959;197:1205-1210.
10. Tabesh A, Jensen JH, Ardekani BA, Helpern JA. Estimation of tensors and tensor-derived measures in diffusional kurtosis imaging. Magn Reson Med. 2011;65(3):823-836.
Figures
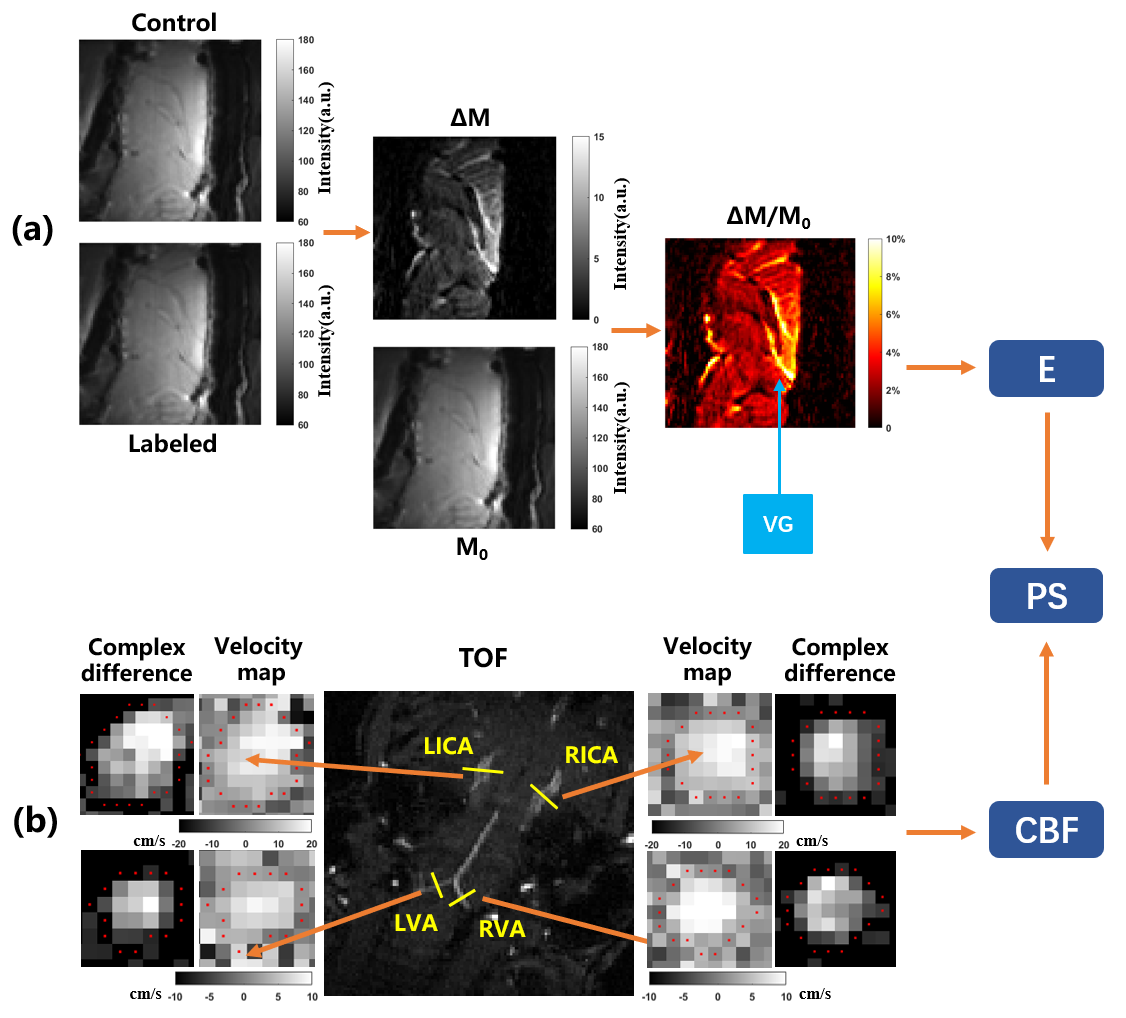
Figure 1 A sample dataset used in BBB permeability measurement. (a) shows the control, labeled, difference, M0, and ΔM/M0 images at the mid-sagittal plane. (b) shows the complex difference images and velocity maps of the four blood supply arteries (LICA, RICA, LVA, and RVA) by reference to a TOF image.
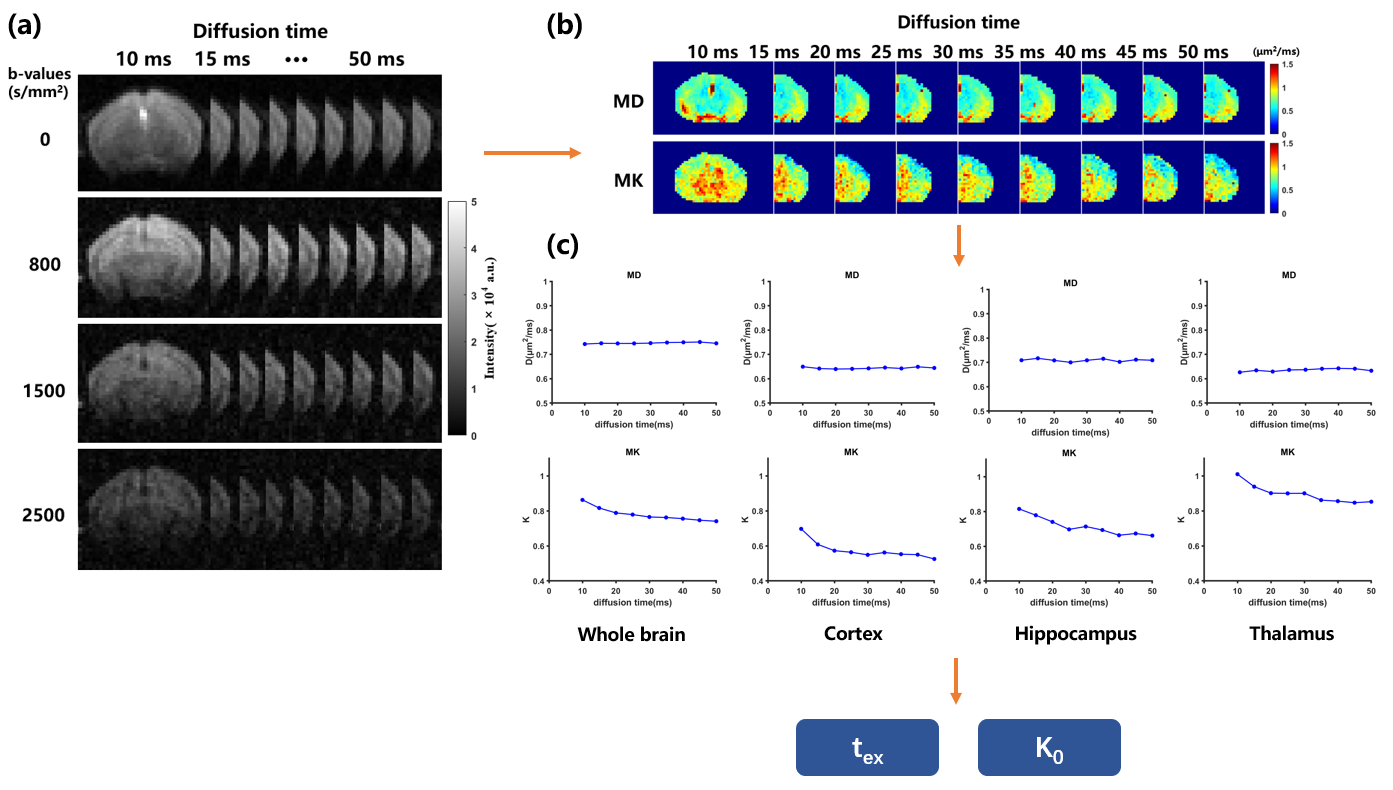
Figure 2 A sample dataset used in transcytolemmal permeability measurement. (a) shows one slice of the brain with all b-values (b0 and 800/1500/2500 s/mm2) at different diffusion times between 10 and 50 ms. (b) shows the MD/MK images at different diffusion times and (c) show D(t) and K(t) curves in whole brain, cortex, hippocampus and thalamus. K0 and tex can be obtained by K(t).
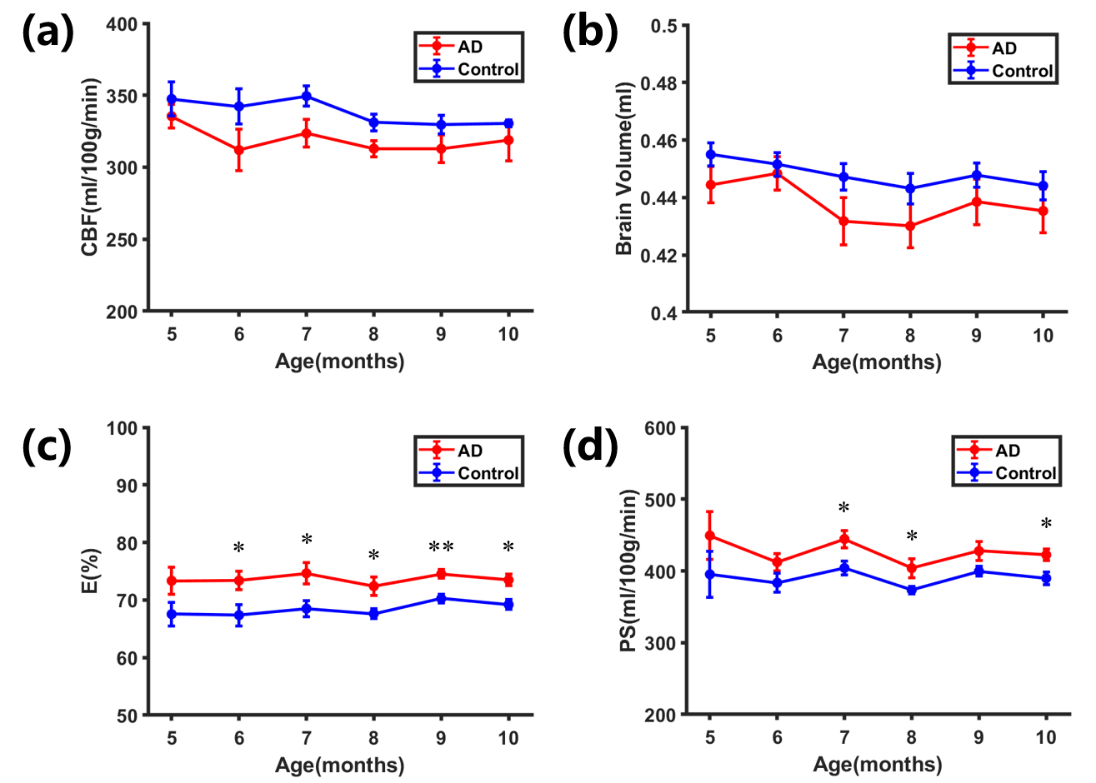
Figure 3 (a-d) Cerebral blood flow, brain volume and BBB permeability of AD and control mice as a function of age. Error bar stands for standard error across mice. Significant differences between groups are marked with * for p<0.05 and ** for p<0.01.
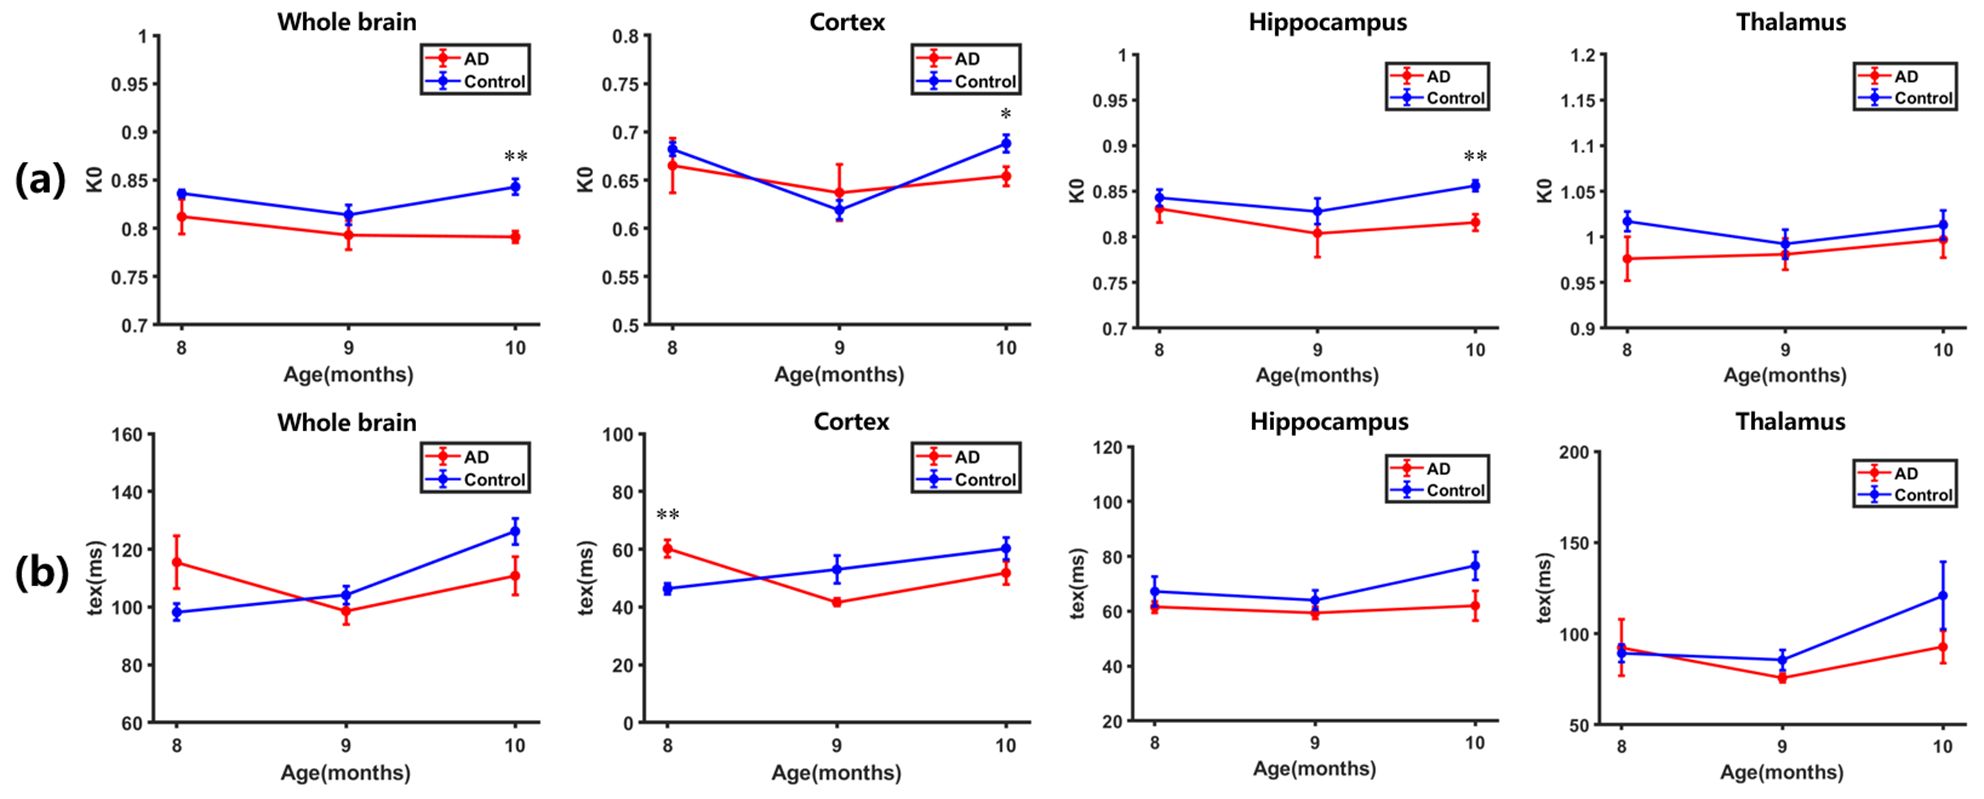
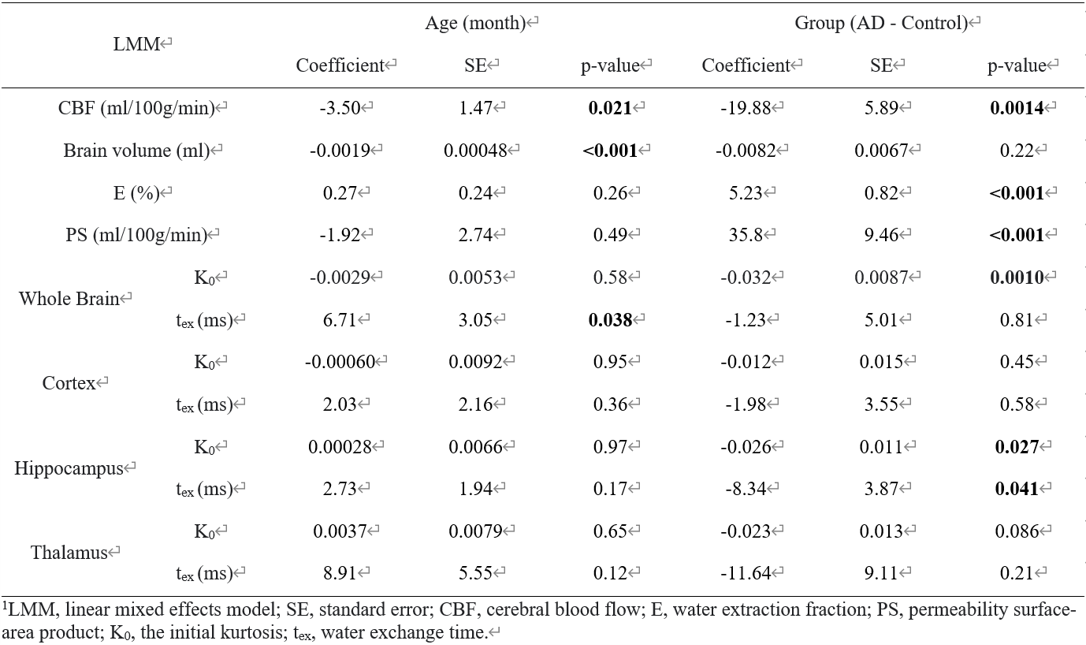
Table 1 Results of dependence of various physiological parameters (CBF, brain volume, E, PS, K0 and tex) on the age and group effects by using linear mixed-effects models. Left and right represent the age effect and the group effect, respectively.