0743
Multiomics analysis of the gut-microbiota-brain axis shows neural signatures of Crohn’s disease and its underlying mechanisms1Department of Radiology, The First Affiliated Hospital, Sun Yat-Sen University, Guangzhou, China, 2The First Affiliated Hospital, Sun Yat-Sen University, Guangzhou, China, 3MR Research Collaboration, Siemens Healthineers Ltd., Beijing, China
Synopsis
Keywords: Digestive, Infectious disease
Motivation: Neural alterations affect intestinal conditions. However, these neural alterations and their potential formation mechanisms remain unclear.
Goal(s): We integrated brain radiomics, the fecal microbiome, and blood metabolomics to investigate neural characteristics in patients with Crohn’s disease (CD) by establishing putative links between the gut microbiota, blood metabolites, and brain alterations.
Approach: Multiomics data were compared between CD patients and healthy controls.
Results: We developed a novel multiparameter brain MRI-based radiomics model to characterize the neural features of CD patients. Causal mediation analysis revealed significant pathways supporting the pivotal role of the gut-brain axis in neural alterations in CD patients.
Impact: We developed a novel multiparameter MRI-based radiomics model to comprehensively characterize neural alterations in patients with Crohn’s disease. We presented biologically plausible evidence of the formation mechanism underlying these alterations from a gut-microbiota-brain axis perspective.
Gut-microbiota-brain axis dysfunction has been shown to be a key contributor to the pathogenesis of Crohn’s disease (CD)1. Determining the biological mechanisms underlying neuropsychological alterations in patients with CD may provide novel insights into managing CD2. We developed a multiparameter brain magnetic resonance imaging (MRI)-based radiomics model (RM) to characterize neural alterations in patients with CD and investigate the underlying mechanisms.
Materials and methods
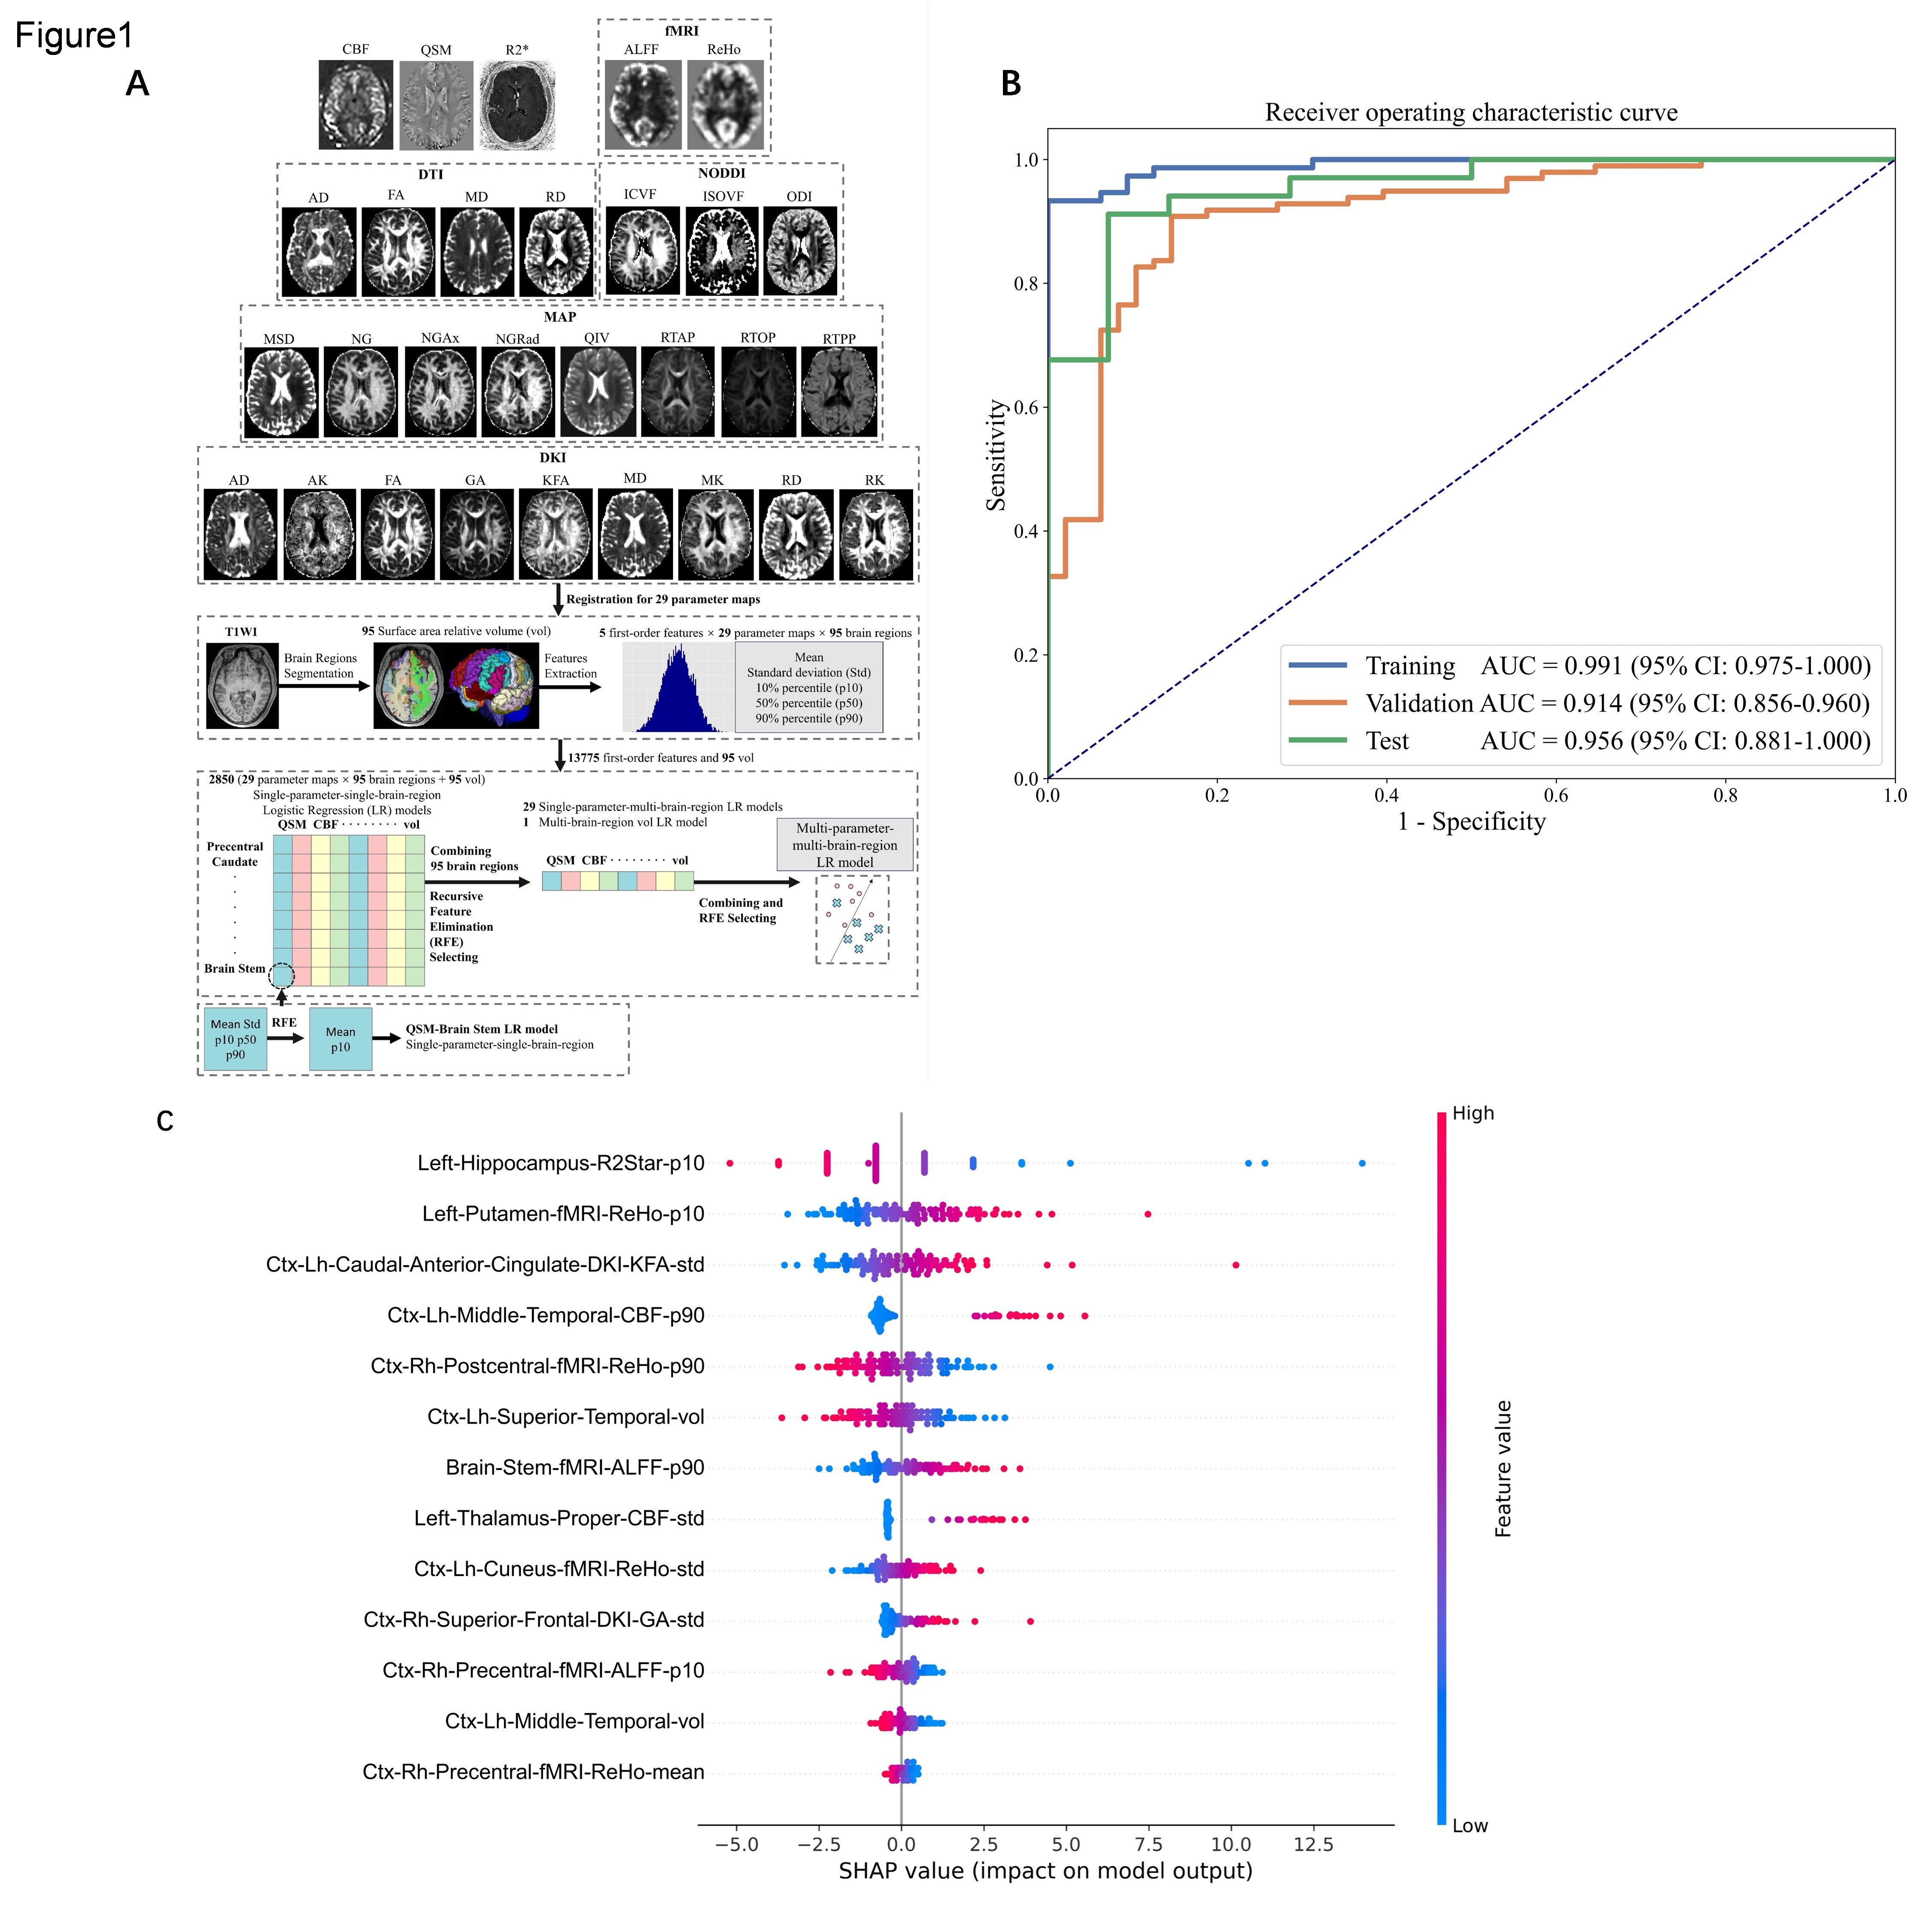
This prospective study included 230 patients with CD and 46 healthy controls (HCs). Participants underwent multiparameter brain MRI, including resting-state functional MRI (fMRI), diffusion spectrum imaging, quantitative susceptibility mapping (QSM), arterial spin labeling (ASL), and T1-weighted imaging (T1WI) on a 3T MR scanner (MAGNETOM Prisma, Siemens Healthcare, Erlangen, Germany; 155 patients); blood metabolomics (260 patients); fecal 16S rRNA sequencing (182 patients); and psychological assessment (155 patients). The following metrics were obtained to extract the radiomics features: cerebral blood flow (CBF) derived from ASL; susceptibility derived from QSM; amplitude of low-frequency fluctuations and regional homogeneity derived from fMRI; axial diffusivity, fractional anisotropy, mean diffusivity and radial diffusivity derived from diffusion tensor imaging; intracellular volume fraction, isotropic volume fraction, and orientation dispersion index derived from neurite orientation dispersion and density imaging; mean squared displacement, non-Gaussian distribution, axial non-Gaussian distribution, radial non-Gaussian distribution, q-space inverse variance, return-to-axis probability, return-to-origin probability, and return-to-plane probability derived from the mean apparent propagator; and axial kurtosis, geodesic anisotropy, kurtosis fractional anisotropy, mean kurtosis, and radial kurtosis derived from diffusion kurtosis imaging (DKI). The RM was developed based on 13 features selected from 13,870 first-order features extracted from different brain regions on multiparameter MRI in the training cohort and validated in an independent test cohort using an open-source tool-FeAture Explorer3 (Fig. 1A). Multiomics data (brain radiomics, fecal microbiome, and blood metabolomics data) were compared between CD patients and HCs. Pearson correlation and causal mediation analyses were used to investigate the gut-microbiota-brain axis.
Results
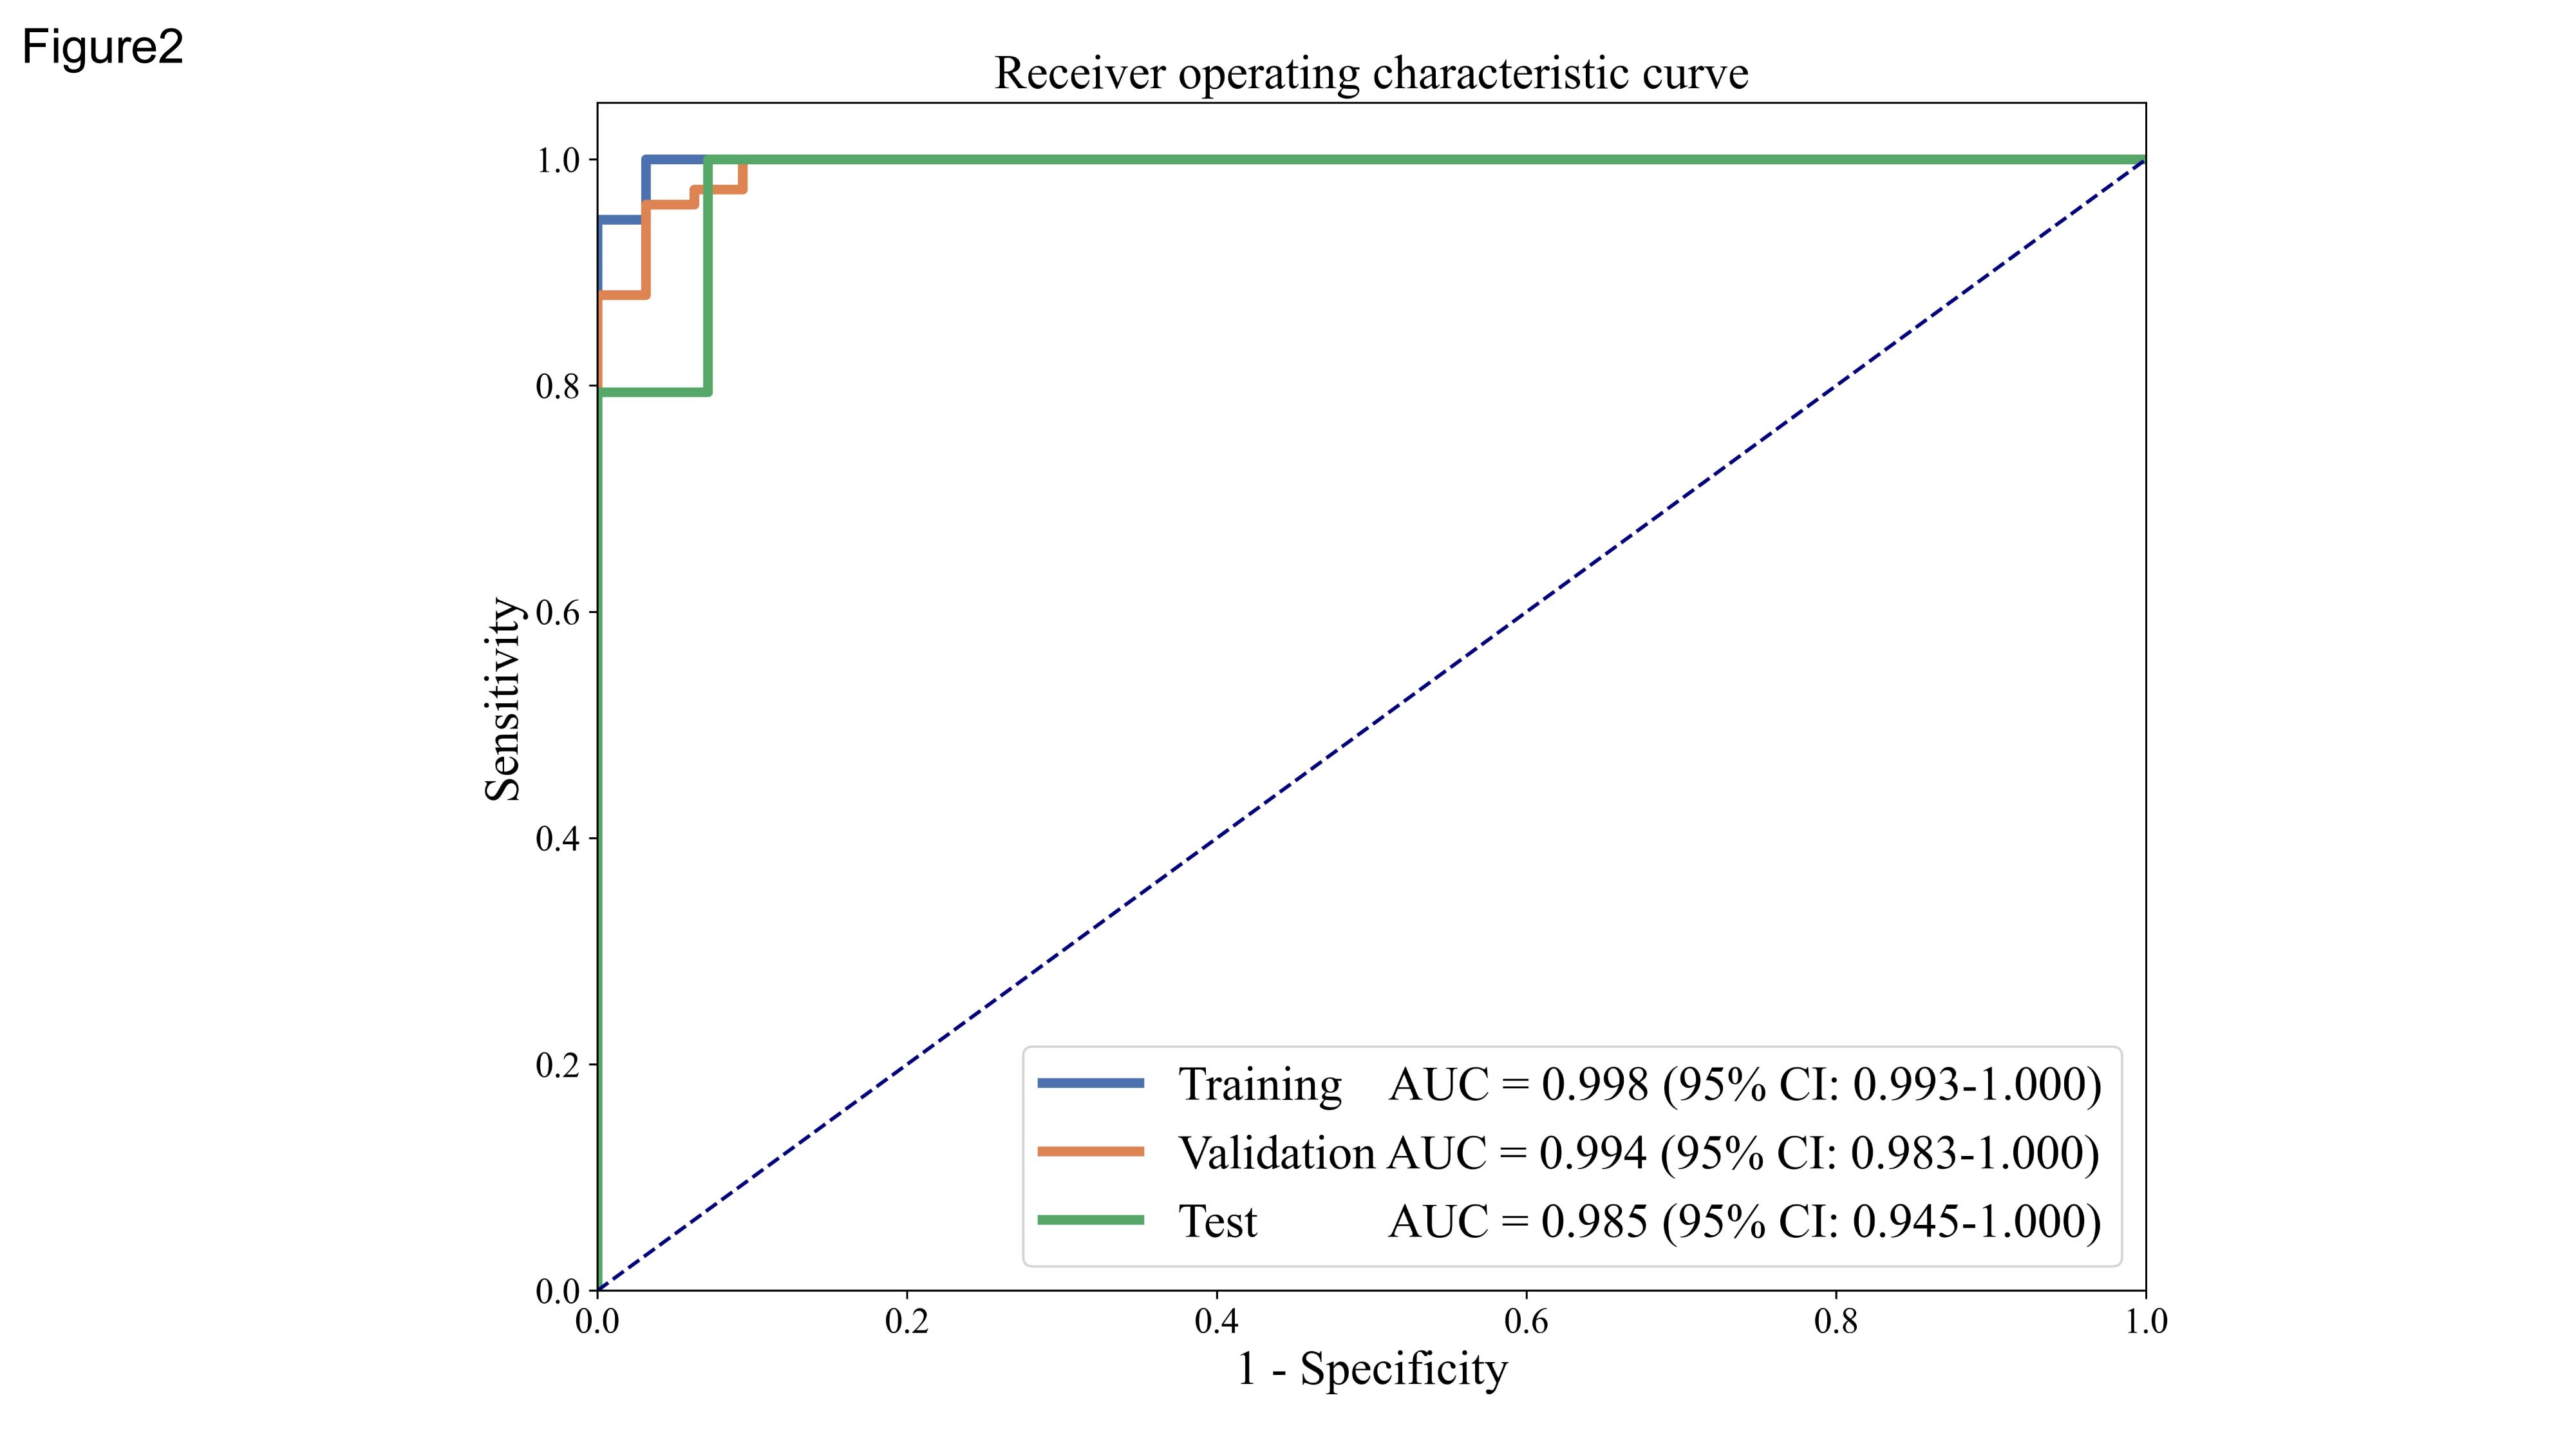
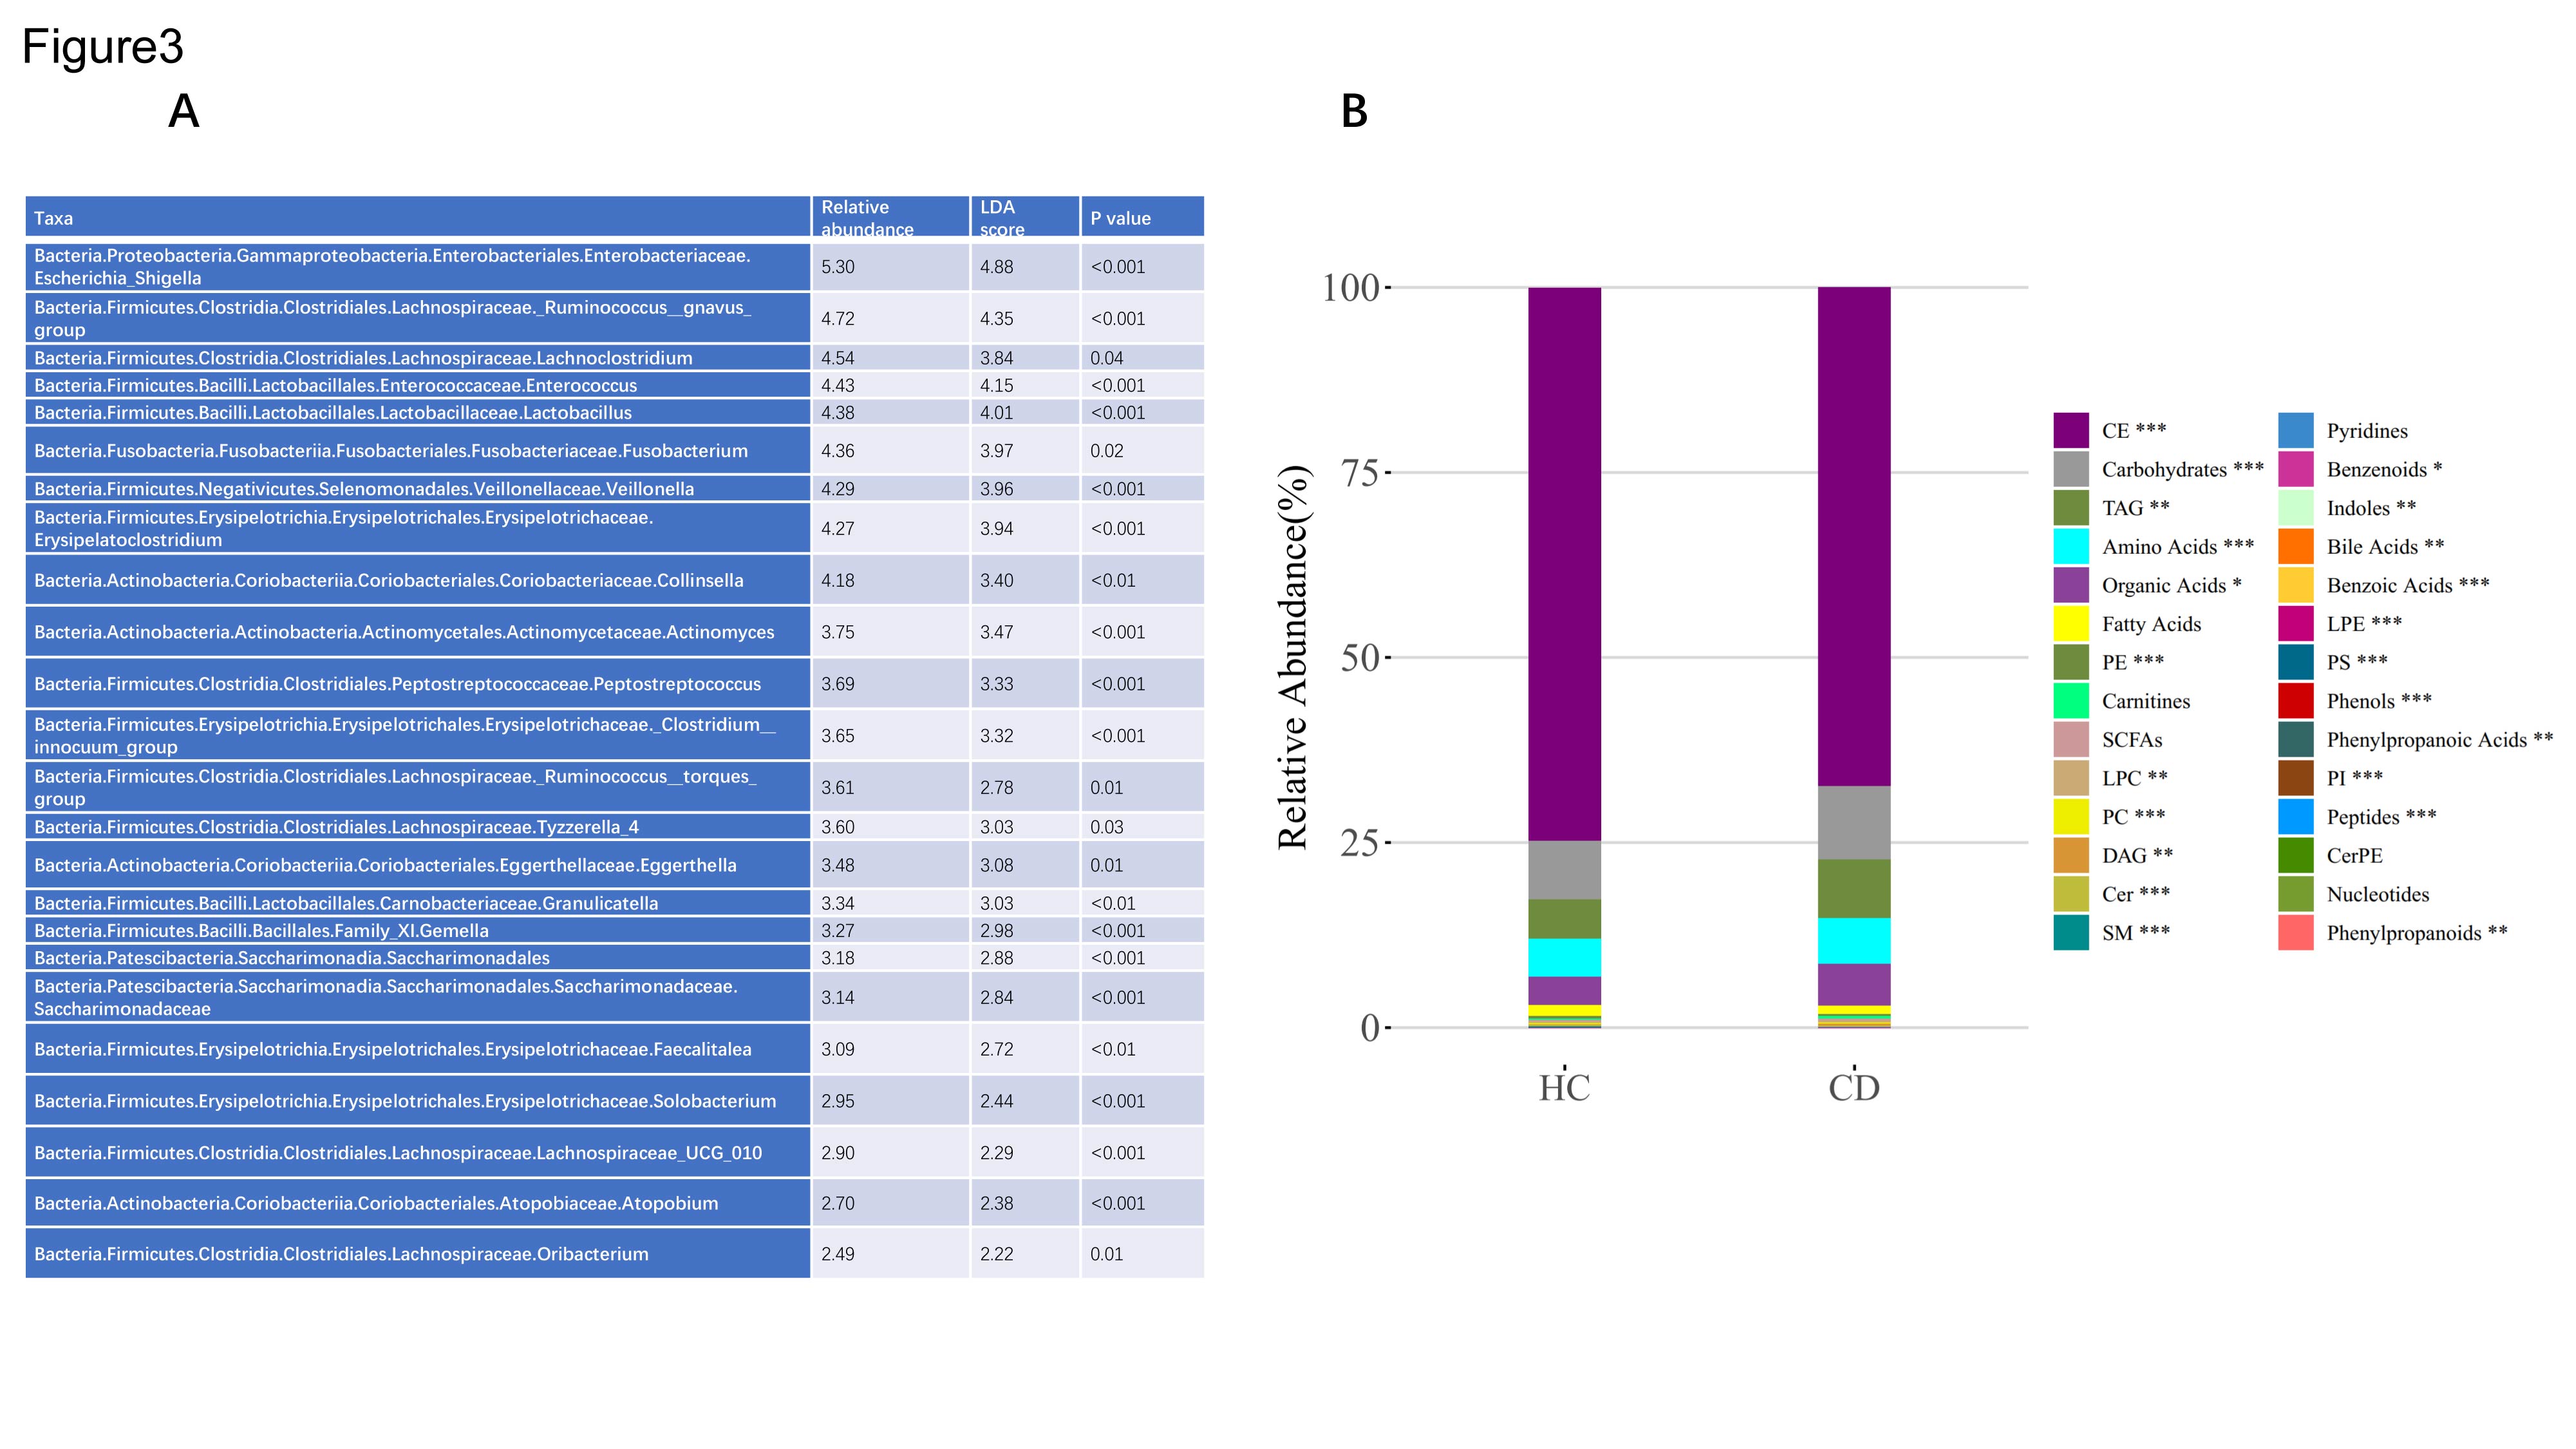
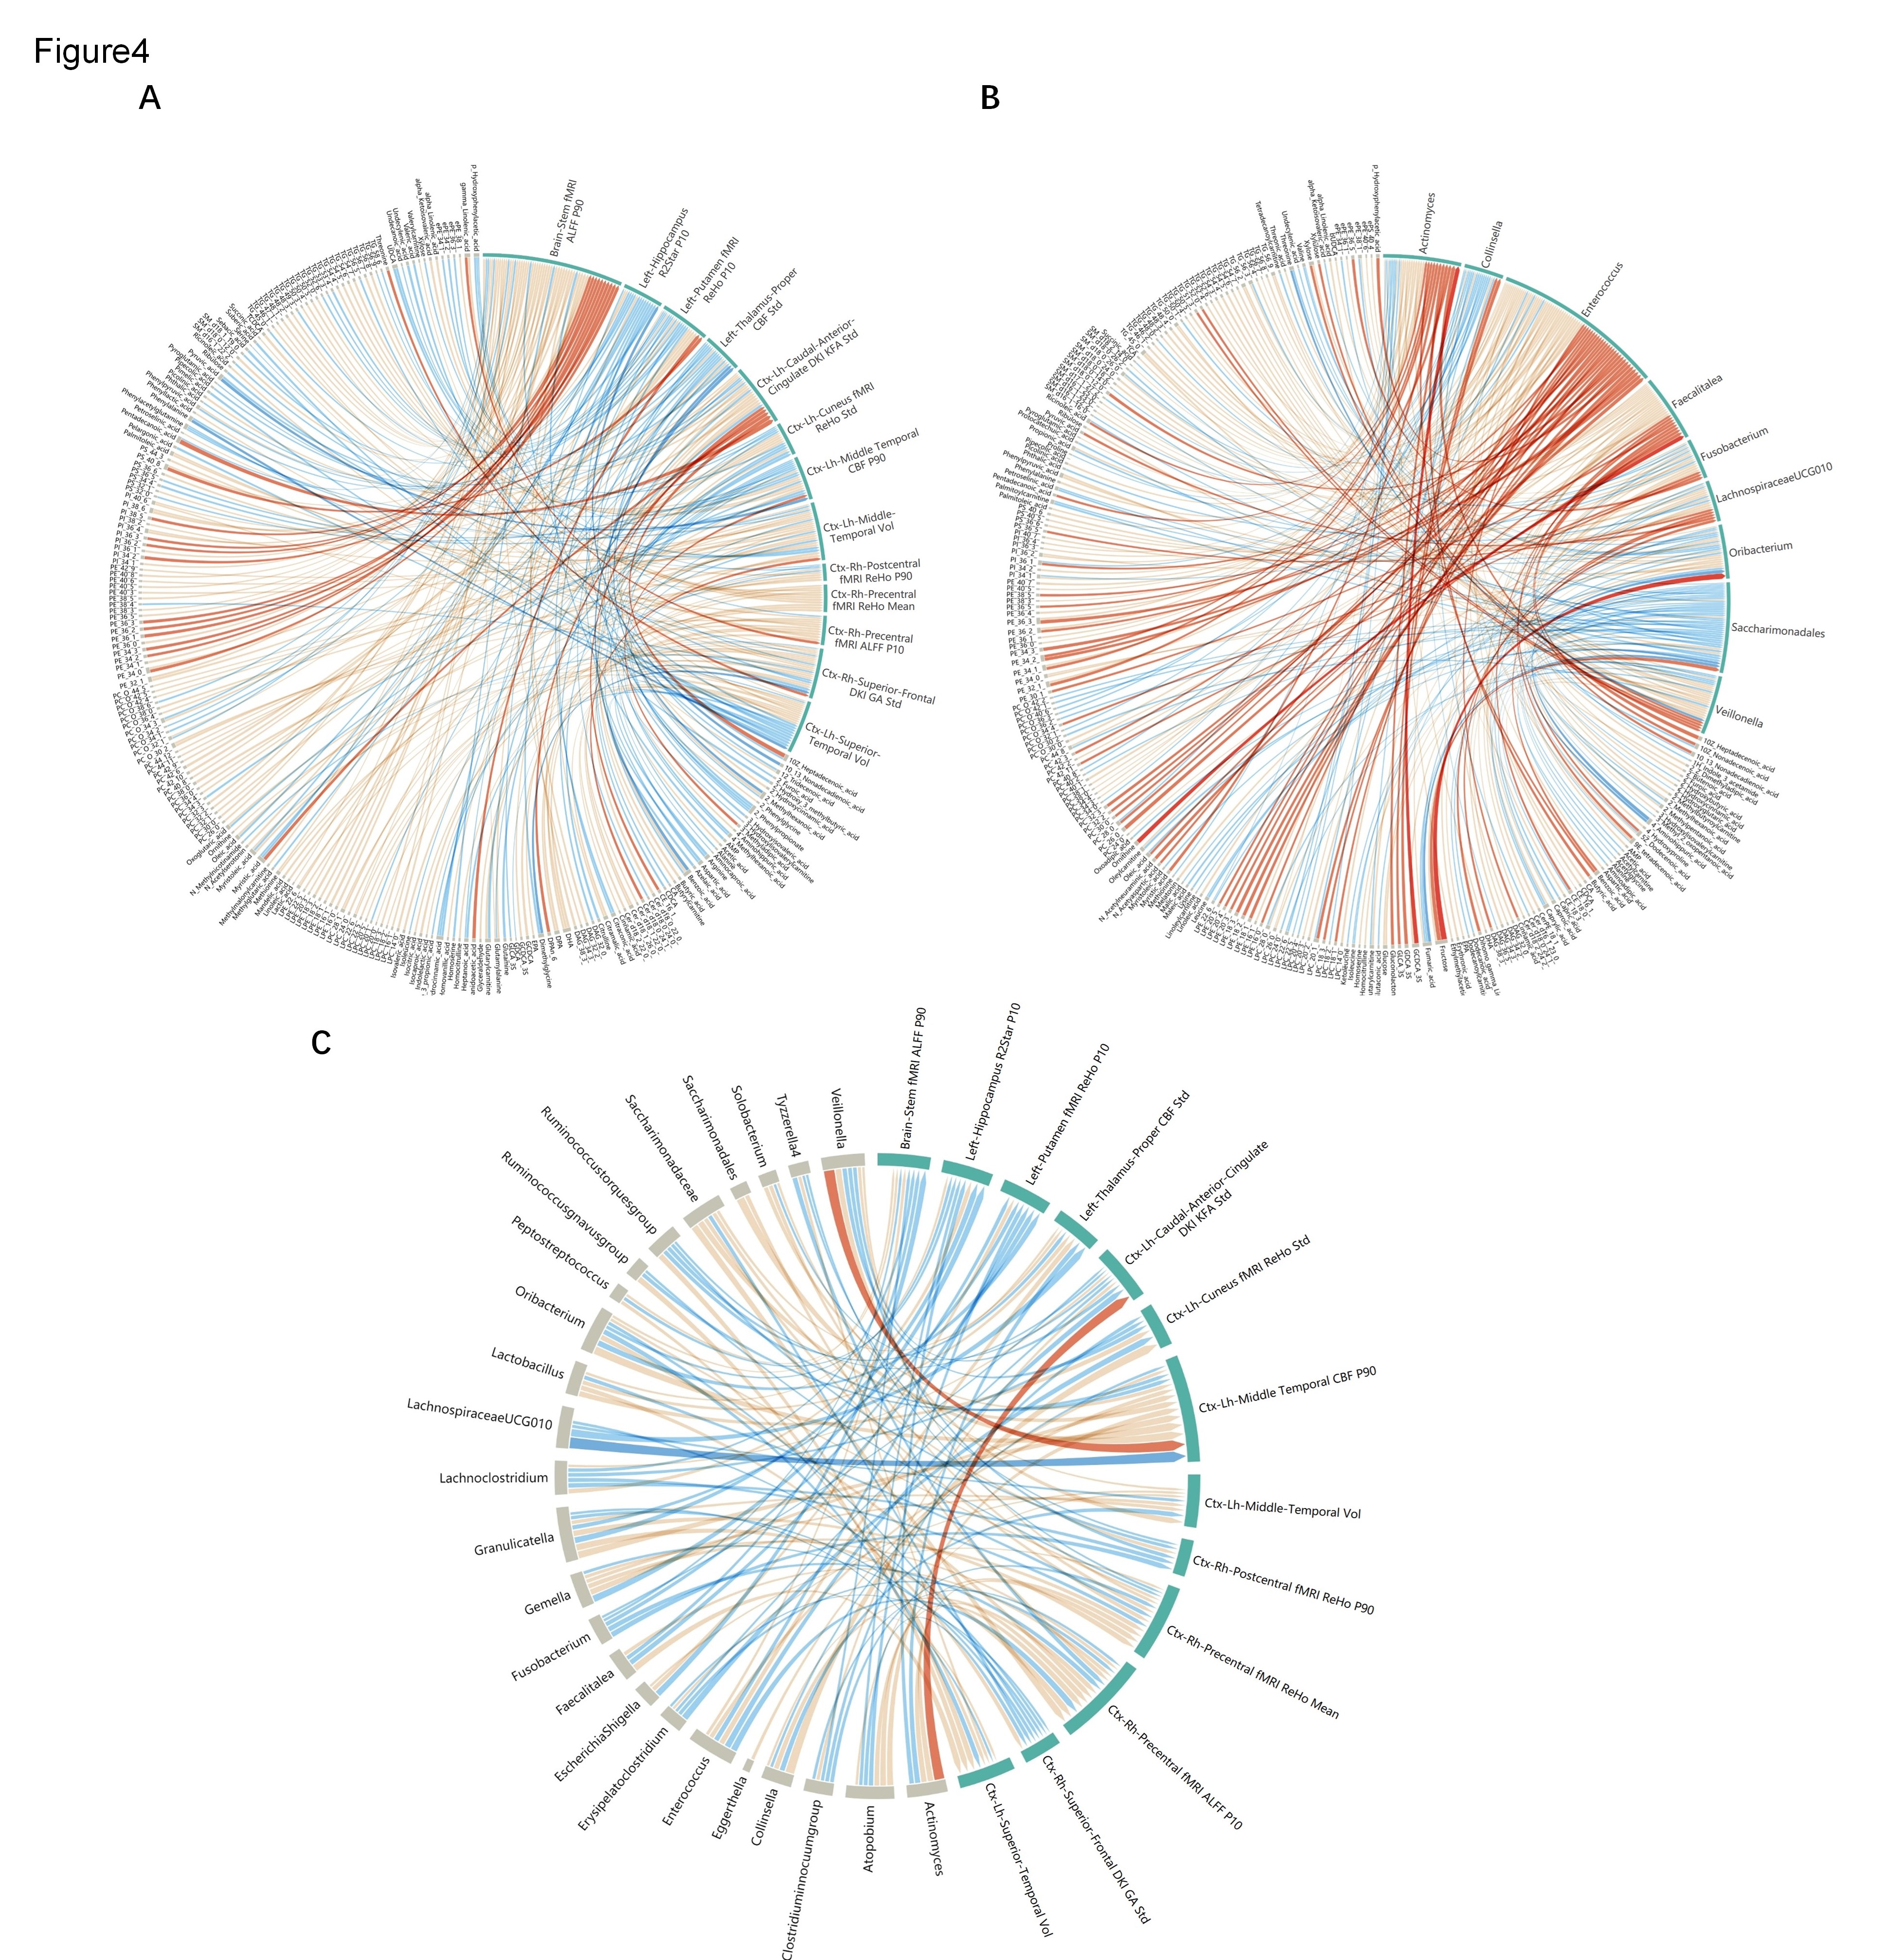
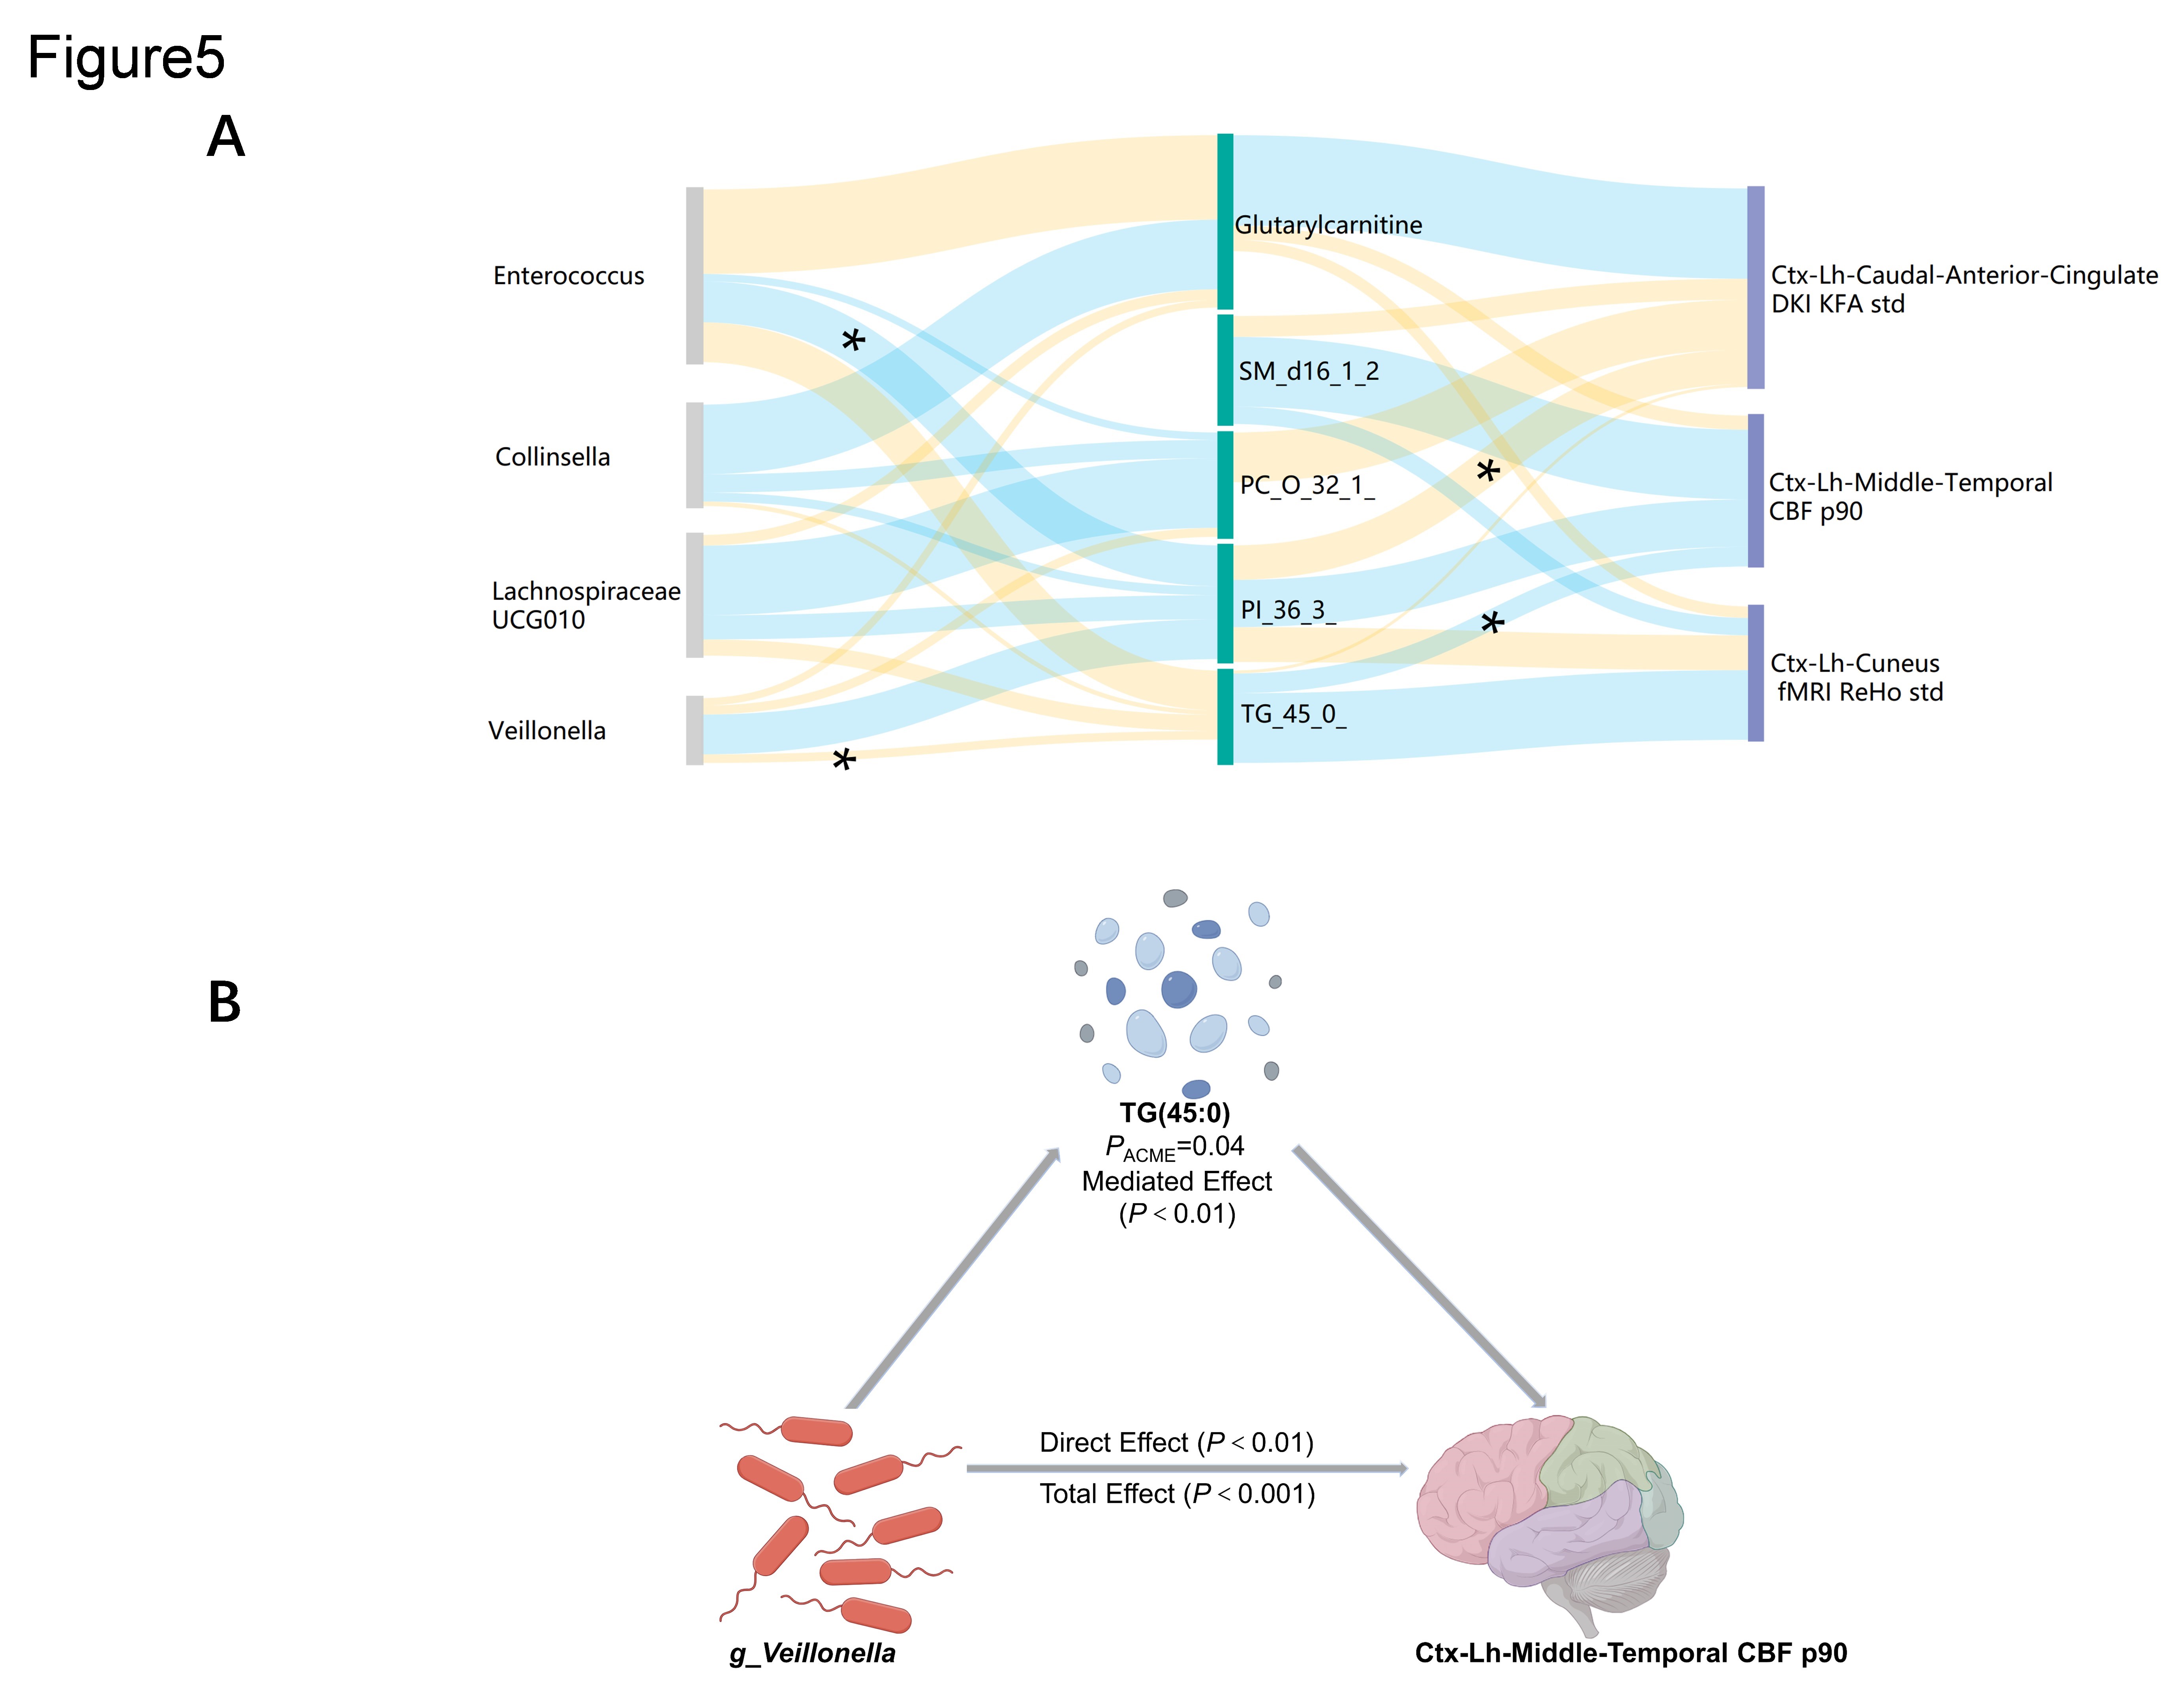
In the training cohort, the area under the receiver operating characteristic curve (AUROC) of the RM for distinguishing CD patients from HCs was 0.991 (95% confidence interval [CI]: 0.975–1.000). In the test cohort, the RM showed robust performance (AUROC: 0.956, 95% CI: 0.881–1.000; Fig. 1B). Figure 1C shows the 13 features selected by the RM. The comprehensive brain-psychological-clinical model significantly improved the predictive performance of the RM, reaching a maximum AUROC of 0.998 in the training cohort (Fig. 2). Microbes involved in gut dysbiosis (e.g., g_Veillonella, g_Enterococcus, and g_Collinsella; Fig. 3A) and altered blood metabolites (e.g., triacylglycerol, phosphatidylinositol, phosphatidylcholine, and glutarylcarnitine; Fig. 3B) were correlated with brain changes detected in CD patients by the RM (Fig. 4A–C). Causal mediation analysis revealed that dysbiosis of microbes such as Veillonella may regulate the blood flow in the middle temporal lobe through triacylglycerol 45:0 (Fig. 5A–B). Discussion: We identified new neural alterations in patients with CD, including lower R2* values in the left hippocampus, higher kurtosis fractional anisotropy on DKI in the left caudal anterior cingulate cortex, increased geodesic anisotropy on DKI in the right superior frontal cortex, and enhanced CBF in the left middle temporal cortex and left thalamus. Subsequently, we developed a novel RM using multiparameter brain MRI to accurately characterize neural features in patients with CD. The multiomics approach revealed significant and intricate relationships between the RM, the gut microbiota, and blood metabolites, providing insight into the pathways mediated by the gut-microbiota-brain axis that may underlie neuropathological mechanisms in patients with CD who exhibit these brain structural and functional changes. For example, metabolization of blood triacylglycerol 45:0 by Veillonella may lead to CBF alterations in the left middle temporal cortex (Fig. 5B).
Conclusion
We developed a multiparameter MRI-based RM that comprehensively characterized the neural alterations of CD patients and presented biologically plausible evidence of the formation mechanism underlying these alterations from a gut-microbiota-brain axis perspective. Our study provides new insight into the CD pathogenesis and potential therapeutic targets.
Keywords: Crohn’s disease; gut-microbiota-brain axis; radiomics; multiomics
Acknowledgements
NoneReferences
1. Ancona A, Petito C, Iavarone I, et al. The gut-brain axis in irritable bowel syndrome and inflammatory bowel disease. Digestive and Liver Disease : Official Journal of the Italian Society of Gastroenterology and the Italian Association For the Study of the Liver 2021;53:298-305.
2. Bisgaard TH, Poulsen G, Allin KH, et al. Longitudinal trajectories of anxiety, depression, and bipolar disorder in inflammatory bowel disease: a population-based cohort study. EClinicalMedicine 2023;59:101986.
3. Song Y, Zhang J, Zhang Y-D, et al. FeAture Explorer (FAE): A tool for developing and comparing radiomics models. PloS One 2020;15:e0237587.
Figures