0742
Brain metabolites and regional cerebral blood volume altered in anti-NMDAR encephalitis patients1Radiology, University of Nebraska Medical Center, Omaha, NE, United States, 2Neurological Sciences, Division of Epilepsy, University of Nebraska Medical Center, Omaha, NE, United States, 3Neurological Sciences, Division of Neuropsychology, University of Nebraska Medical Center, Omaha, NE, United States
Synopsis
Keywords: Epilepsy, Neuroinflammation, anti-NMDAR, Spectroscopy, rCBV
Motivation: The chronic phase of autoimmune encephalitis includes persistent loss of cognitive and adaptive functions leading to long-term disability. MR-based modalities help in longitudinal studies to understand disease progression and response to treatment.
Goal(s): To investigate the in vivo MRI-based methods sensitive to detecting the alterations in metabolites and perfusion in encephalitis patients.
Approach: 1H-MRS and rCBV were performed on encephalitis patients with memory deficits and healthy controls.
Results: Changes in metabolite concentrations in the hippocampus and cortex suggest the long-term effect of neuroinflammation in patients. Reduced hippocampal rCBV in memory deficit patients is consistent with clinical cognitive assessments.
Impact: Altered brain metabolite concentrations and regional blood volume were detected with 1H-MRS and rCBV in autoimmune encephalitis and memory deficit patients. This approach can support the investigation of the role of angiogenesis and neurogenesis in memory loss in chronic encephalitis.
Introduction
Anti-N-methyl-D-aspartate receptor (NMDAR) encephalitis is a common autoimmune encephalitis with complex neuropsychiatric features1. MRI-based in vivo biomarkers, in conjunction with cognitive measures, can greatly support monitoring the disease progression and response to treatment. One of the potential mechanisms of cognitive failure in chronic brain disorders was linked to the disruption of adult hippocampal neurogenesis2. To this end, we studied the brain metabolites using proton magnetic resonance spectroscopy (1H-MRS) and regional cerebral blood volume (rCBV) in anti-NMDAR patients. Results have shown that the brain metabolites changed in the hippocampus and cortex regions, and the hippocampus rCBV values reduced significantly in encephalitis patients compared to control subjects corroborating the cognitive assessments.Methods
Participants: Anti-NMDAR encephalitis patients with cognitive impairment (n=6, patient group) and healthy (n=6, control group) were included in this study with IRB approval. Cognitive assessment: Neuropsychological evaluation was performed on participants. Abnormal performance on a test was based on normative scores being at least 1.5 SD below the mean (z score=≤-1.5). A cognitive domain was a deficit based on at least one or more abnormal scores within a domain. Scanner: MRS/MRI were acquired on a 3T scanner. 1H-MRS: SVS semiLASER3,4(TR/TE=5000/30ms, spectral points=2048, spectral width=6002.4 Hz, averages=128; WS:VAPOR5, B0-shimming:FASTESTMAP6) using FOCI pulses7 of hippocampi volume of interest (VOI) and left prefrontal cortex VOI. 1H-MRS processing: MRS data were preprocessed using standard protocol in MRSpa8. Metabolites were quantified using LCModel9. Concentrations of total N-Acetyl Aspartate (tNAA), total Choline (tCho), total Creatine (tCr), Glutamate/Glutamine (Glx), and myo-inositol (mI) were computed relative to water concentration. rCBV: For higher spatial resolution (as opposed to dynamic contrast enhancement), sagittal pre- and post-contrast 3D T1-weighted images were acquired(TR/TE=21/6 msec, flip angle=25o, slices=80, thickness=2 mm matrix=320x320, FOV=240mmx240mm). Postcontrast images were acquired five minutes after contrast injection without altering the precontrast scanning setup. Only a half of the dose (8ml) of gadolinium contrast was administered. The rCBV map is computed at each pixel as10: rCBV= [Spost (TE) - Spre (TE)] ÷ [Spost_blood (TE) - Spre_blood (TE)], where Spre and Spost represent pre and post-contrast T1 weighted image signals respectively and Spre_blood and Spost_blood are pre- and postcontrast signals from blood only [e.g. sagittal sinus]. To avoid rCBV values from blood vessels and outliers in the region of interest (ROI), only values between 0.01% and 10% were included in the analysis. A student t-test was used to compare results between patient and control groups.Results
Figure 1A & 1B show the neuropsychological measures in both healthy controls and anti-NMDAR patients respectively. Representative 1H-MRS spectra from hippocampus (Fig.2A) and prefrontal cortex (Fig.2B) VOIs along with spectral fitting in a patient, are shown in Figure 2. Figure 3 shows group comparison of metabolite concentrations from the combined (left and right) hippocampi (Fig.3A) and from cortex (Fig.3B). Though there was no statistically significant difference in metabolite concentrations for this small cohort of subjects, a trend of decreased tNAA (p=0.066) and Glx(p=0.095), and increased mI (p=0.191) was observed in hippocampus in patients as compared to controls. Similarly, in the cortex region, there is a trend of higher concentration of mI (p=0.185) in patient group. Representative ROI drawn in hippocampus and the mean %CBV between patients and controls are shown in Figure 4. The mean and SEM values of hippocampus %rCBV in patients and controls were 4.363Discussion
Anti-NMDAR encephalitis patients commonly exhibit profound memory deficits which could result from the effects of neuroinflammation11. In hippocampus, reduced tNAA may suggest neuronal dysfunction whereas increased mI can be attributed to neuroinflammation (Fig 3A). In addition, reduced levels of Glx support previous findings of altered glutamatergic metabolism in anti-NMDAR encephalitis12. In the cortex, the trend for higher mI and no difference in tNAA (Fig.3B) supports the assumption that mI may be a better biomarker than NAA in neuroinflammatory processes with mild cognitive impairments13. Thus, the changes in metabolite concentrations demonstrated in the hippocampus and cortex of patients with encephalitis and memory deficits supports the presence of neuroinflammation in chronic encephalitis. Significantly decreased rCBV values in hippocampus is in accordance with memory deficit in patients (Fig 1B). This is the first study to assess high-resolution low contrast dose rCBV in encephalitis patients; the former reflects the degree of angiogenesis and neurogenesis. To confirm our initial findings on a larger cohort, currently, more participants are being recruited for rCBV and MRS studies.Conclusions
1H-MRS and high-resolution half-dose contrast rCBV MR modalities detected brain metabolite and regional blood volume changes in anti-NMDAR patients. MR-based results corroborated the clinical cognitive assessments.Acknowledgements
O.T. received support from the NIH P20GM130447 Cognitive Neuroscience and Development of Aging (CONDA) Award and DHHS LB606 Nebraska Stem Cell Grant.
The MRS package was developed by Gülin Öz and Dinesh Deelchand described in [10, 12]; and provided by the University of Minnesota under a C2P agreement.
Bioimaging Core, RRID:SCR_022481, Radiology Department, University of Nebraska Medical Center. Omaha, NE. USA.
References
1 - Dalmau J, Lancaster E, Martinez-Hernandez E, Rosenfeld MR, Balice-Gordon R. Clinical experience and laboratory investigations in patients with anti-NMDAR encephalitis. The Lancet Neurology. 2011;10(1):63-74.
2 - Cho KO, Lybrand ZR, Ito N, et al. Aberrant hippocampal neurogenesis contributes to epilepsy and associated cognitive decline. Nature communications. 2015;6(1):6606.
3 - Oz G, Tkáč I. Short-echo, single-shot, full-intensity proton magnetic resonance spectroscopy for neurochemical profiling at 4 T: validation in the cerebellum and brainstem. Magn Reson Med. 2011 Apr;65(4):901-10. doi: 10.1002/mrm.22708. Epub 2010 Nov 30. PMID: 21413056; PMCID: PMC3827699.
4 - Deelchand DK, Berrington A, Noeske R, Joers JM, Arani A, Gillen J, Schär M, Nielsen JF, Peltier S, Seraji-Bozorgzad N, Landheer K, Juchem C, Soher BJ, Noll DC, Kantarci K, Ratai EM, Mareci TH, Barker PB, Öz G. Across-vendor standardization of semi-LASER for single-voxel MRS at 3T. NMR Biomed. 2021 May;34(5):e4218. doi: 10.1002/nbm.4218. Epub 2019 Dec 18. PMID: 31854045; PMCID:PMC7299834.
5 - Tkác I, Starcuk Z, Choi IY, Gruetter R. In vivo 1H NMR spectroscopy of rat brain at 1 ms echo time. Magn Reson Med. 1999 Apr;41(4):649-56. doi:10.1002/(sici)1522-2594(199904)41:4<649::aid-mrm2>3.0.co;2-g. PMID: 10332839.
6 - Gruetter R, Tkác I. Field mapping without reference scan using asymmetric echo-planar techniques. Magn Reson Med. 2000 Feb;43(2):319-23. doi:10.1002/(sici)1522-2594(200002)43:2<319::aid-mrm22>3.0.co;2-1. PMID: 10680699.
7 - Ordidge RJ, Wylezinska M, Hugg JW, Butterworth E, Franconi F. Frequency offset corrected inversion (FOCI) pulses for use in localized spectroscopy. Magn Reson Med. 1996 Oct;36(4):562-6. doi: 10.1002/mrm.1910360410. PMID: 8892208.
8 - MRspa: Magnetic Resonance signal processing and analysis: https://www.cmrr.umn.edu/downloads/mrspa/
9 - Provencher SW. Estimation of metabolite concentrations from localized in vivo proton NMR spectra. Magn Reson Med. 1993 Dec;30(6):672-9. PubMed [citation] PMID:8139448
10 - Kuppusamy K, Lin W, Cizek GR, Haacke EM. In vivo regional cerebral blood volume: quantitative assessment with 3D T1-weighted pre- and postcontrast MR imaging. Radiology. 1996 Oct;201(1):106-12. PubMed [citation] PMID: 8816529
11 - Taraschenko O, Fox HS, Zekeridou A, Pittock SJ, Eldridge E, Farukhuddin F, Al-Saleem F, Devi Kattala C, Dessain SK, Casale G, Willcockson G, Dingledine R. Seizures and memory impairment induced by patient-derived anti-N-methyl-D-aspartate receptor antibodies in mice are attenuated by anakinra, an interleukin-1 receptor antagonist. Epilepsia. 2021 Mar;62(3):671-682. doi:10.1111/epi.16838. Epub 2021 Feb 17. PubMed [citation] PMID: 33596332, PMCID:PMC8536397
12 - Endres D, Perlov E, Stich O, Rauer S, Maier S, Waldkircher Z, Lange T, Mader I,Meyer PT, van Elst LT. Hypoglutamatergic state is associated with reduced cerebral glucose metabolism in anti-NMDA receptor encephalitis: a case report. BMC Psychiatry. 2015 Aug 1;15:186. doi: 10.1186/s12888-015-0552-4. PubMed[citation] PMID:26231521, PMCID: PMC4522073
13 - Ebert T, Heinz DE, Almeida-Corrêa S, Cruz R, Dethloff F, Stark T, Bajaj T, Maurel OM, Ribeiro FM, Calcagnini S, Hafner K, Gassen NC, Turck CW, Boulat B, Czisch M, Wotjak CT. Myo-Inositol Levels in the Dorsal Hippocampus Serve as Glial Prognostic Marker of Mild Cognitive Impairment in Mice. Front Aging Neurosci.2021 Nov 12;13:731603. doi:10.3389/fnagi.2021.731603. eCollection 2021. PubMed[citation] PMID: 34867270, PMCID: PMC8633395
Figures
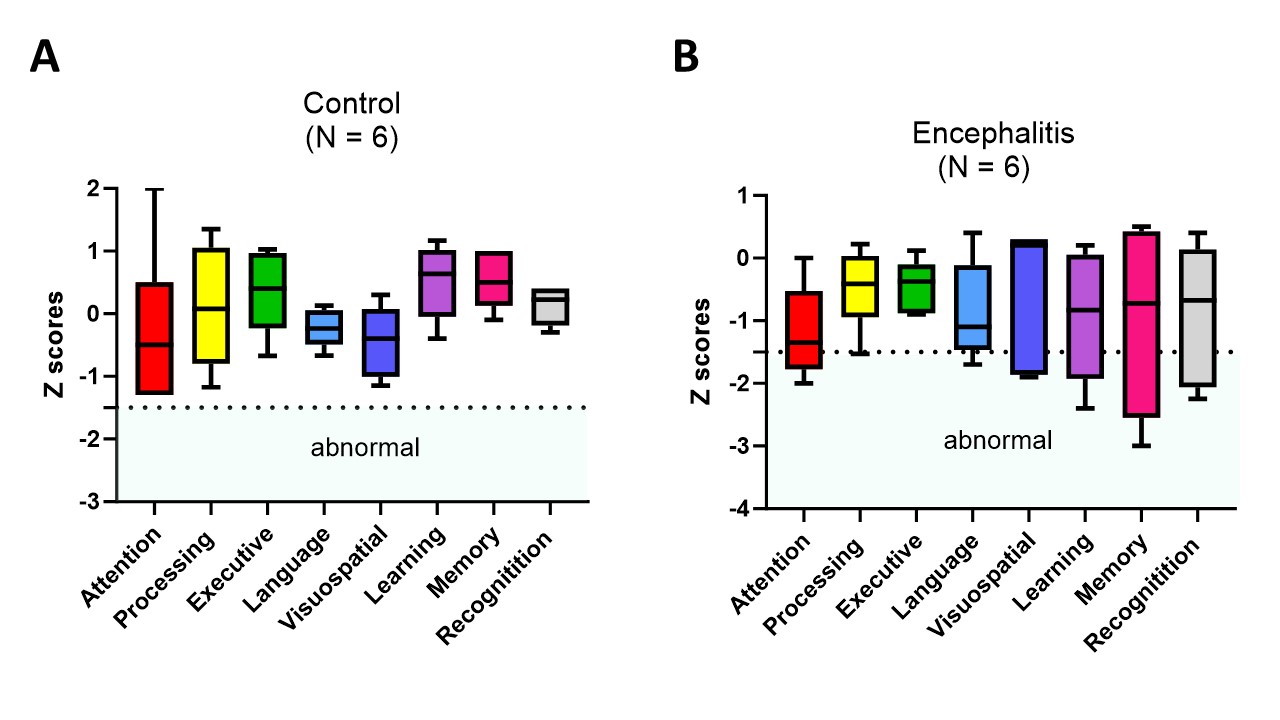
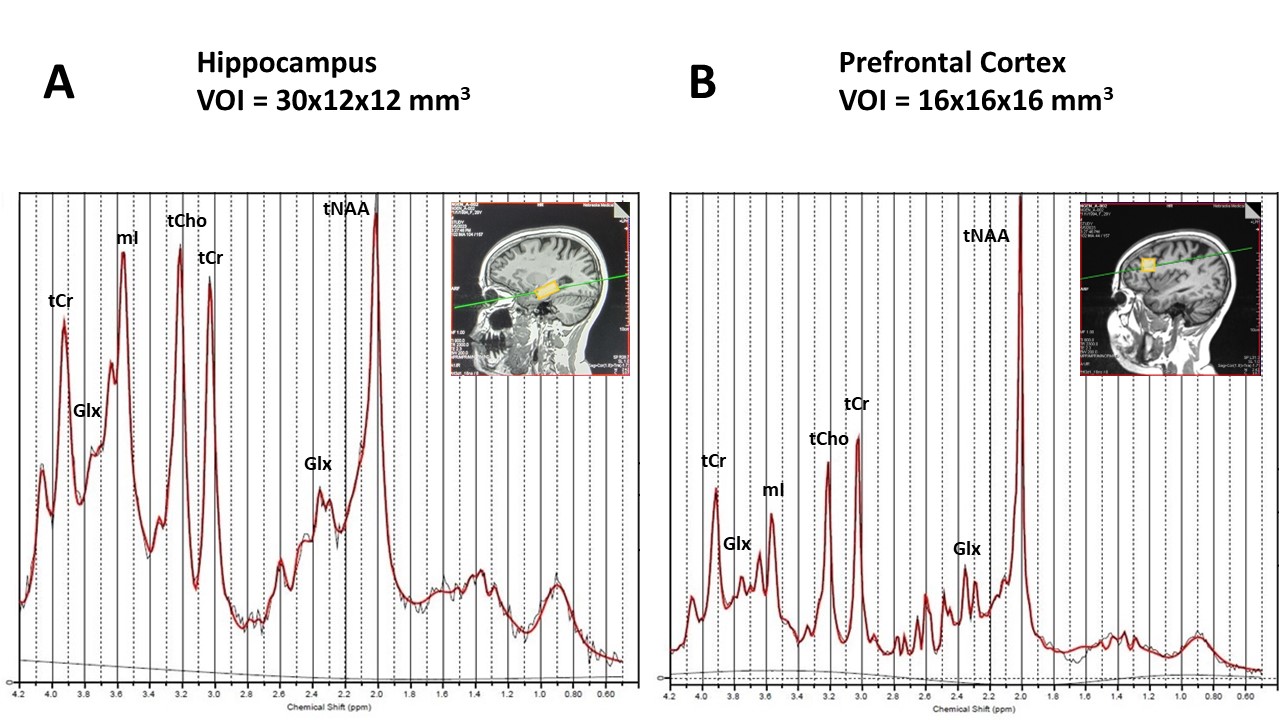
Figure 2 – Representative 1H-MRS fitted spectra results (red line) and placement of volume of interest (VOI) (shaded yellow box) for right Hippocampus (A) and left prefrontal Cortex (B) showed on a sagittal MRI slice from a subject with anti-NMDAR encephalitis. Main peaks for tNAA, tCho, tCr, Glx, and mI are labeled. Spectra obtained from cortex VOIs (SNR= 46.27±7.8, FWHM= 0.025±0.001 ppm) were of better quality than from hippocampus VOIs (SNR= 23.91±3.34, FWHM= 0.063±0.012 ppm). One MRS data set from a control group subject was not included in the analysis due to low spectral quality.
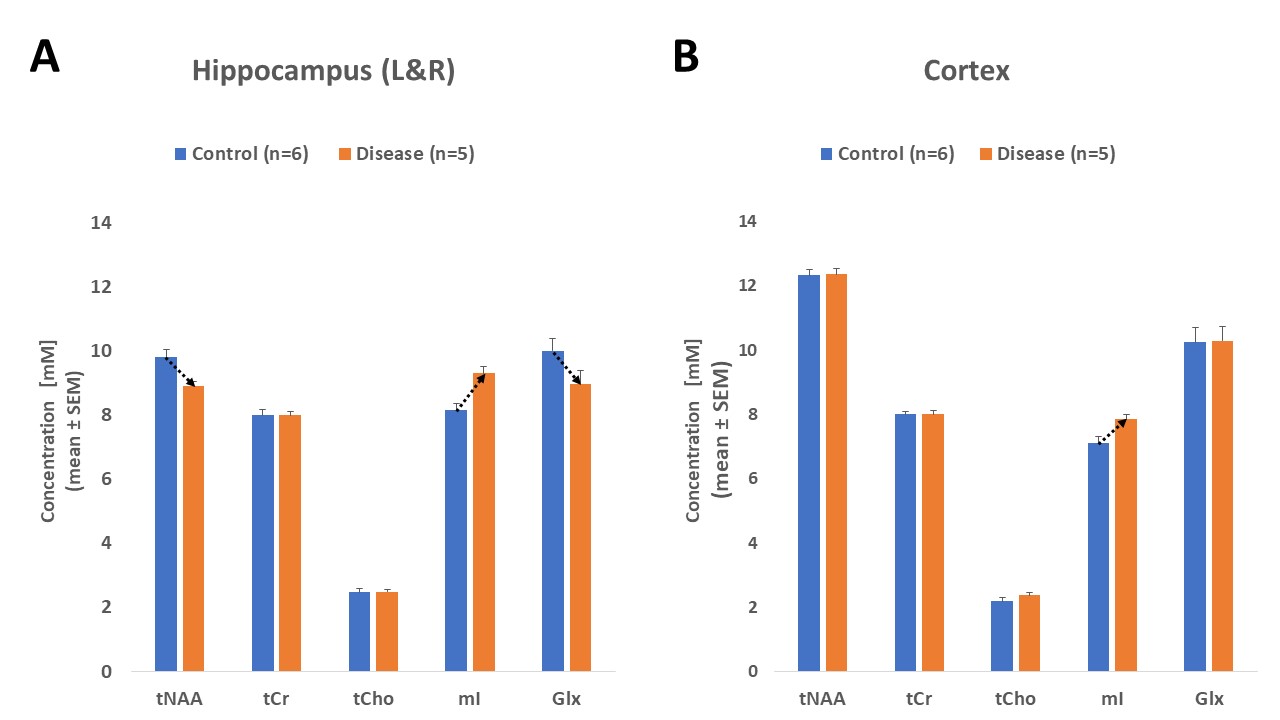
Figure 3 – Metabolite concentrations for control (blue bars) and disease (orange bars) groups from combined left and right hippocampus regions (A) and cortex region (B). There was no significant difference in concentrations of metabolites between the left and right hippocampus VOIs for the disease group (p-values: tNAA = 0.586, tCr = 0.656, tCho = 0.365, mI = 0.601, Glx = 0.970). Metabolite concentrations are reported in mM as the ratio with tCr concentration, and standardized to [tCr] = 8 mM. The dotted arrows denote group difference trends for a particular metabolite.
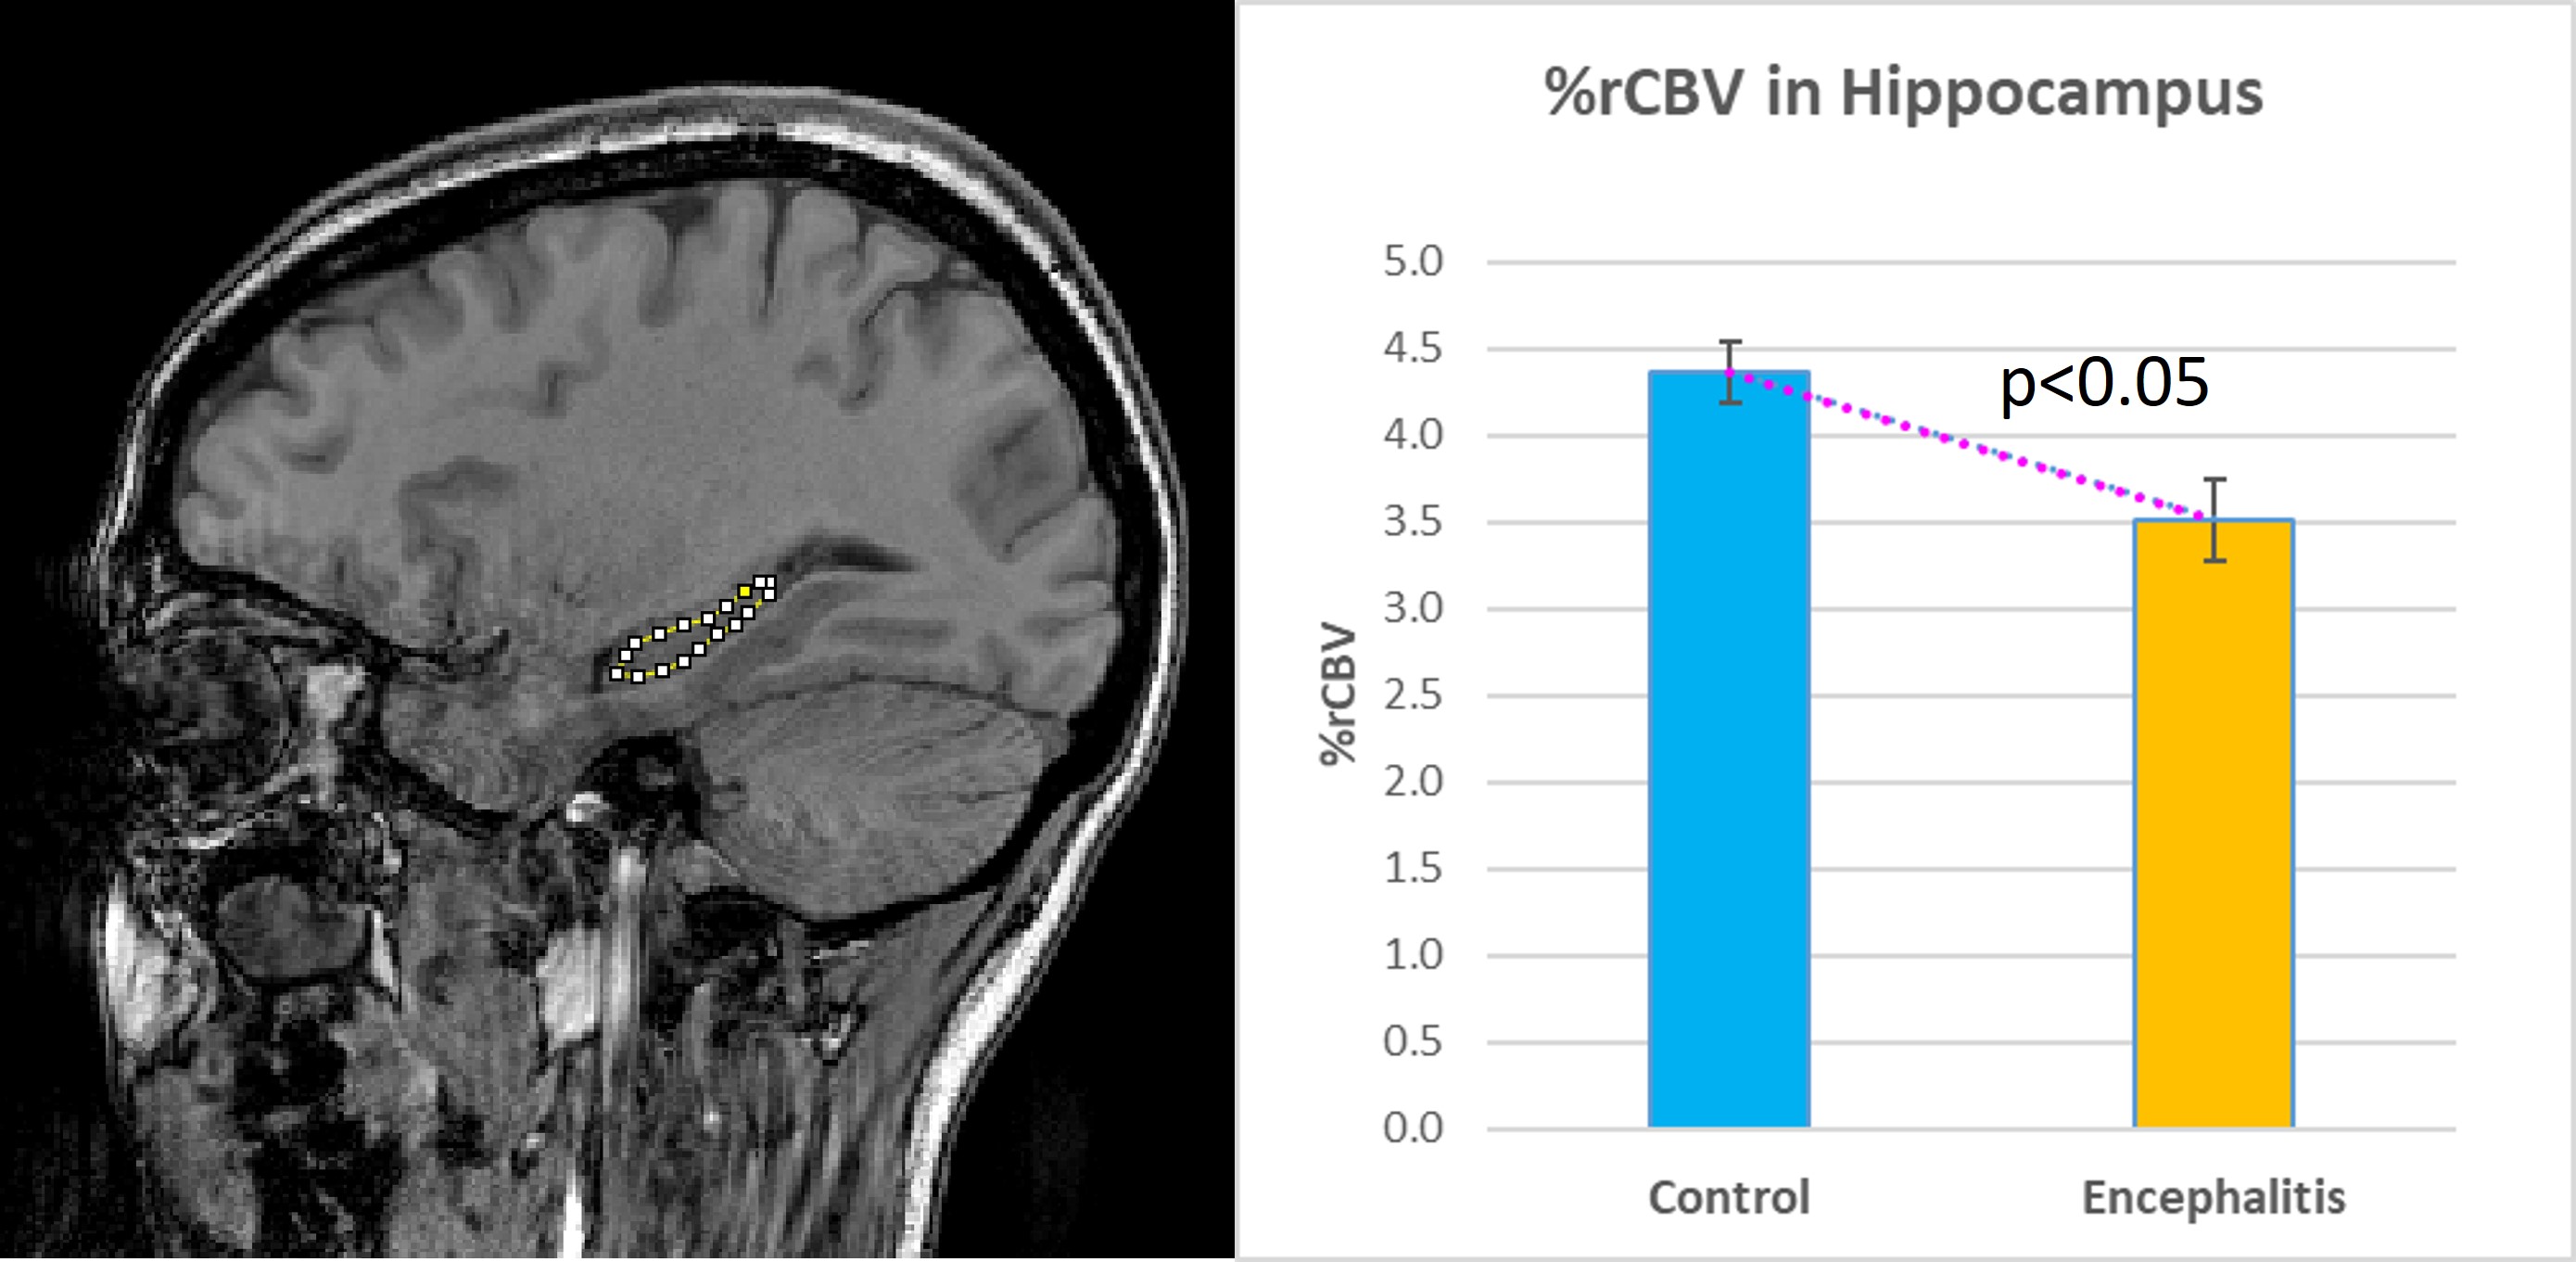
Figure 4 - Left: Representative hippocampus ROI drawn on MRI. Right: Mean %rCBV values in patient and control subject groups. The error bars represent the standard error of mean (SEM). One patient was excluded from rCBV analysis due to motion artifacts on post contrast MRI. Significant decrease in rCBV (p=0.018) is observed in patients group suggesting involvement of hippocampus and corroborated with the cognitive assessments in this group.