0738
Loss of AQP4 impairs solute clearance from the CSF space1Department of Diagnostic Imaging, Graduate School of Medicine, Hokkaido University, Sapporo, Japan, 2Department of Diagnostic and Interventional Radiology, Hokkaido University Hospital, Sapporo, Japan, 3Department of Dental Radiology, Hokkaido University Hospital, Sapporo, Japan, 4Department of Diagnostic Imaging, Faculty of Medicine, Hokkaido University, Sapporo, Japan, 5Department of Pharmacology, Keio University School of Medicine, Tokyo, Japan, 6Global Center for Biomedical Science and Engineering, Faculty of Medicine, Hokkaido University, Sapporo, Japan
Synopsis
Keywords: Neurofluids, Neurofluids, Glymphatic
Motivation: Aquaporin-4 (AQP4) water channels are thought to play an important role in cerebrospinal fluid (CSF) and interstitial fluid (ISF) exchange. However, the effect of AQP4 on CSF drainage and dynamics has not been well-established.
Goal(s): To investigate the effects of AQP4 on CSF drainage and dynamics using in vivo imaging.
Approach: We performed a whole-brain analysis including CSF spaces and drainage pathways of AQP4 knockout rats using dynamic contrast-enhanced (DCE) MRI with intrathecal gadolinium-based contrast agent administration.
Results: DCE-MRI showed that loss of AQP4 impairs solute clearance from the CSF space and reduces CSF-ISF exchange.
Impact: Loss of AQP4 impairs CSF-ISF exchange as well
as solute clearance from the CSF space, suggesting that AQP4 expression might affect
the entire CSF dynamics.
Introduction
Since the glymphatic system hypothesis was proposed by Iliff, novel insights into neurofluid dynamics have been emerging.1,2 This hypothesis posits that aquaporin-4 (AQP4) water channels play an important role in the exchange of cerebrospinal fluid (CSF) and interstitial fluid (ISF), based on several [A1] reports with dynamic contrast-enhanced (DCE) MRI with intrathecal gadolinium-based contrast agent administration as a solute tracer (Gd-tracer).3–6 However, the effect of AQP4 on CSF drainage and dynamics is not well established, especially in in vivo imaging studies.7,8 In this study, a comprehensive whole-brain analysis of AQP4 knockout (KO) rats, including evaluations of CSF spaces and drainage pathways based on the DCE-MRI technique, was performed to investigate whether AQP4 expression affects CSF drainage and dynamics and CSF-ISF exchange.Material and methods
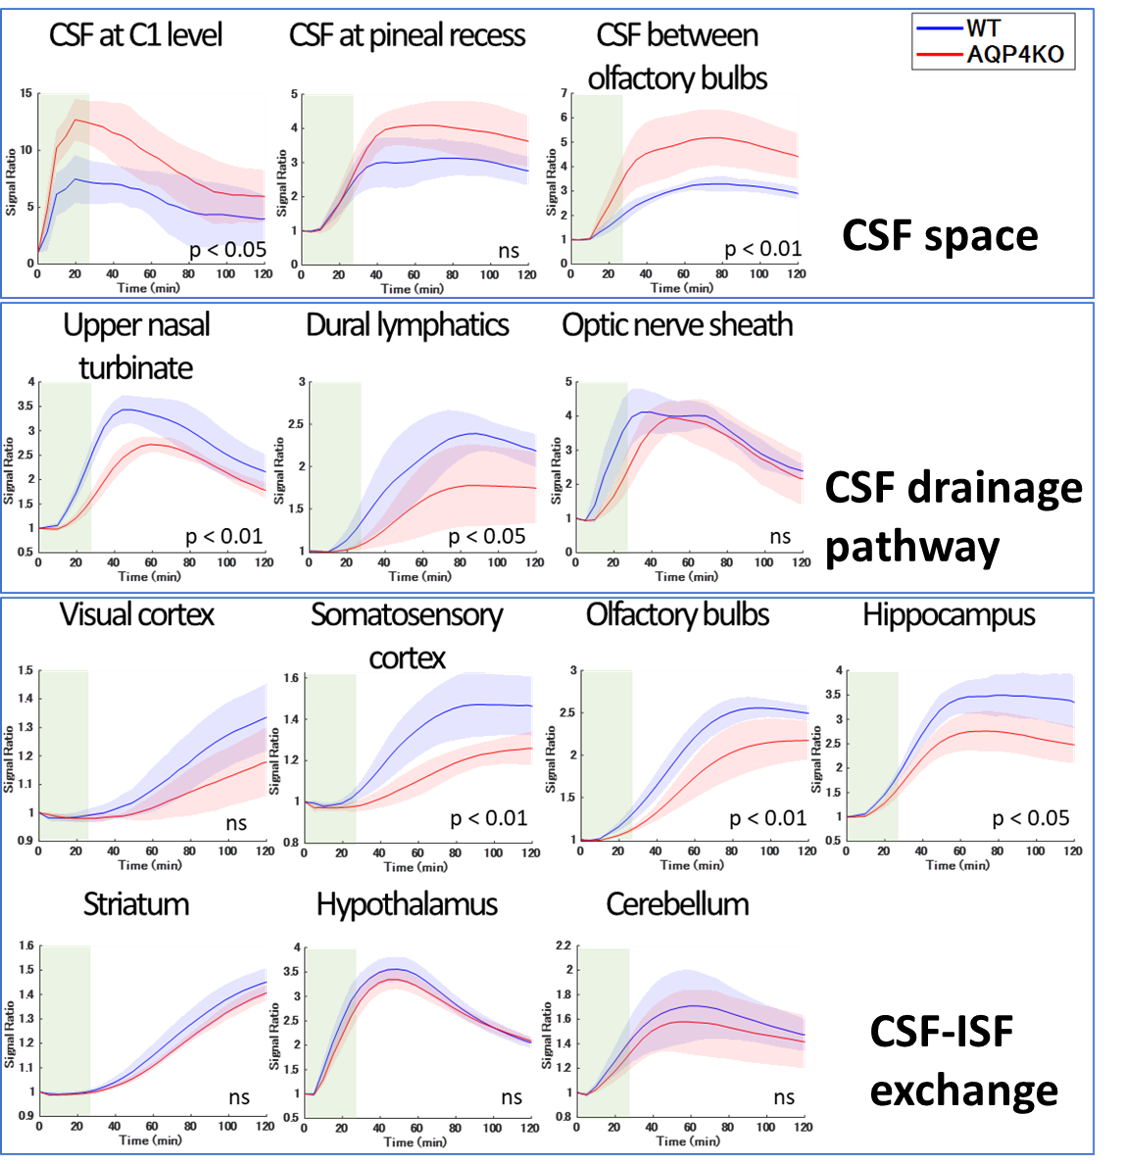
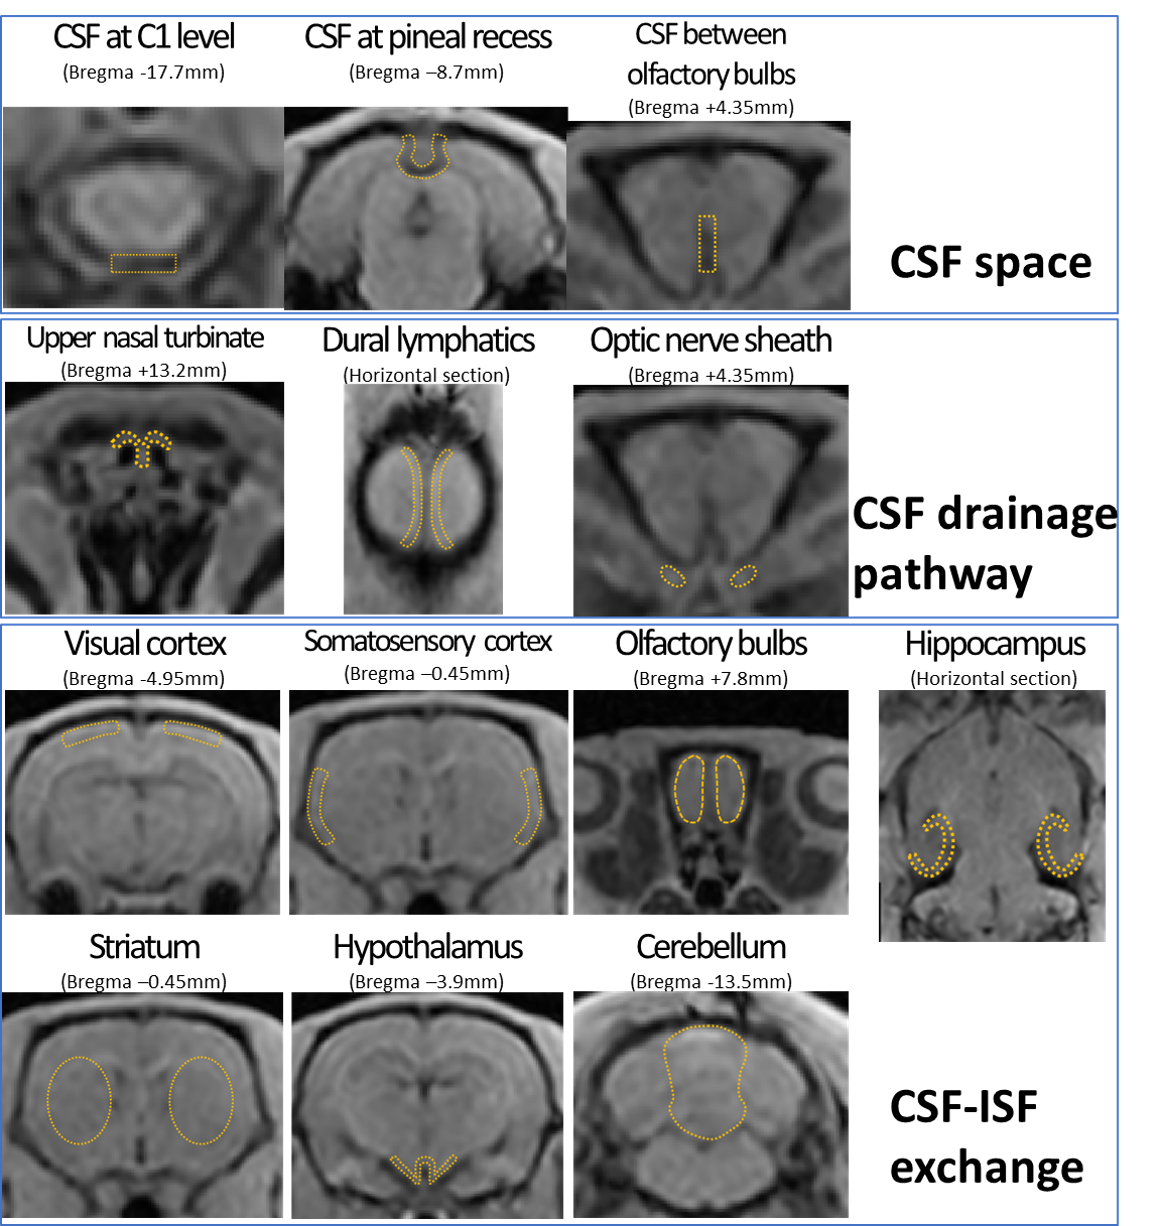
This study was approved by our Institutional Animal Care and Use Committee. Five male AQP4 KO rats and five male wild-type (WT) rats were used. For pretreatment, cisterna magna cannulation was performed under isoflurane anesthesia, and DCE-MRI was conducted using a 3.0T clinical scanner (Magnetom Prisma; Siemens Healthcare, Erlangen, Germany). A 3D T1-weighted volumetric interpolated breath-hold examination sequence was used (TR/TE = 8.72 ms/ 3.29 ms; flip angle = 15°; FOV = 76 × 66.5 × 51.2 mm; acquisition matrix = 192 × 168 × 256; reconstruction resolution = 0.2 × 0.2 × 0.2 mm; scan time per phase = 4 min 54 sec, number of repetitions = 28). After three [A1] pre-contrast phases, 50 mmol/L of Gd-HP-DO3A (ProHance; Eisai, Tokyo, Japan) was intrathecally infused at 1.7 μL/min (totaling 50 μL), and 25 image phases were acquired.ROIs were placed at 13 locations: CSF spaces at the C1 level, pineal recess, and between olfactory bulbs; the upper nasal turbinate, dural lymphatics, and optic nerve sheath for CSF drainage pathways; and the cerebral cortex (visual area, somatosensory area, olfactory bulb, and hippocampus[A2] ), striatum, hypothalamus, and cerebellum for CSF-ISF exchange (Figure. 2). For each ROI, signal intensity changes over time were obtained, and signal ratios to the average of the pre-contrast phases were calculated. The time-intensity curve (TIC) of the WT and KO groups was plotted with the mean ± standard deviation (SD) and the area under the curve (AUC) was determined.
Statistical analyses were performed using two-way analysis of variance (ANOVA) for TIC comparisons and the Mann–Whitney U test for AUC comparisons. Statistical significance was set at p < 0.05.
Results
The KO group exhibited more Gd-tracer retention in the CSF space than the WT group, especially between the olfactory bulbs and at the C1 level, as determined by a two-way ANOVA (p < 0.05). AUC analysis also showed significant differences between olfactory bulbs (WT:317.3 ± 17.3, KO:499.3 ± 108.8, p = 0.008) and at the C1 level (WT:654.5 ± 218.9, KO:1051.5 ± 239.1, p = 0.03).In the assessment of CSF drainage pathways and CSF-ISF exchange, Gd–tracer transition was lower in the KO group than in the WT group. This was especially pronounced in the upper nasal turbinate, dural lymphatics, somatosensory cortex, olfactory bulbs, and hippocampus, according to two-way ANOVA (p < 0.05). AUC analysis showed significant differences in upper nasal turbinate (WT:310.8 ± 34.8, KO:244.7 ± 9.7, p = 0.008), somatosensory cortex (WT:152.3 ± 12.0, KO:131.2 ± 5.0, p = 0.008), olfactory bulbs (WT:238.1 ± 13.2, KO:198.5 ± 21.3, p = 0.03), and hippocampus (WT:338.3 ± 36.1, KO:267.6 ± 34.8, p = 0.03).
Discussion
In the present study, AQP4 KO rats showed significant Gd-tracer accumulation in the CSF space and reduced Gd-tracer transition into the CSF drainage pathway, suggesting that loss of AQP4 impaired solute clearance from the CSF space. However, this is not a comprehensive explanation, because AQP4 expression is not originally abundant in these drainage pathways.9 Speculatively, this phenomenon could result from AQP4 deficiency impairing CSF turnover (production). or from AQP4 deficiency leading to enlarged brain interstitial spaces and restricted circulation in compressed CSF spaces.Similar to previous reports on AQP4 inhibitors and KO mice, the Gd-tracer transition from the CSF space to the brain parenchyma was reduced in AQP4 KO rats, suggesting decreased CSF-ISF exchange due to AQP4 deficiency.3–5 The decrease was more pronounced in the cerebral cortex, particularly in areas with high AQP4 expression near the brain surface. However, in the deep brain parenchyma, the difference was less marked than in previous reports, possibly due to differences in anesthesia, species, or tracer administration.
Conclusion
Loss of AQP4 impairs solute clearance from the CSF space and CSF-ISF exchange.Acknowledgements
No acknowledgement found.References
1. Iliff JJ, Wang M, Liao Y, et al. A paravascular pathway facilitates CSF flow through the brain parenchyma and the clearance of interstitial solutes, including amyloid β. Sci Transl Med 2012; 4:147ra111.
2. Agarwal N, Lewis LD, Hirschler L, et al. Current Understanding of the Anatomy, Physiology, and Magnetic Resonance Imaging of Neurofluids: Update From the 2022 “ISMRM Imaging Neurofluids Study group” Workshop in Rome. J Magn Reson Imaging 2023
3. Gomolka RS, Hablitz LM, Mestre H, et al. Loss of aquaporin-4 results in glymphatic system dysfunction via brain-wide interstitial fluid stagnation. Elife 2023; 12
4. Takano K, Yamada M. Contrast-enhanced magnetic resonance imaging evidence for the role of astrocytic aquaporin-4 water channels in glymphatic influx and interstitial solute transport. Magn Reson Imaging 2020; 71:11–16.
5. Mestre H, Hablitz LM, Xavier AL, et al. Aquaporin-4-dependent glymphatic solute transport in the rodent brain. Elife 2018; 7
6. Alshuhri MS, Gallagher L, Work LM, Holmes WM. Direct imaging of glymphatic transport using H217O MRI. JCI Insight 2021; 6
7. Plá V, Bork P, Harnpramukkul A, et al. A real-time in vivo clearance assay for quantification of glymphatic efflux. Cell Rep 2022; 40:111320.
8. Trillo-Contreras JL, Toledo-Aral JJ, Echevarría M, Villadiego J. AQP1 and AQP4 Contribution to Cerebrospinal Fluid Homeostasis. Cells 2019; 8
9. Hubbard JA, Hsu MS, Seldin MM, Binder DK. Expression of the Astrocyte Water Channel Aquaporin-4 in the Mouse Brain. ASN Neuro 2015; 7
Figures
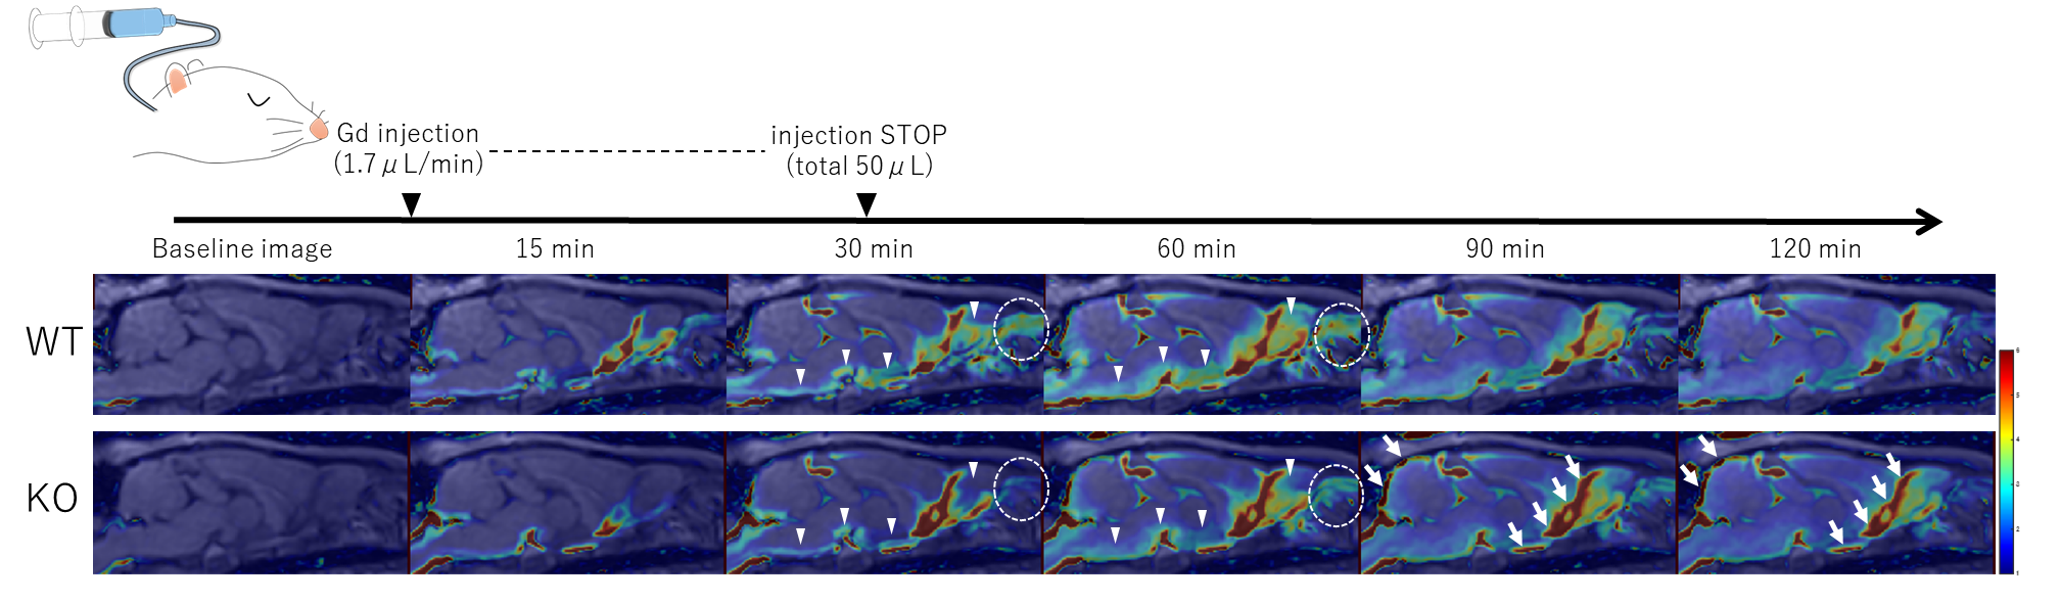
Schematic and representative images of Gd-tracer changes.
Distribution of the Gd-tracer in WT and KO rats over time is shown in post-contrast images converted to color maps. In the KO group, signal ratios in the olfactory bulb and brain surface parenchyma are lower than those in the WT group 30–90 min post-injection (arrowheads). Gd-tracer transition into the nasal cavity was restricted to 30–60 min (circles); residuals were seen in the CSF space at 90–120 min in the KO group (arrows).
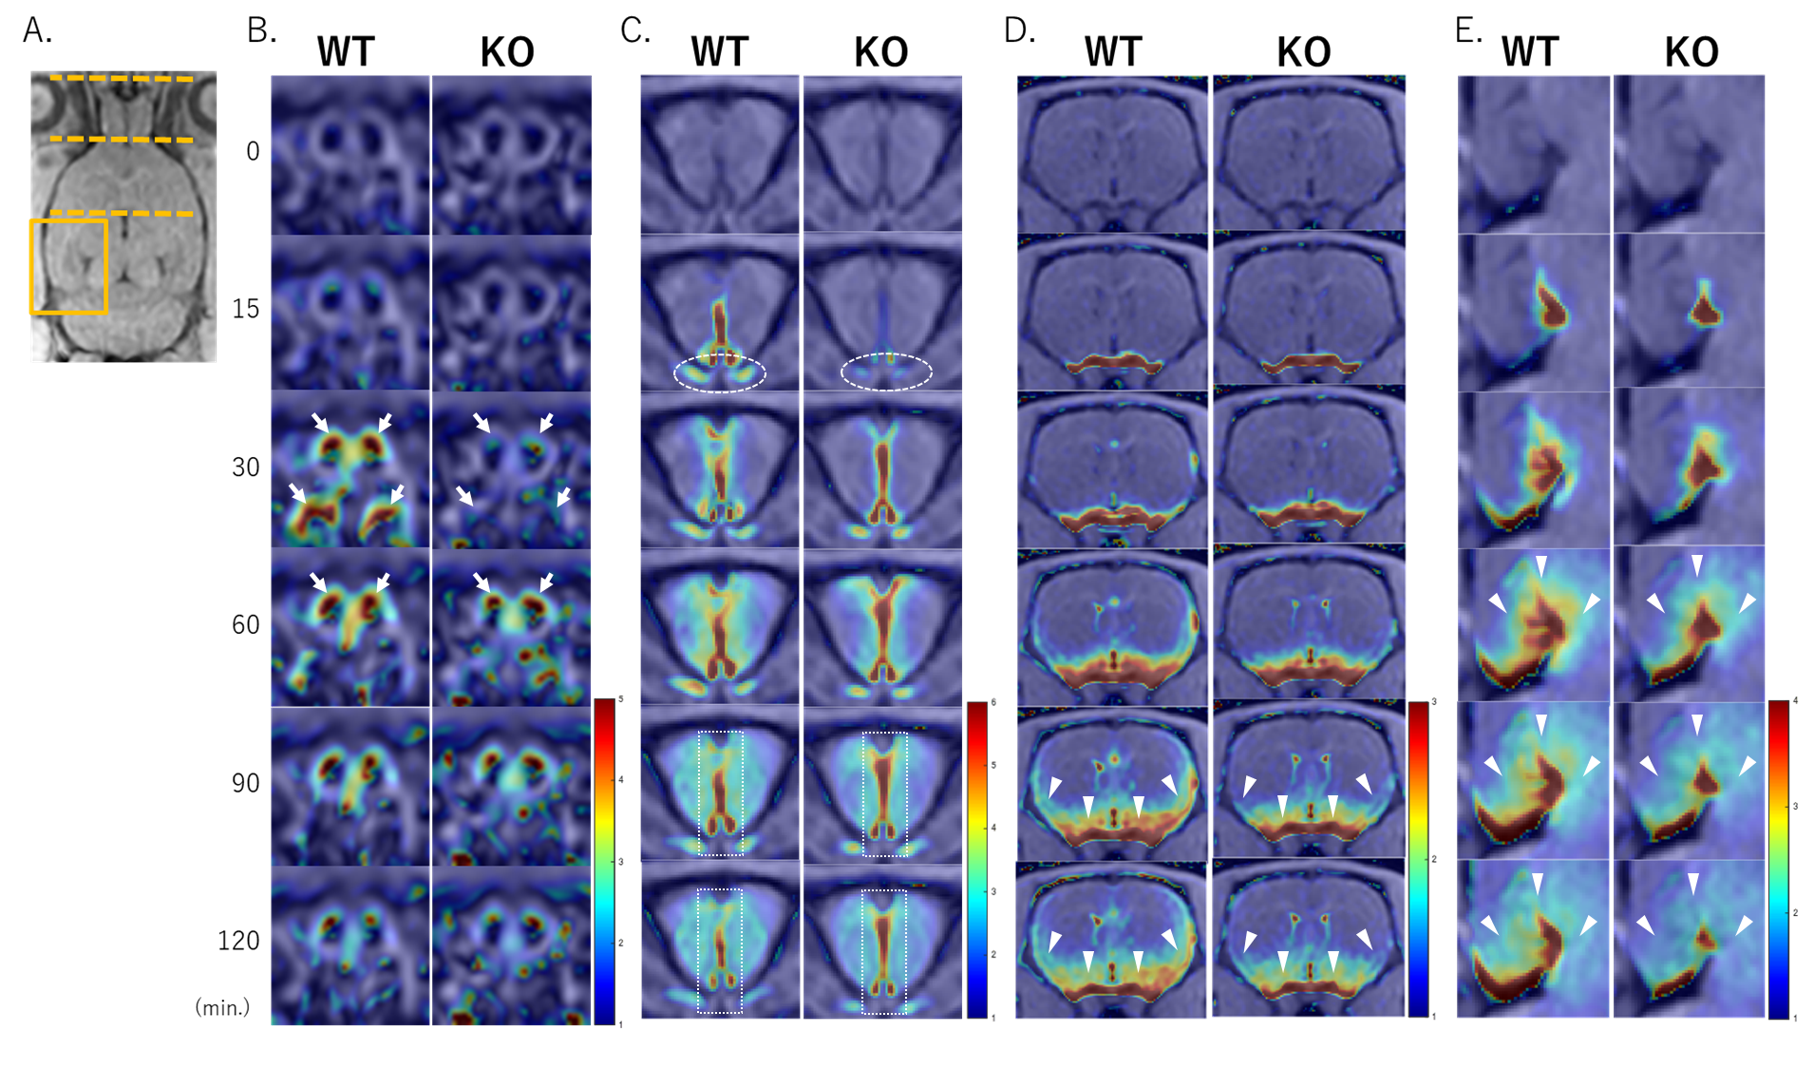
Gd-tracer transitions in sections of the nasal cavity (B), forebrain (C), striatum (D), and expanded hippocampus (E) of rats.
In the KO group, delayed transitions into the upper nasal turbinate and nasal epithelium (arrows) and along the optic nerve sheath (circles) were observed, and accumulation occurred in the rostral CSF space (rectangles). KO mice showed lower signal ratios in the olfactory bulb, ventral and lateral cerebral cortices, and hippocampus than WT mice (arrowheads).