0734
Dextran CEST MRI Agents for Quantitative Assessment of BBB Leakage in the Macromolecular Size Range.1Department of Biomedical Engineering, Johns Hopkins University, Baltimore, MD, United States, 2Russell H. Morgan Department of Radiology and Radiological Science, Johns Hopkins University School of Medicine, Baltimore, MD, United States, 3F.M. Kirby Research Center for Functional Brain Imaging, Kennedy Krieger Institute, Baltimore, MD, United States
Synopsis
Keywords: CEST / APT / NOE, CEST & MT, Multiple Sclerosis; CEST enhancement; Dex-Cest
Motivation: Dextrans (Dex) -based CEST MRI allows evaluating vascular permeability in the macromolecular size range. However, its signal intensity, similar to most CEST agents, is pH-dependent, which complicates in vivo quantification.
Goal(s): To develop a dextran CEST agent that is less pH sensitive for this application.
Approach: Chemically modified Dex (CM-Dex) has negatively charged carboxylate groups that can retard the exchange rate of OH protons to decrease pH effects.
Results: CM-Dex has a relatively consistent CEST signal across a pH range of 6 to 7.4 and is feasible for detecting blood-brain barrier (BBB) leakage in a mouse model of multiple sclerosis (MS).
Impact: The development of a second-generation dextran-based CEST agent with a more extended pH range of stable MRI signal to facilitate quantitative measurements of vascular permeability in vivo for applications wherein intra- and inter-individual pH can vary.
Purpose:
Contrast-enhanced CEST MRI has gained a broad interest for its unbeatable advantage of leveraging highly biocompatible compounds and even clinically ready agents for probing pathological alternations associated with various diseases. Due to the nature of water exchange, the majority of CEST agents exhibit highly pH-dependent signal intensities. While this feature has been utilized for pH mapping, it makes accurately quantifying the tissue uptake of CEST agents technically challenging, given that pH homeostasis is often disrupted during disease progression. Prior research highlights the strong influence of the chemical environment on proton exchange rates(1,2). Consequently, we embarked on the development of second-generation dextran CEST agents, designed to exhibit reduced pH sensitivity within the pH range of 6 to 7.4, given dextran's polymer composition comprising glucose units, offering significant CEST signal enhancement(3,4). This work entailed a preliminary exploration of chemical modifications to enhance the CEST signal of dextran. Subsequently, our study showcases the practical application of the selected carboxymethyl dextran in evaluating blood-brain barrier (BBB) integrity in the context of multiple sclerosis (MS) by utilizing an experimental autoimmune encephalomyelitis (EAE) mouse model.Methods:
In vitro experiments: Dextran (Dex, Fig. 1A, MW= 10 kD, Sigma, # D9260) and carboxymethyl-dextran (CM-Dex, Fig. 1B, MW= 10 kD, Sigma, #86524) was prepared in PBS buffer at various pH (20 mM per glucose unit) and studied with CEST MRI using a vertical bore Bruker 11.7 T MRI scanner. CEST MR images were acquired using RARE sequence with a continuous wave pre-saturation pulse (B1=1.2-5.9 µT, 4 sec) swept from -5 to +5 ppm (step=0.2 ppm) for the full Z-spectrum; TR/TE=6.0s/5 ms, RARE factor=32. The QUESP method (5) was used to estimate the exchange rate of hydroxyl protons at 1.2 ppm as described previously(6).EAE MS mouse model: C57Bl/6 mice (F/6-10w) were injected s.c. with myelin peptide (MOG35-55, 200 μL, 0.5 mg/mL) emulsified in incomplete Freund's adjuvant supplemented with M. tuberculosis H37Ra (5 mg/mL) and i.p. with 300 ng of pertussis toxin on days 0 and 2. Mice were observed daily for signs of paralysis using a 0-5 rating system. MRI: all in vivo MRI was acquired using a Biospec 11.7 T horizontal MRI scanner (Bruker, Ettlingen, Germany). According to our previously reported protocol(7), CEST MRI was performed before and after the i.v. injection of 200 µL CM-Dex in saline solution (750 mg/kg b.w.), using parameters: B1= 1.8 µT, Tsat= 3 s, Δω = -3 to +3 ppm with a step size of 0.2 ppm. MTRasym=(S-Δω – S+Δω)/S0 was computed after the B0 correction using the WASSR method. ΔMTRasym (1 ppm) at each time point was calculated by MTRasym (t)- MTRasym (pre).
Results and Discussion:
1. Chemically modified dextran exhibits distinctive CEST contrast due to the modulated OH exchange rate. We first compared the CEST signals of native Dex, CM-Dex (negatively charged side chain), as well as spermine-conjugated Dex (positively charged side chain). Spermine-conjugated Dex shows a completely suppressed CEST signal, while CM-Dex exhibits an enhanced CEST signal, indicating that a negatively charged side chain favors CEST detection. Then we fit the Z-spectra acquired using various B1 values to estimate the exchange rate of OH protons, which shows the exchange rate of OH protons is significantly reduced in the pH range of 7 to 7.4. For example, the exchange rate of CM-Dex-OH is estimated to be 2.3 kHz, much slower than that of Dex-OH (4.6 kHz, Fig. 1C). As a result, the CEST signal intensity of CM-Dex is relatively consistent in the pH range of 6 to 7.4 (Fig. 1D-F).2. CM-Dex-enhanced CEST MRI in EAE mice: As shown in Fig. 2, EAE mice with high clinical disability scores have BBB impairment as confirmed by Gd-enhanced MRI (Fig. 2B). CM-Dex-enhanced MRI results (Fig. 2C) showed substantial contrast enhancement in the corresponding brain regions. The CEST contrast enhancement is found to be quite heterogeneous in the same mouse as well as among different mice (n=3). Interestingly, while the size of CM-Dex (10 kDa) is larger than the size of Gd-DOTA (559 Da), the area of CM-Dex-CEST-enhanced regions is larger than that of with Gd-enhancement, suggesting that in addition to molecular weight (size), other properties of the contrast agent such as shape and surface properties may also affect the tissue uptake when BBB is compromised.
Conclusion
We have successfully developed CM-Dex as a second-generation CEST agent that exhibits favorable pH-insensitivity in the pH range of 6.0 to 7.4. As an initial application, we utilized CM-Dex to evaluate BBB integrity in the brains of EAE mice. We anticipate that CM-Dex will facilitate more precise in vivo CEST quantification.Acknowledgements
No acknowledgement found.References
1. Liepinsh E, Otting G. Proton exchange rates from amino acid side chains--implications for image contrast. Magn Reson Med 1996;35(1):30-42.
2. Bar-Shir A, Liu G, Liang Y, Yadav NN, McMahon MT, Walczak P, Nimmagadda S, Pomper MG, Tallman KA, Greenberg MM, van Zijl PC, Bulte JW, Gilad AA. Transforming thymidine into a magnetic resonance imaging probe for monitoring gene expression. J Am Chem Soc 2013;135(4):1617-1624.
3. Li Y, Qiao Y, Chen H, Bai R, Staedtke V, Han Z, Xu J, Chan KWY, Yadav N, Bulte JWM, Zhou S, van Zijl PCM, Liu G. Characterization of tumor vascular permeability using natural dextrans and CEST MRI. Magn Reson Med 2018;79(2):1001-1009.
4. Liu G, Ray Banerjee S, Yang X, Yadav N, Lisok A, Jablonska A, Xu J, Li Y, Pomper MG, van Zijl P. A dextran-based probe for the targeted magnetic resonance imaging of tumours expressing prostate-specific membrane antigen. Nat Biomed Eng 2017;1(12):977-982.
5. McMahon MT, Gilad AA, Zhou J, Sun PZ, Bulte JW, van Zijl PC. Quantifying exchange rates in chemical exchange saturation transfer agents using the saturation time and saturation power dependencies of the magnetization transfer effect on the magnetic resonance imaging signal (QUEST and QUESP): Ph calibration for poly-L-lysine and a starburst dendrimer. Magn Reson Med 2006;55(4):836-847.
6. Sehgal AA, Li Y, Lal B, Yadav NN, Xu X, Xu J, Laterra J, van Zijl PCM. CEST MRI of 3-O-methyl-D-glucose uptake and accumulation in brain tumors. Magn Reson Med 2019;81(3):1993-2000.
7. Han Z, Chen C, Xu X, Bai R, Staedtke V, Huang J, Chan KWY, Xu J, Kamson DO, Wen Z, Knutsson L, van Zijl PCM, Liu G. Dynamic contrast-enhanced CEST MRI using a low molecular weight dextran. NMR Biomed 2022;35(3):e4649.
Figures
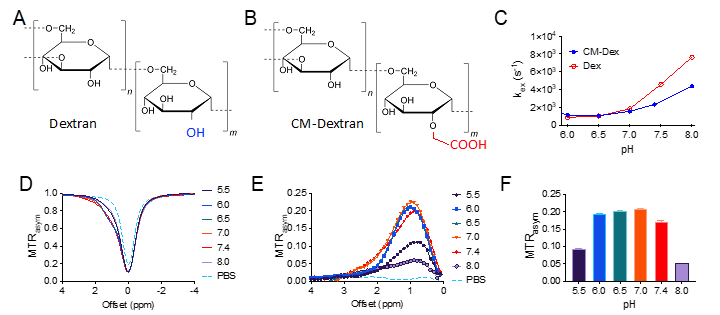
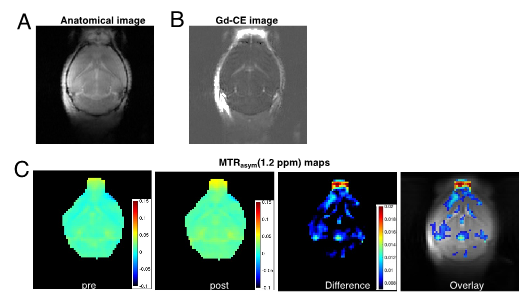
Figure 2. Dex-enhanced CEST MRI results of a representative mouse (score 1.5) at 20 min post-injection of CM-Dex. (A)Anatomic T2w image, (B) Gd-contrast enhanced (CE) image. (C) from left to right: pre-contrast CEST image, and post-contrast CEST image, CEST-contrast enhancement map, and an overlay image.