0729
A new kinetic model for characterization of glucose delivery, transport and metabolism for MRS and dynamic glucose enhanced (DGE) MRI of the brain1Department of Medical Radiation Physics, Lund University, Lund, Sweden, 2Diagnostic Radiology, Department of Clinical Sciences, Lund University, Lund, Sweden, 3F.M. Kirby Research Center for Functional Brain Imaging, Kennedy Krieger Institute, Baltimore, MD, United States, 4Department of Neurology, Johns Hopkins University School of Medicine, Baltimore, MD, United States, 5Russell H. Morgan Department of Radiology and Radiological Science, Johns Hopkins University School of Medicine, Baltimore, MD, United States, 6Lund University Bioimaging Center, Lund University, Lund, Sweden, 7Department of Medical Imaging and Physiology, Skåne University Hospital, Lund and Malmö, Sweden
Synopsis
Keywords: CEST / APT / NOE, CEST & MT, data analysis, kinetic modelling, metabolism, brain, cancer
Motivation: While PET, MR spectroscopy, and DGE CEST MRI can describe sugar uptake and utilization using a 2-tissue-compartment model, such a model is not appropriate for DGE CEST MRI of tumors, as the exchange properties of sugar hydroxyl protons may differ between tissue compartments.
Goal(s): To develop a 3-tissue-compartment model (blood, EES and cell) suitable for DGE MRI.
Approach: We modified the mass balance equations and simulated compartmental D-glucose concentrations from D-glucose levels of venous plasma.
Results: The 3-tissue-compartment model was able to reproduce MRS literature brain D-glucose dynamic uptake curves, as well as experimental DGE MRI signal in brain tumors at 7 T.
Impact: A 3-tissue-compartment model is necessary for correct quantification of DGE MRI in malignant brain tumors. Our proposed model is expected to improve modeling and assessment for all metabolic substrate uptake imaging methods in situations of BBB breakdown.
Introduction
The cerebral uptake of D-glucose, which includes information on delivery, transport and metabolism, has been studied using several imaging technologies, including PET, MRS, and, more recently, dynamic glucose enhanced (DGE) chemical exchange saturation transfer (CEST) MRI1. The most commonly used kinetic model in vivo is a 2-tissue-compartment model, consisting of a blood compartment for delivery and a mixed extravascular-extracellular/intracellular compartment for metabolism, separated by the blood-brain barrier (BBB)2,3. However, this model may not be applicable to tumor tissue, or even normal brain, especially in DGE MRI. The reasons are: (i) D-glucose concentration gradients exist between blood plasma, the extravascular extracellular space (EES), and the intracellular space (ICS) in healthy tissue. (ii) In cases of BBB breakdown, the D-glucose concentration in the EES equilibrates with that in the blood compartment but not with the ICS. (iii) Malignant tumors show reduced pH in the EES, leading to a reduced exchange rate of hydroxyl protons in D-glucose and an increased CEST signal from this compartment. To address these issues, a 3-tissue-compartment model was developed, including the EES and the ICS as separate compartments.Methods
Fig. 1 shows the mass-balance differential equations for the 3-tissue-compartment model, including rate constants governed by reversible Michaelis-Menten (MM) kinetics. These constants define transport across the BBB and cell membrane (CMB), intracellular phosphorylation by hexokinase (HK), and a final rapid step for glycolysis to pyruvate.To estimate the Michaelis-Menten constants for transport and phosphorylation, we assumed that, in healthy brain, the MM constants for CMB transport are comparable to those for BBB transport, i.e. $$$ T_{max}^{BBB}=T_{max}^{CMB}=T_{max}$$$ and $$$K_T^{BBB}=K_T^{CMB}=K_T$$$. We also assumed $$$K_M^{HK}=0.05$$$ mM, which is a well-determined value4-6. After calculating realistic starting ranges for the MM constants based on physiological considerations, plasma D-glucose levels and dynamic D-glucose uptake curves for human brain acquired using MRS by Shestov et al.7, were used to obtain refined estimates: For each possible combination of MM constants, within their predefined ranges, rate constants and compartmental concentrations were calculated numerically using small-step increments and custom-written Matlab scripts. Simulated and experimental brain D-glucose curves were then compared, and the $$$T_{max},K_T$$$, and $$$V_{max}^{HK}$$$ estimates resulting in the best fit (based on the root mean squared error (RMSE)) were used to simulate final rate constants and D-glucose concentration curves in human grey matter (GM). White matter (WM) and brain tumor EES and ICS concentrations were simulated using literature-based compartmental fractions and MM constants. The model was further validated by comparison of simulated and experimental brain D-glucose concentrations at steady-state concentration levels (data from three MRS studies7-9). Using Bloch-McConnell equations with parameters described previously10, with the addition of T1 and T2 for tumor EES (2.5, 0.2 s) and tumor ICS (2.0, 0.11 s), we generated corresponding Z-spectra. DGE signal curves were calculated as $$$ΔS=(S_{base}-S(t))/S_{base}$$$, where $$$S(t)$$$ is the intensity at 1.2 ppm and $$$S_{base}$$$ the average signal before D-glucose administration. The saturation parameters were selected in accordance with a prior study at 7 T11. Based on experimental plasma D-glucose levels, we then simulated DGE signals for three patients with glioblastoma and compared with actual 7 T DGE data11.
Results
Based on physiological considerations, the ranges of MM constants used for fitting were: $$$0.38<T_{max}<1.1$$$ µmol/g/min, $$$3.1<K_T<8.8$$$ mM and $$$0.13<V_{max}^{HK}<0.42$$$ µmol/g/min. The final MM constants are shown in Fig. 2, together with the average dynamic curve of Shestov et al.7 used to determine them (2A), and the validation comparing experimental and simulated steady-state D-glucose brain and plasma concentrations (2B). Fig. 3 shows simulated rate constants and D-glucose concentration curves for different compartments, and Fig. 4 shows simulated concentrations and DGE signals. Simulated DGE MRI curves are compared with experimental data from three glioblastoma patients in Fig. 5.Discussion
The model was able to reasonably reproduce DGE MRI data for brain tumors and gray matter from human studies at 7 T. Small discrepancies between simulated and experimental DGE curves may be potentially attributable to partial volume effects with other tissue compartments in the experimental data, assumptions regarding the parameters, or the lack of a CSF compartment in the current model. Future work will involve inclusion of a CSF compartment, accounting for D-glucose transport from plasma to CSF, and between CSF and brain tissue.Conclusion
The 3-tissue-compartment model was able to reproduce literature brain D-glucose MRS concentration curves, as well as predict DGE MRI signal changes of the correct order of magnitude for D-glucose uptake in glioblastoma patients scanned at 7 T. The modeling confirmed that for DGE MRI, in which signal changes are pH-dependent, the EES is the dominant signal contributor in tumors with BBB breakdown.Acknowledgements
We are grateful to Dr. Gülin Öz for kindly providing the dynamic glucose concentration data from her MRS studies.References
1. Knutsson L, Xu X, van Zijl PCM, Chan KWY. Imaging of sugar-based contrast agents using their hydroxyl proton exchange properties. NMR Biomed. 2023;36(6):e4784. doi: 10.1002/nbm.47842. Gjedde A. Calculation of cerebral glucose phosphorylation from brain uptake of glucose analogs in vivo: a re-examination. Brain Res. 1982;257(2):237-274. doi: 10.1016/0165-0173(82)90018-2
3. Dickie BR, Jin T, Wang P, et al. Quantitative kinetic modelling and mapping of cerebral glucose transport and metabolism using glucoCESL MRI. J Cereb Blood Flow Metab. 2022;42(11):2066-2079. doi: 10.1177/0271678X221108841
4. Wilson JE. Isozymes of mammalian hexokinase: structure, subcellular localization and metabolic function. J Exp Biol. 2003;206(Pt 12):2049-2057. doi: 10.1242/jeb.00241
5. Kapoor R, Spence AM, Muzi M, Graham MM, Abbott GL, Krohn KA. Determination of the deoxyglucose and glucose phosphorylation ratio and the lumped constant in rat brain and a transplantable rat glioma. J Neurochem. 1989;53(1):37-44. doi: 10.1111/j.1471-4159.1989.tb07292.x
6. Lund-Andersen H. Transport of glucose from blood to brain. Physiol Rev. 1979;59(2):305-352. doi: 10.1152/physrev.1979.59.2.305
7. Shestov AA, Emir UE, Kumar A, Henry PG, Seaquist ER, Oz G. Simultaneous measurement of glucose transport and utilization in the human brain. Am J Physiol Endocrinol Metab. 2011;301(5):E1040-1049. doi: 10.1152/ajpendo.00110.2011
8. Gruetter R, Ugurbil K, Seaquist ER. Steady-state cerebral glucose concentrations and transport in the human brain. J Neurochem. 1998;70(1):397-408. doi: 10.1046/j.1471-4159.1998.70010397.x
9. de Graaf RA, Pan JW, Telang F, et al. Differentiation of glucose transport in human brain gray and white matter. J Cereb Blood Flow Metab. 2001;21(5):483-492. doi: 10.1097/00004647-200105000-00002
10. Xu X, Sehgal AA, Yadav NN, et al. D-glucose weighted chemical exchange saturation transfer (glucoCEST)-based dynamic glucose enhanced (DGE) MRI at 3T: early experience in healthy volunteers and brain tumor patients. Magn Reson Med. 2020;84(1):247-262. doi: 10.1002/mrm.28124
11. Seidemo A, Wirestam R, Helms G, et al. Tissue response curve shape analysis of dynamic glucose enhanced (DGE) and dynamic contrast enhanced (DCE) MRI in patients with brain tumor. NMR Biomed. 2023;36(6):e4863. doi:10.1002/nbm.4863
Figures
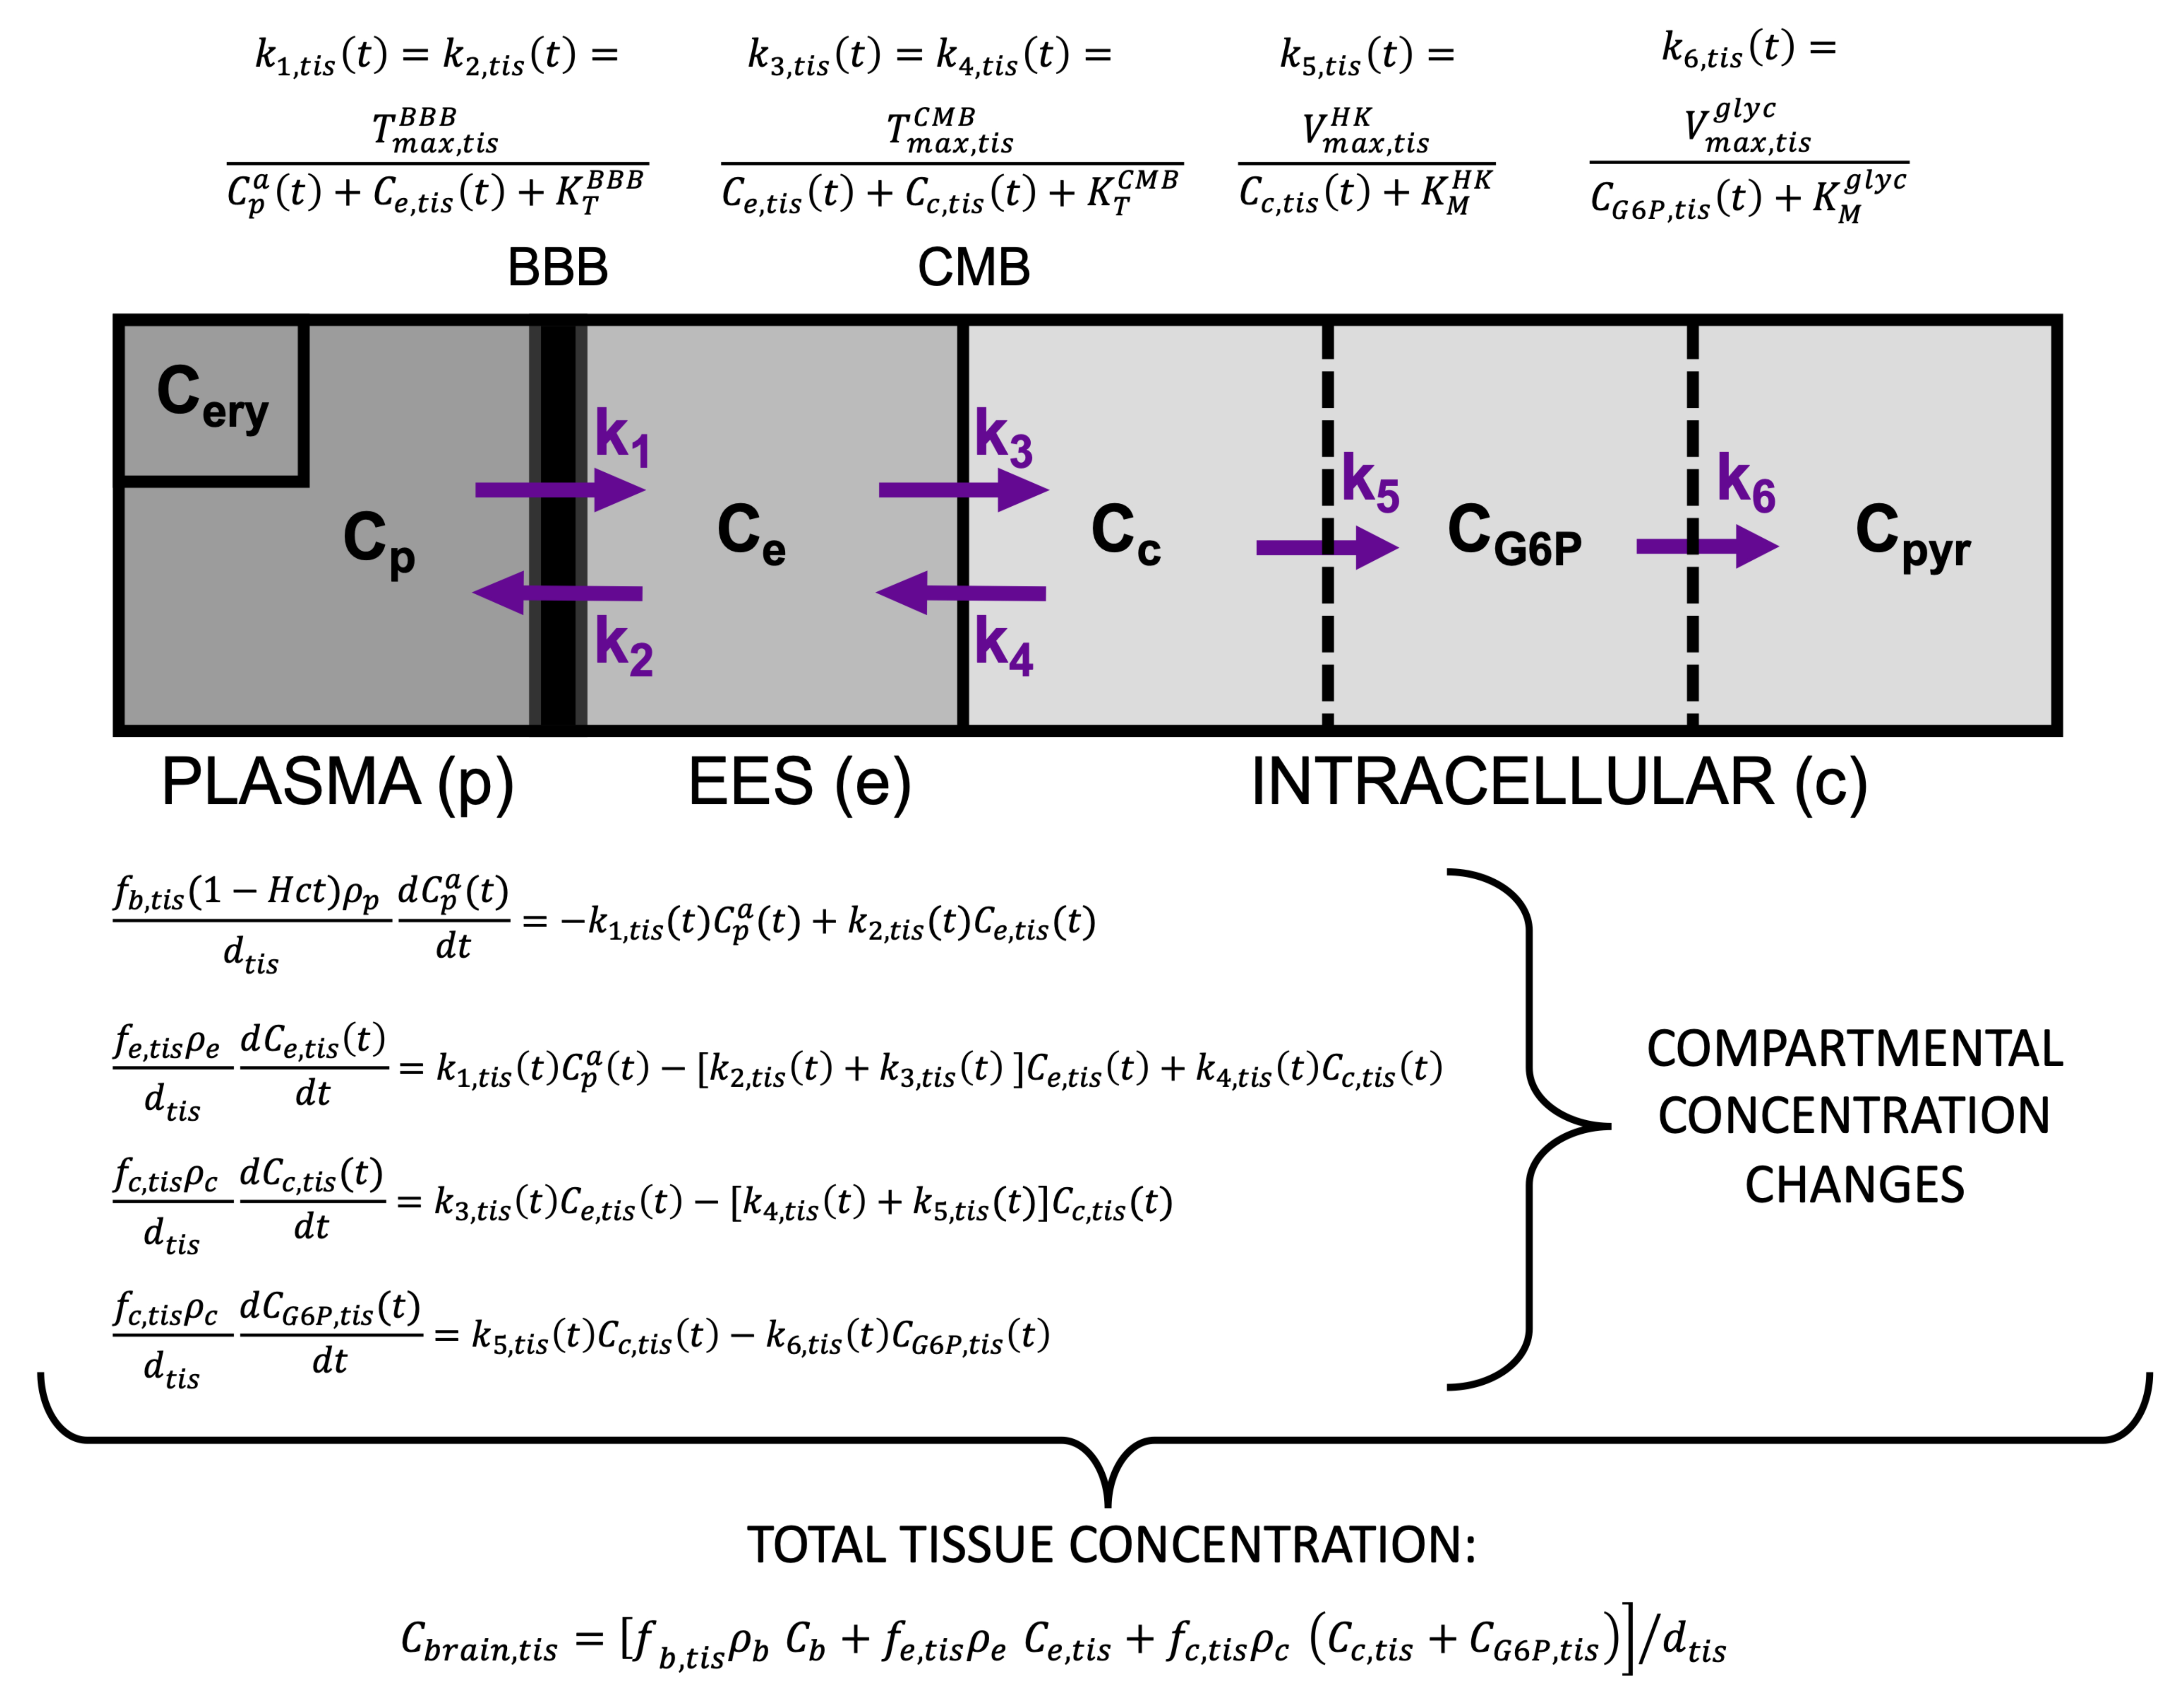
Fig. 1. The 3-tissue-compartment model for D-glucose brain uptake.
Solid lines denote tissue compartments, dashed lines metabolic compartments. Ci(t) (i = p: plasma, e: EES, c: cell, b: whole blood; a = artery) are concentrations in mM. fi,tis: tissue volume fraction [mL/mL tis]; ρ: water (w) content [mL w/mL tis]; dtis: tissue density [g tis/mL tis]. Rate constants [mL w/g tis/min] follow reversible MM kinetics: Tmax, Vmax [µmol/g tis/min] denote maximum rates for transport and phosphorylation, respectively, and KT, KM [mM] the corresponding concentrations at half-maximum rate.
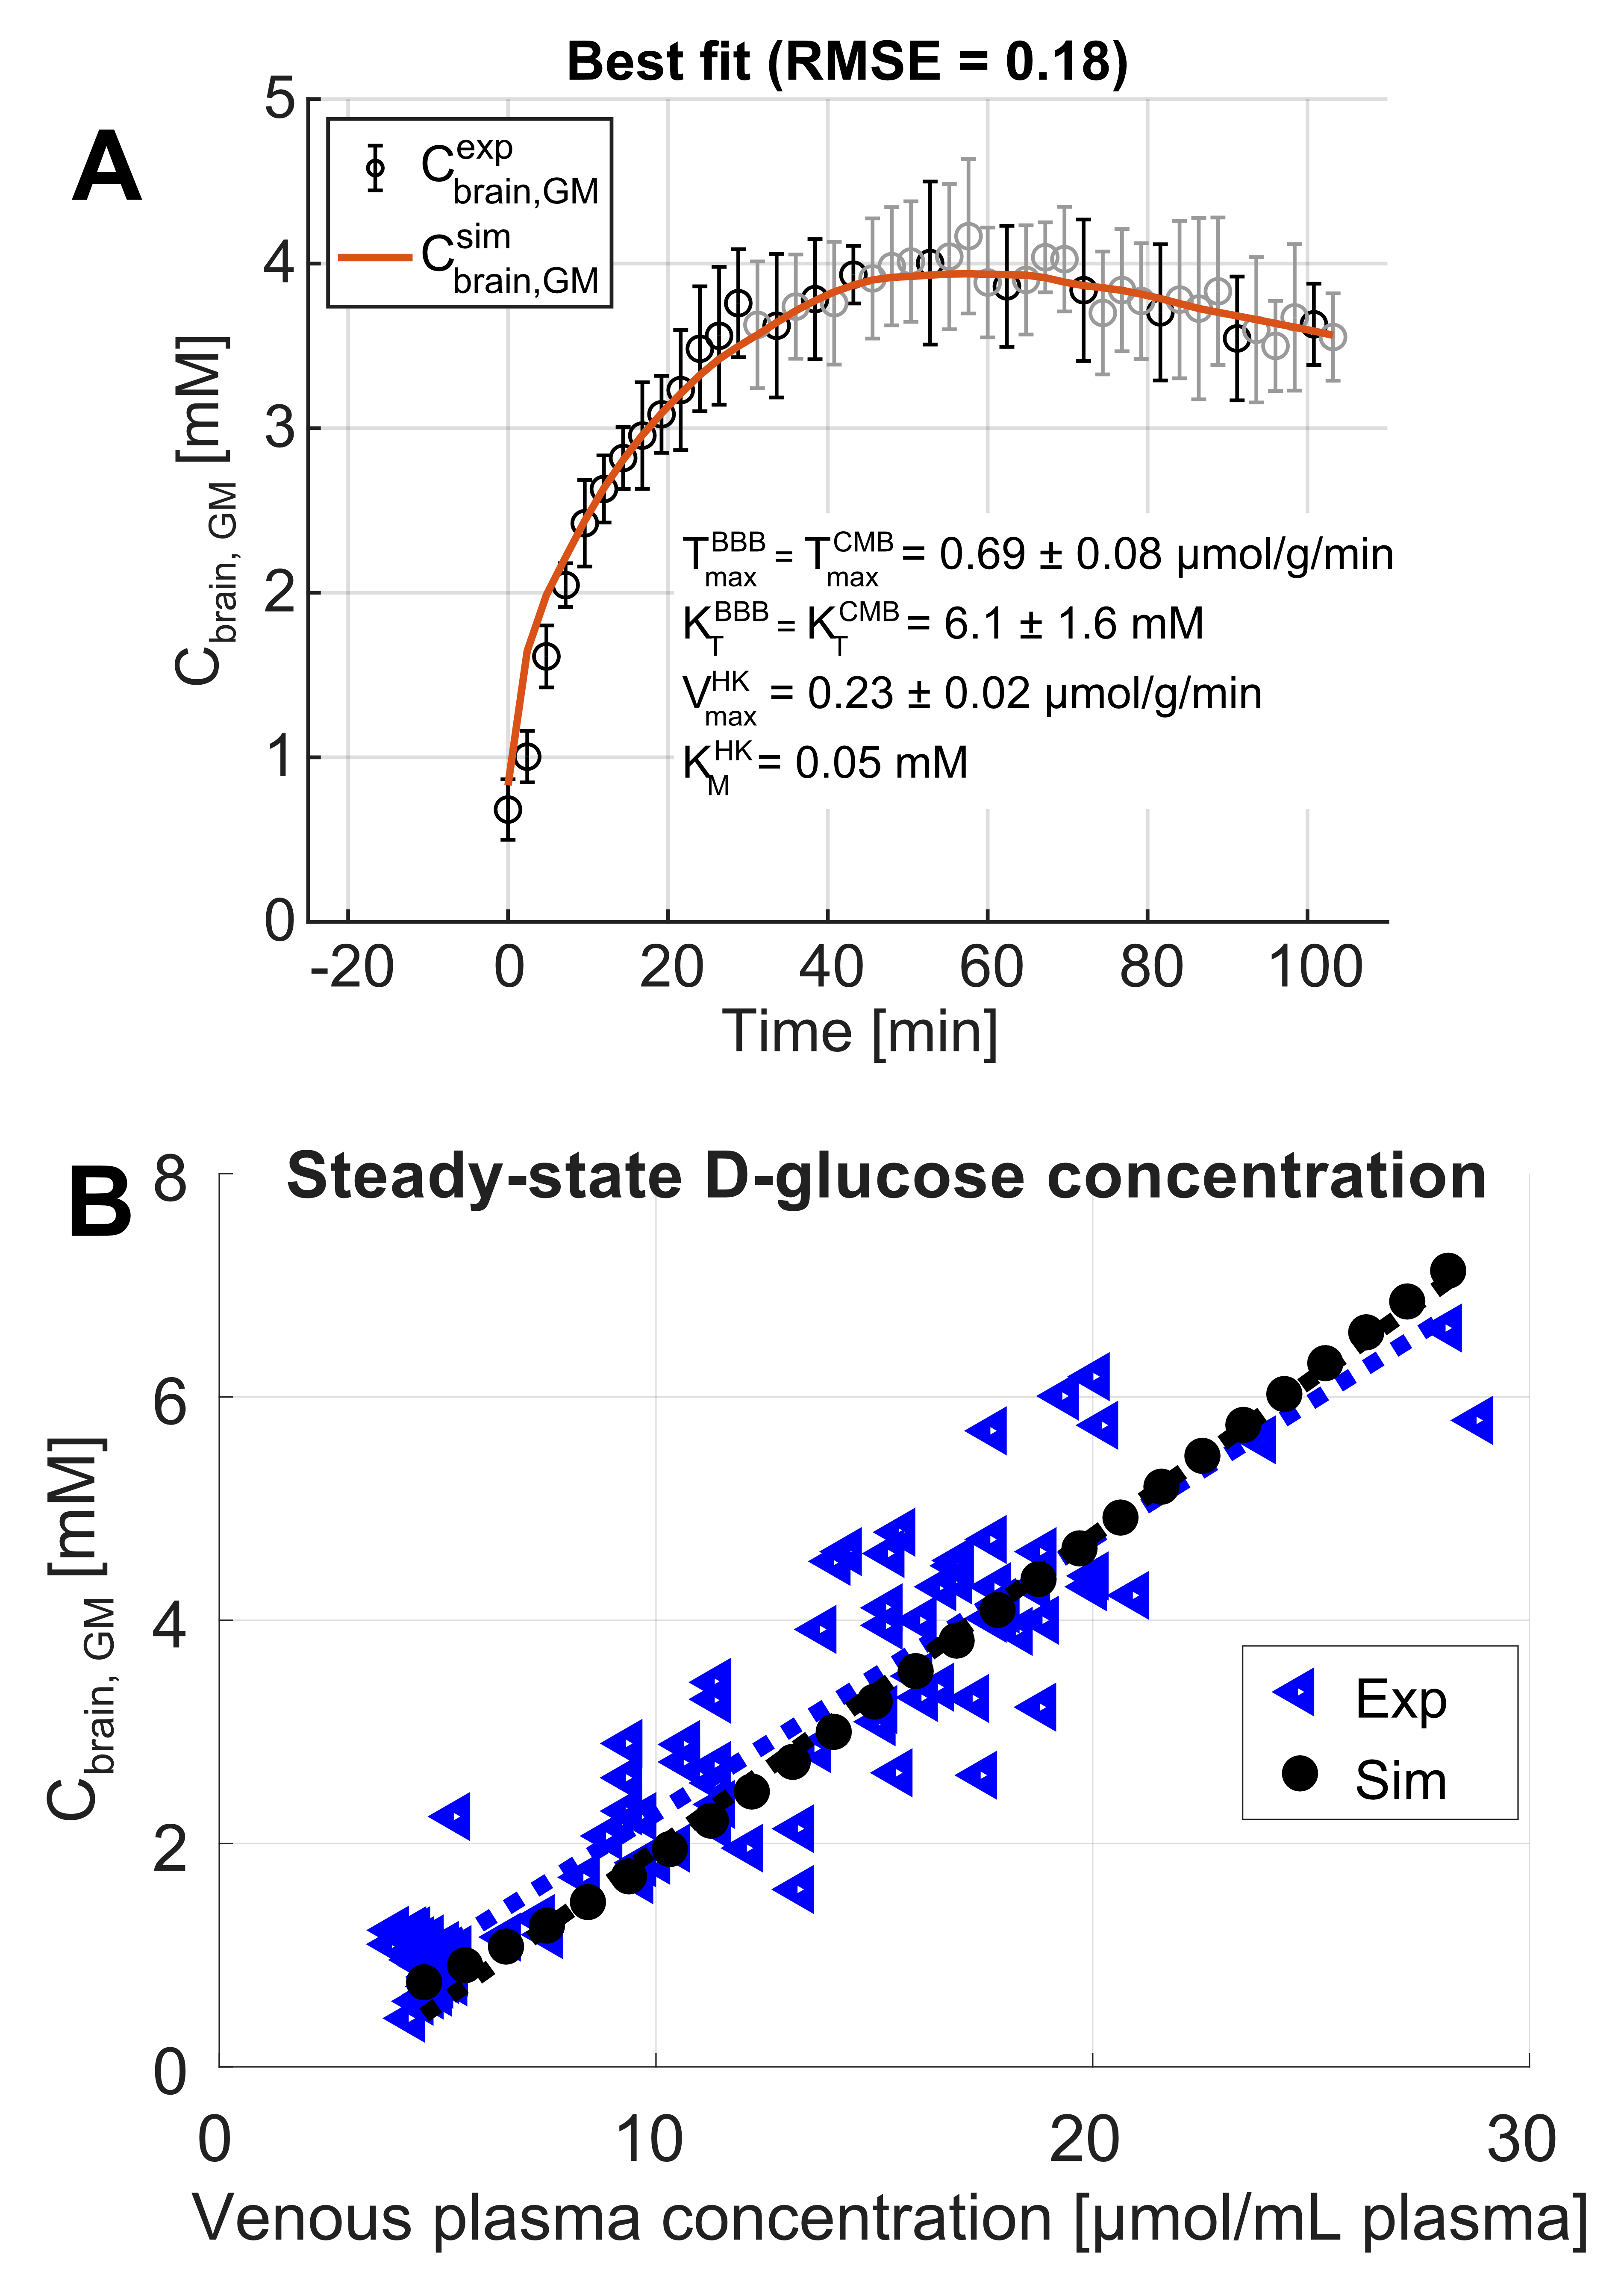
Fig. 2. Use of MRS data to refine the Michaelis-Menten constants in the proposed model.
A) Fitting of the proposed model using experimental D-glucose concentrations in gray matter (GM, black circles, average over 5 subjects from Shestov et al.7) as a function of time. The orange line corresponds to the lowest RMSE. B) Validation comparing simulated (black filled circles) and experimental (blue triangles) D-glucose concentrations in GM at steady-state concentration (data from three MRS studies7-9), as a function of venous plasma D-glucose concentration.
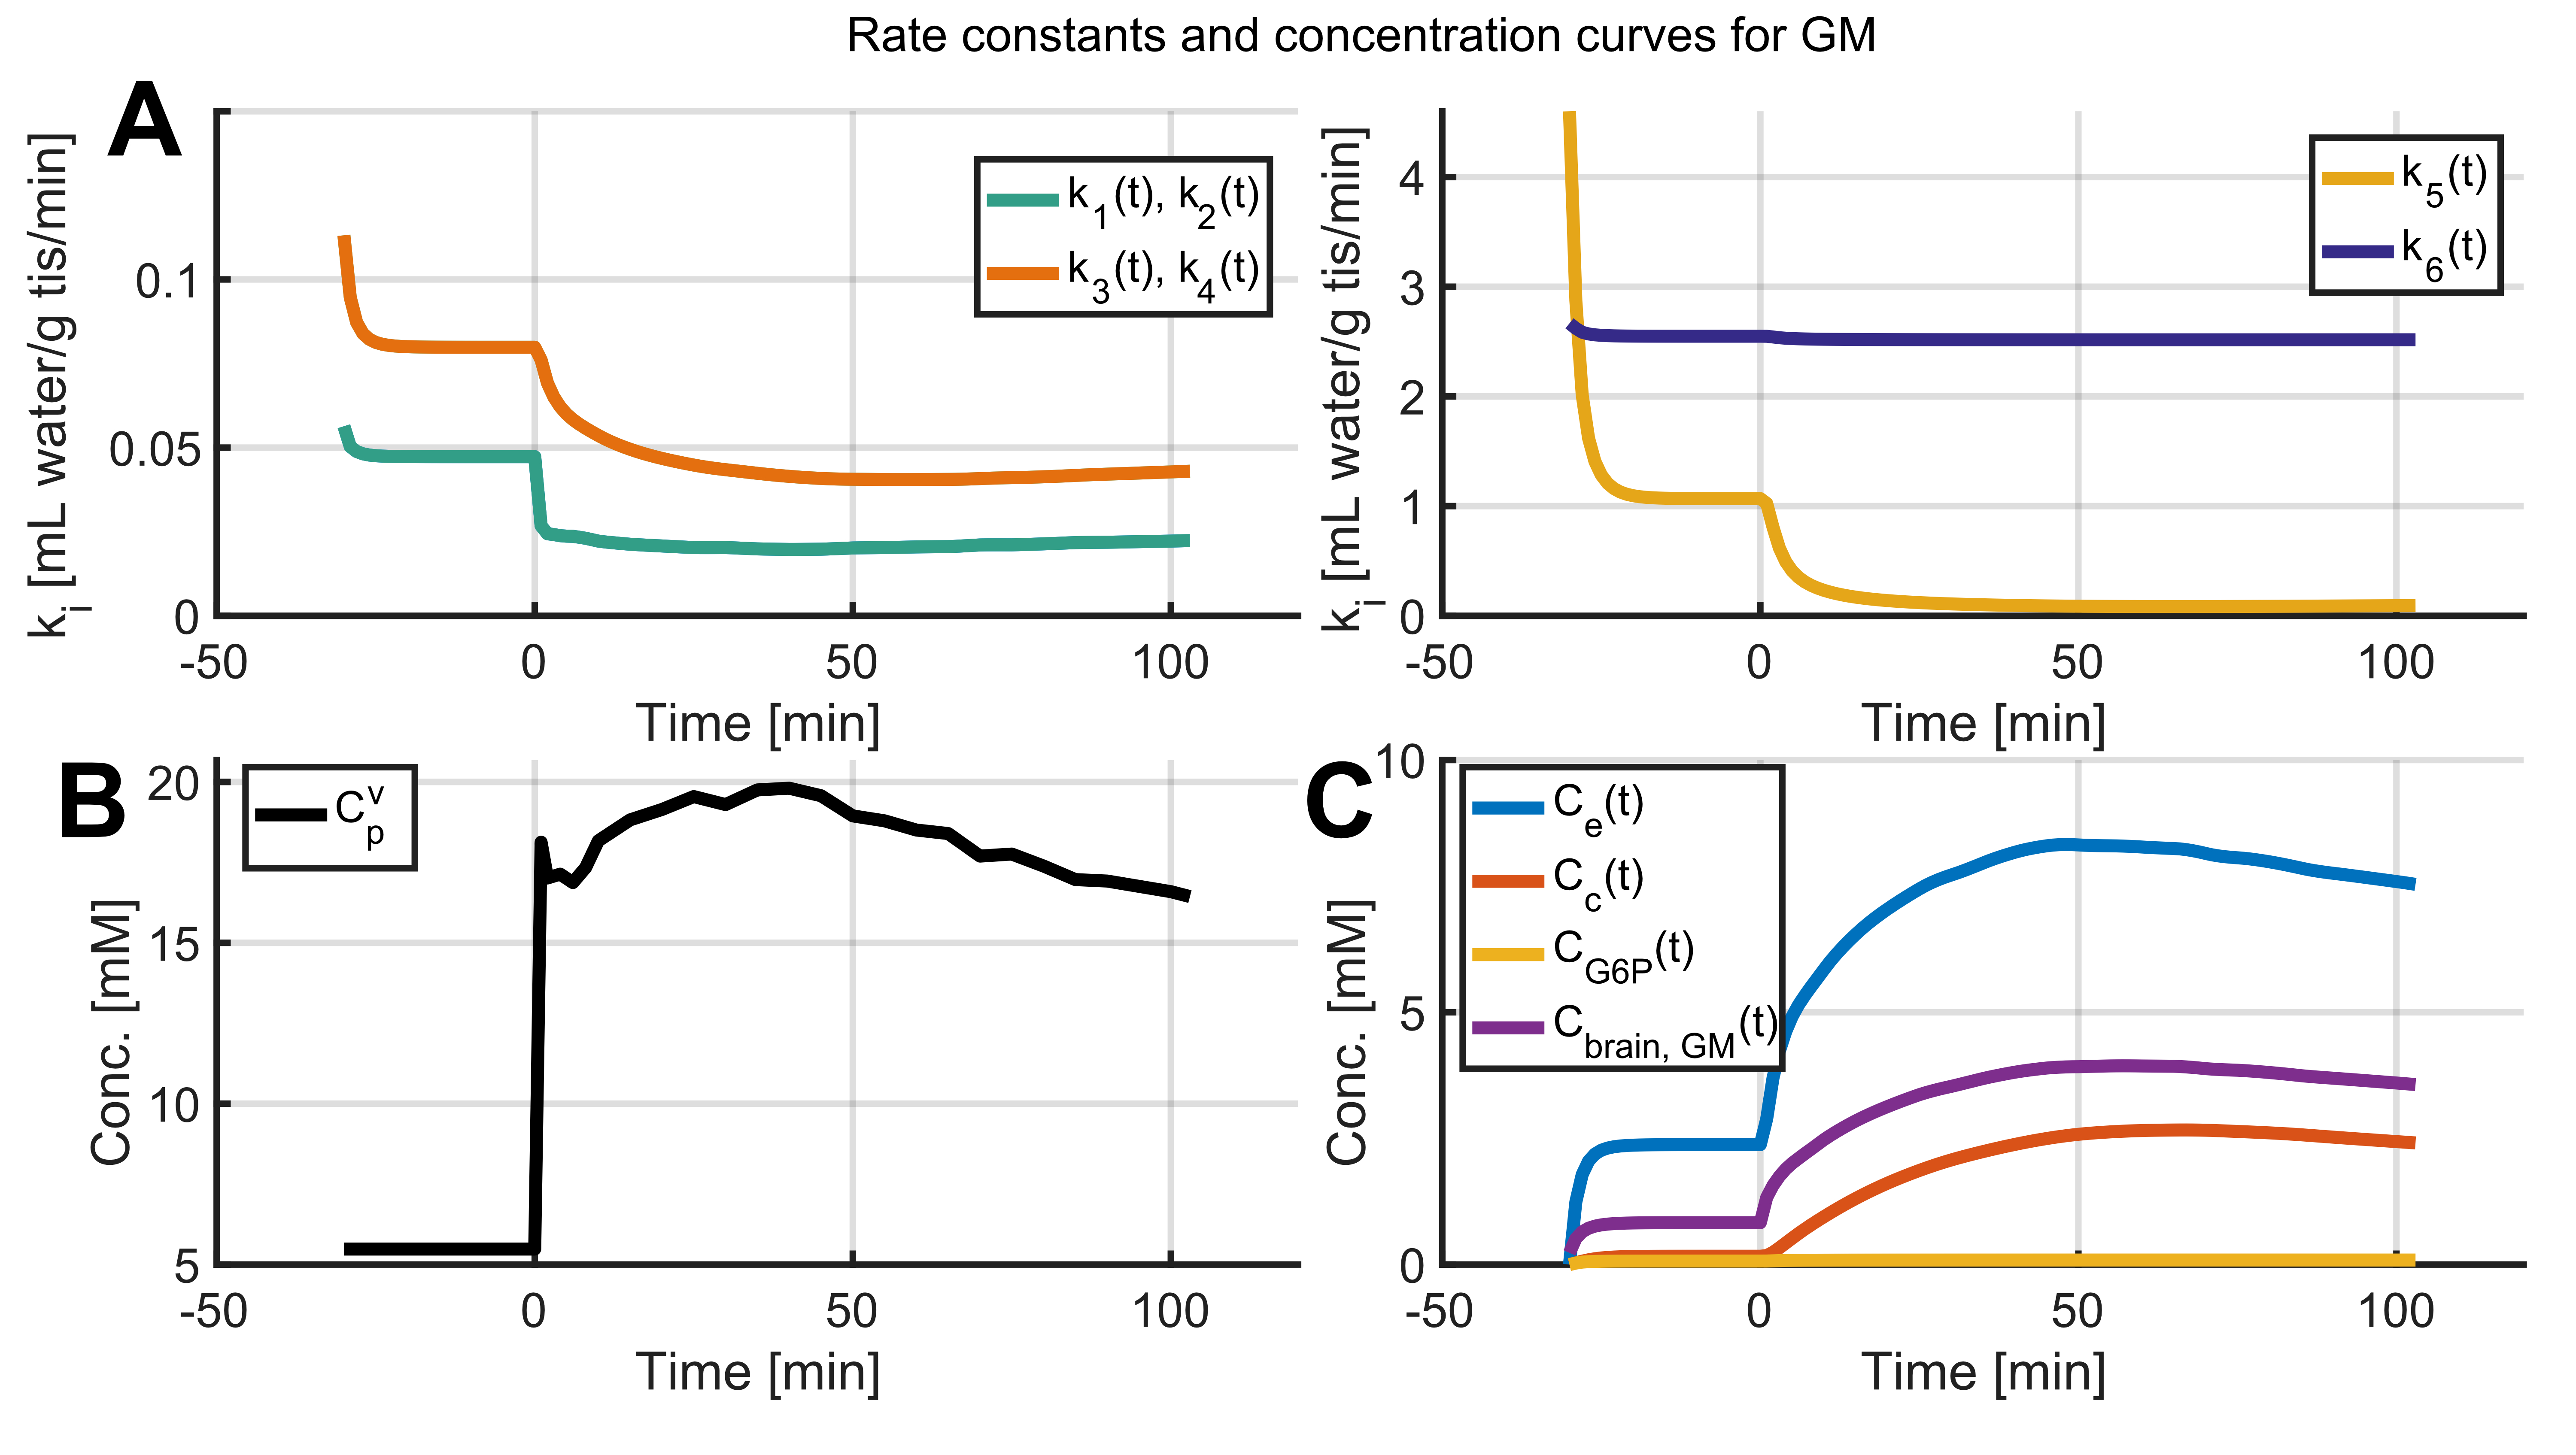
Fig. 3. Rate constants and compartmental concentrations for gray matter in human brain.
A) Rate constants ki (i = 1 – 6). B) Averaged (n = 5) experimental venous plasma glucose level (Cpv (t)) input function in mM from Shestov et al.7 C) Simulated compartmental concentrations Ce (t), Cc (t) and CG6P (t). Rate constants and compartmental concentrations were calculated using the model (Fig. 1) with the MM constants from Fig. 2A and Cpv (t) converted to Cpa (t) as input function using Cpa = Cpv - dCpa(t)/ dt·MTT, where MTT is the mean transit time obtained from CBV/CBF values from PET studies.
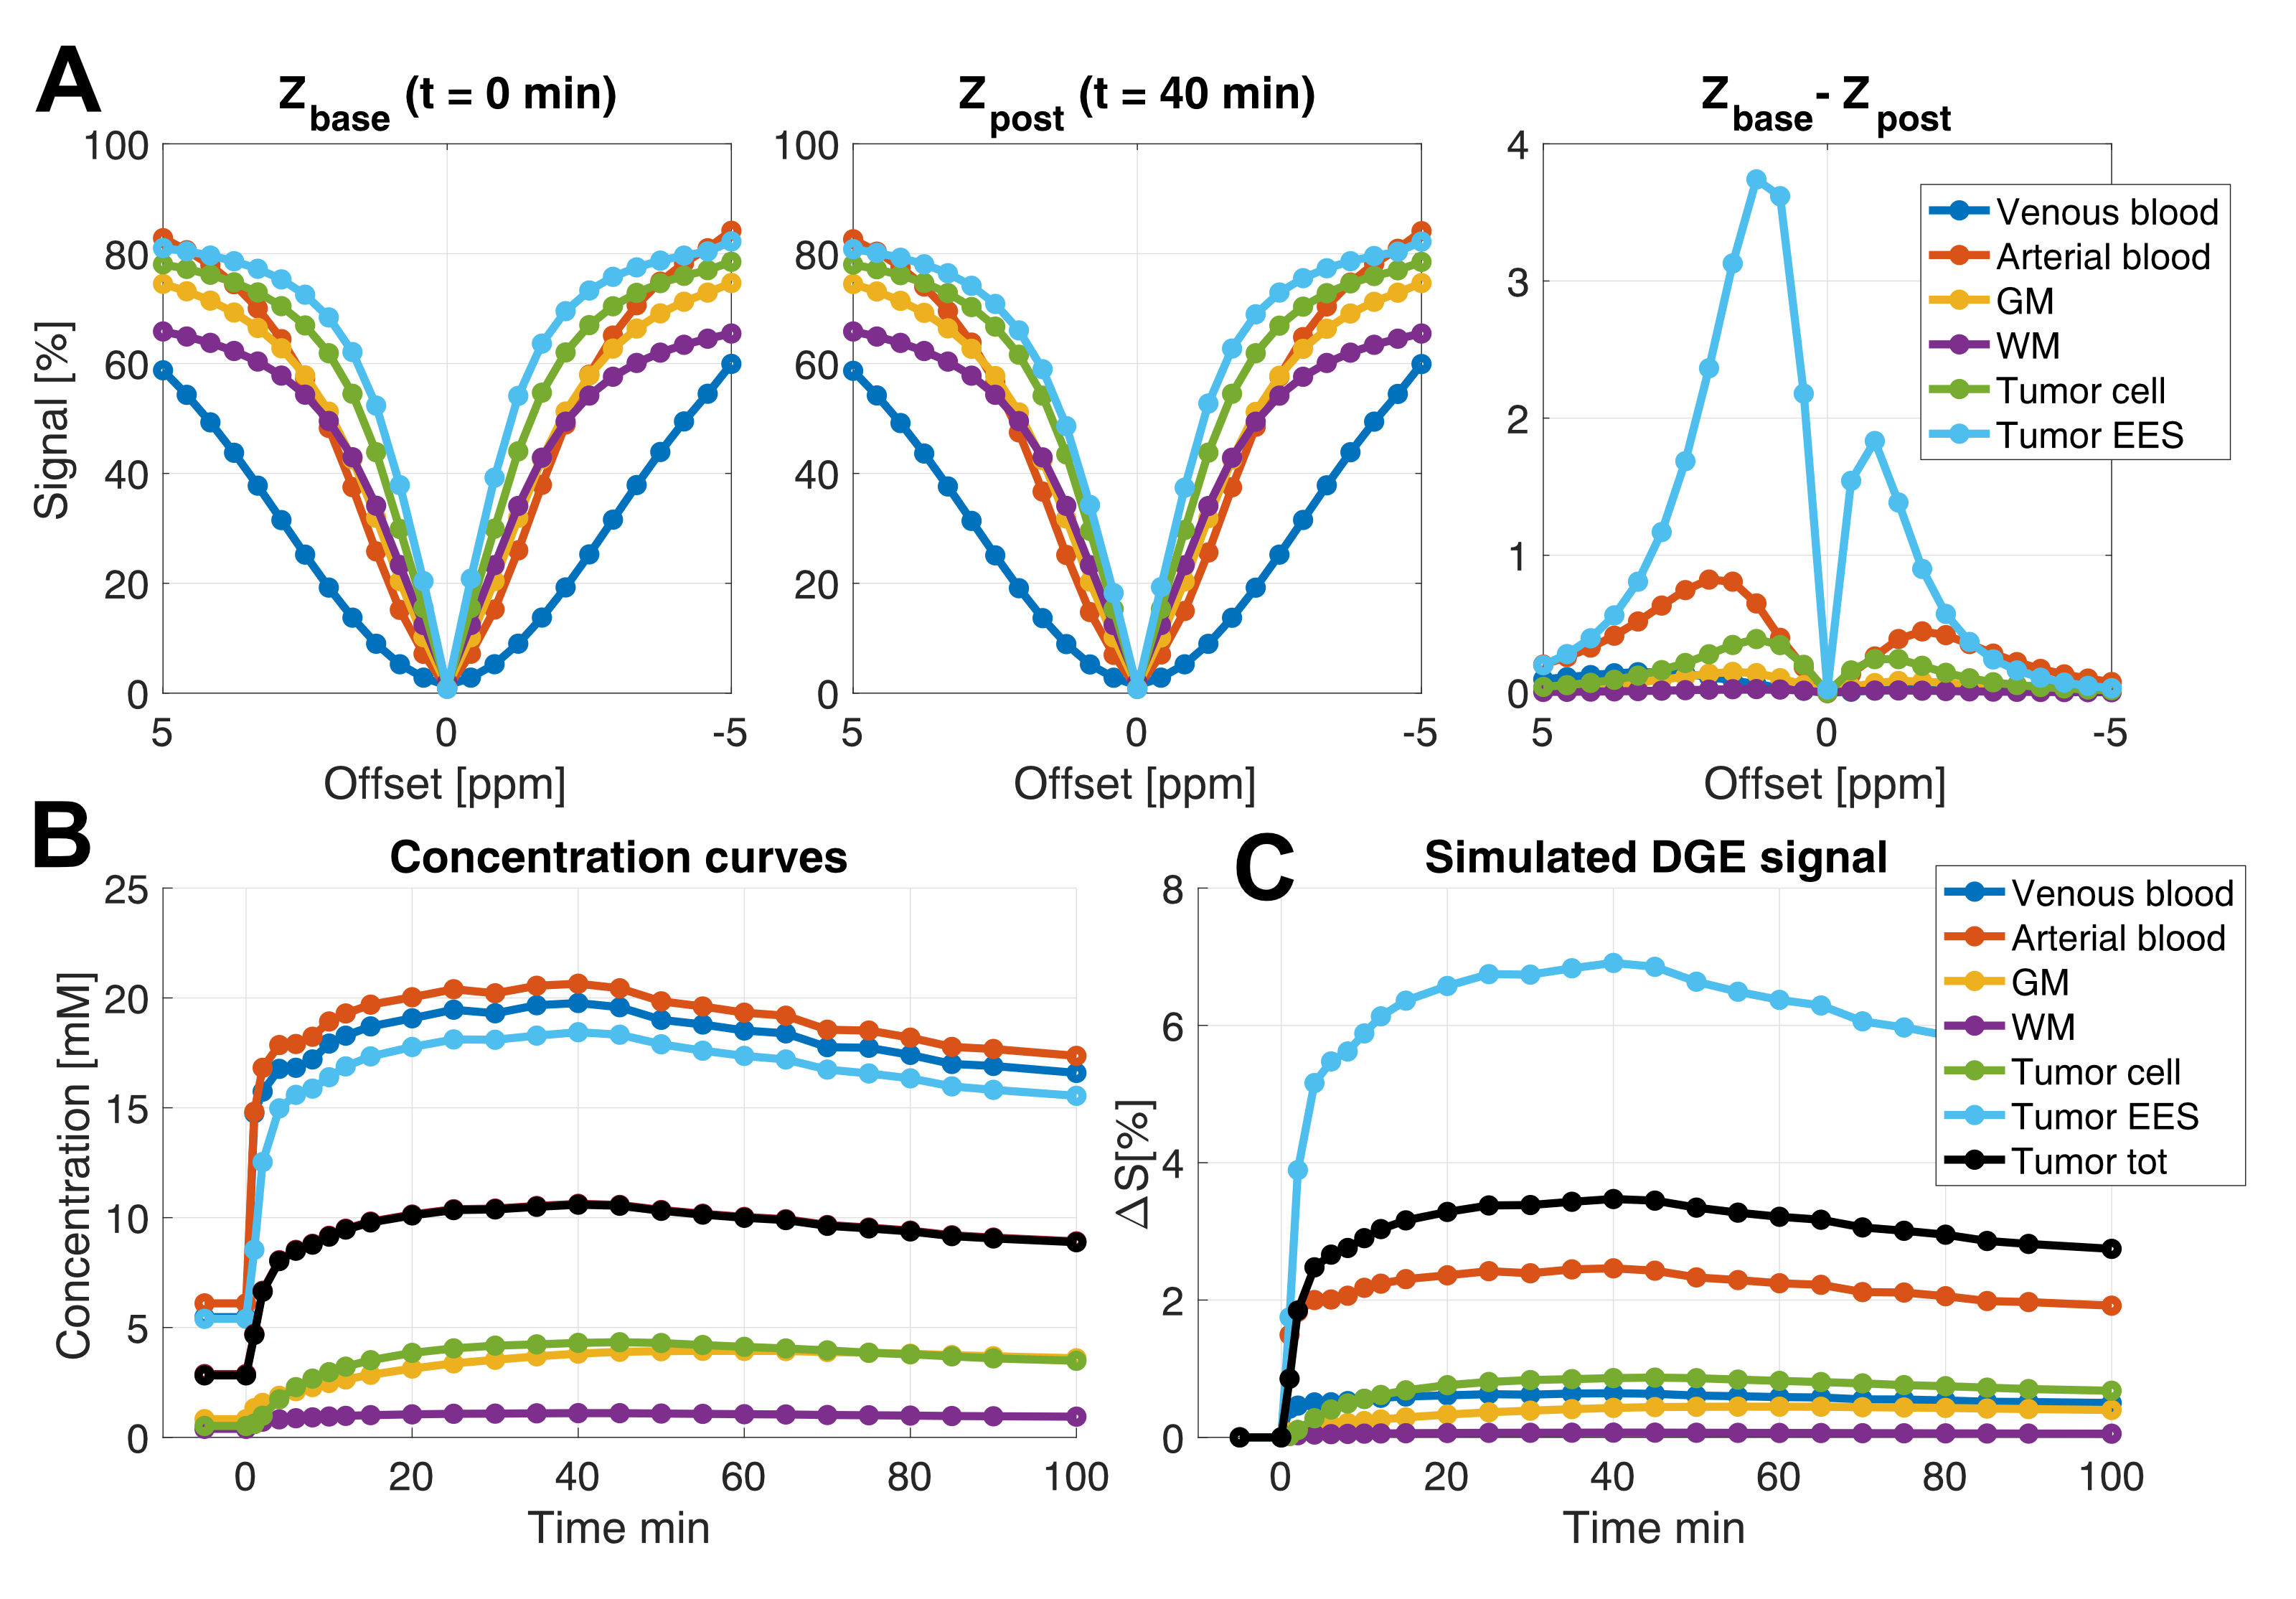
Fig. 4. Simulated concentration curves and corresponding DGE MRI signal at 7 T.
A) Left and center: Z-spectra at the time points t=0 (Zbase) and t=40 min (Zpost). Right: The difference Zbase - Zpost as a function of saturation frequency offset. B) Simulated D-glucose concentration curves in GM, WM and tumor (EES and ICS separately, as well as total tumor glucose concentration). The whole blood D-glucose concentrations were calculated from experimental venous plasma D-glucose levels. C) Simulated corresponding DGE MRI signal change (∆S).
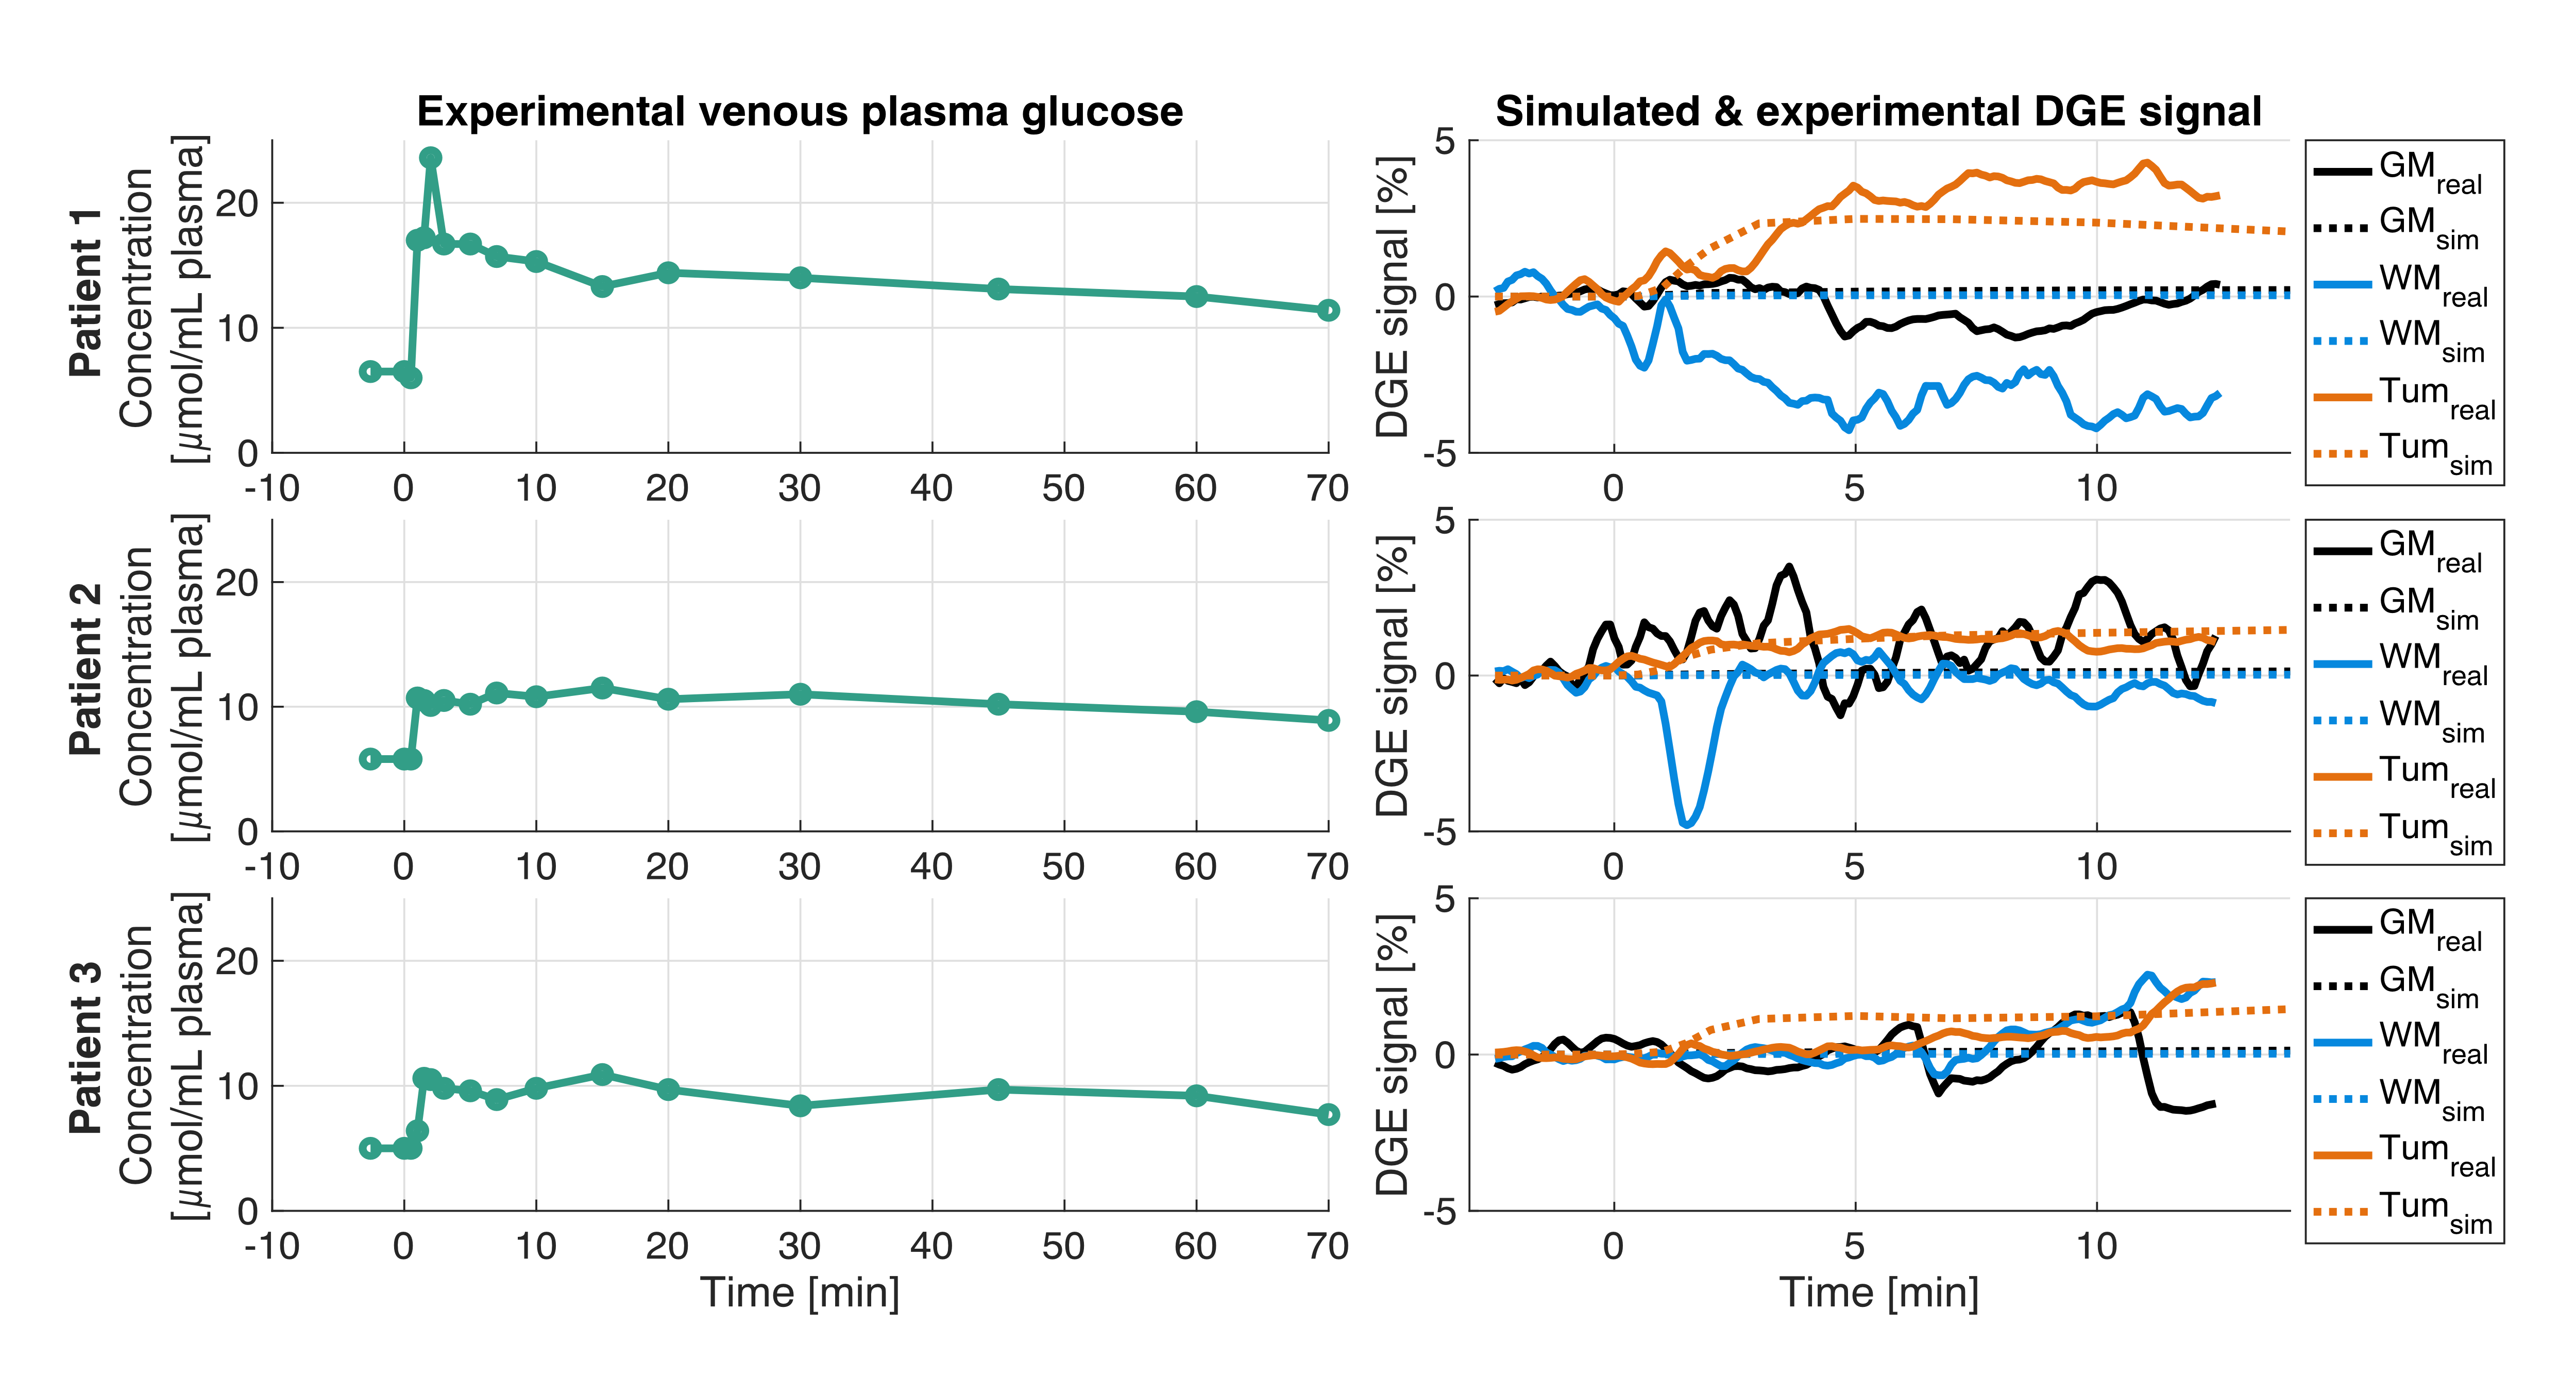
Fig. 5. Comparison of experimental and simulated DGE MRI signal changes (∆S) for three glioblastoma patients scanned at 7 T.
Data were simulated using the experimental venous plasma input functions (left column showing Cpv (t), which was converted to Cpa (t) for simulations). Right column shows ROI-averaged experimental (exp) DGE ∆S (solid lines) and simulated (sim) DGE ∆S using the proposed model (dashed lines), in grey matter (GM, black), white matter (WM, blue) and tumor (tum, orange). The cause of the experimentally measured negative signal change in WM is not yet established.