0727
Free-breathing T2 mapping of the abdomen in half the scan time using RADTSE with deep learning reconstruction1Applied Mathematics, University of Arizona, Tucson, AZ, United States, 2Digital Technology & Innovation, Siemens Healthineers, Princeton, NJ, United States, 3Electrical & Computer Engineering, University of Arizona, Tucson, AZ, United States, 4Siemens Healthineers, Tucson, AZ, United States, 5Medical Imaging, University of Arizona, Tucson, AZ, United States, 6Siemens Healthineers, Los Angeles, CA, United States, 7Radiology, Houston Methodist Research Institute, Houston, TX, United States, 8Siemens Healthineers, Austin, TX, United States, 9Biomedical Engineering, University of Arizona, Tucson, AZ, United States
Synopsis
Keywords: Liver, Image Reconstruction
Motivation: Free-breathing T2 mapping of the abdomen is possible for subjects that cannot hold their breath, but current techniques require long scan times that are not always possible.
Goal(s): To produce high quality T2 weighted images and T2 parameter map from highly accelerated scans of the abdomen.
Approach: Combining the radial turbo spin echo sequence, navigator triggering, and new deep learning reconstruction techniques to increase the acceleration of the acquisition while maintaining image quality.
Results: Using these techniques, one can produce high quality T2 weighted images and T2 parameter map of the entire abdomen in under 4 minutes.
Impact: Deep learning techniques significantly reduce both scan time and reconstruction time for highly accelerated, navigator-triggered free breathing T2 weighted images and T2 parameter map of the abdomen.
Introduction
Radial turbo spin echo (RADTSE) is an efficient T2-weighted imaging technique that yields a series of registered TE images and a T2 parameter map1. In abdominal imaging, RADTSE data is typically acquired during a breath hold. This causes limitations, especially in sick or pediatric patients that have trouble holding their breath. Navigator-triggered prospective acquisition correction (PACE) allows for a free-breathing (FB) RADTSE scan but scanning efficiency is compromised in subjects with slow respiratory cycles. We present a deep learning (DL) technique to reconstruct T2-weighted images and T2 parameter maps from highly accelerated FB RADTSE data and reduce the overall scan time without compromising image quality or T2 estimation accuracy.Methods
FB PACE triggered RADTSE abdominal datasets from 93 consenting subjects were acquired at two imaging sites on 3T Siemens MAGNETOM scanners (Skyra, Vida). Each scan consisted of 28 2D slices with an echo train length (ETL) of 32 and echo spacing ranging 8.1-8.46ms. 384 radial lines were collected with 512 readout points per line. Although the prescribed scan time is 4:15min, the true scan time ranged from 5:24-14:24min depending on respiratory rate.The reconstruction network was designed as a cascaded physics guided model described in 2. This architecture was duplicated for two separate networks for two distinct tasks. First, k-space data from all TEs are combined into a TE-averaged “composite” dataset, which creates a well-sampled T2-weighted anatomical image. This network is trained in a fully supervised manner to predict denoised images from accelerated inputs. The second network reconstructs individual TE images, which can be fit pixel-wise to a T2 parameter map3. Because each TE image is highly under-sampled (12 radial lines per TE), there is no ground truth available for training. Thus, we utilize a self-supervision scheme, illustrated in Figure 1. We utilize a custom loss function that incorporates high dynamic range (HDR) loss4 with respect to the acquired k-space and robust equivariant (REQ) regularization5. The full loss function is stated in Equation 1, with more detail provided in Figure 1.
$$\mathcal{L}(y,\hat{y},\hat{x})=\alpha\frac{\left\lVert\frac{\mathbf{\hat{y}}-\mathbf{y}}{|\text{sg}(\mathbf{\hat{y}})|+\epsilon}\right\rVert_2}{\lVert\mathbf{y}\rVert_2}+(1-\alpha)\frac{\left\lVert\frac{\mathbf{\hat{y}}-\mathbf{y}}{|\text{sg}(\mathbf{\hat{y}})|+\epsilon}\right\rVert_1}{||\mathbf{y}||_1}+\beta\lVert{f}_{\text{pg}}(R\hat{x},AR\hat{x})-R\hat{x}\rVert_1\quad[1]$$
Results and Discussion
For reconstruction of TE images and T2 parameter map, we can maintain image quality at high acceleration rates. Figure 2 demonstrates this in retrospectively under-sampled data. First, TE images and T2 map are reconstructed using our proposed DL method and a compressed sensing (CS) method for comparison6. The CS reconstruction is referenced for testing only, and not used in training. We then reconstruct the images using only 192 and 160 total radial lines (6 and 5 lines per TE) with the DL method. The DL reconstructed images appear less noisy, with fewer streaks than the CS images.Figure 3 shows that the mean T2 values of ROIs placed in organs of interest demonstrate agreement with the CS reconstruction, and that our method is robust to under-sampling.
Figure 4 shows results of a prospective under-sampling experiment, where the same subject undergoes three scans at different under-sampling rates, and average T2 values for organs of interest are calculated across all slices where the organ is present. All ROIs for Figures 3 and 4 were fixed to circles with 5-pixel radii placed on each slice manually.
Results deteriorate when reconstructing TE images with fewer than 5 lines per TE. However, in applications where a single T2 weighted anatomical image is of interest and the quantitative images are unnecessary, higher under-sampling rates are possible. Figure 5 demonstrates that when reconstructing the composite image (using data from all TEs), it is possible to use as few as 96 lines while maintaining image quality.
Total scan-time depends on the respiratory rate of the subject. For the full 384-line acquisition, observed scan-times ranged from 5:24-14:24min, with a mean scan-time of 8:39min (n=65). For the 192-line, 160-line, 128-line, and 96-line acquisitions, mean scan-times were reduced to 4:01 (n=3), 3:45 (n=2), 3:08 (n=2), and 2:48 (n=3) min, respectively.
In addition to accelerating scans, the DL reconstruction is fast (~20 seconds per slice) compared to CS techniques (~30 minutes per slice), providing the ability to view images right after the acquisition.
Conclusion
By using the proposed deep learning reconstruction, we can significantly decrease the scan-time in PACE triggered FB RADTSE. This has significant clinical relevance, as we observe a 56% reduction in mean scan-time when we sample only 160 lines compared to 384 lines, which we show is adequate for reconstruction of TE images and a T2 map. If only a T2-weighted anatomical image is of interest, we show that acquiring just 96 lines is adequate, which leads to a 68% reduction in scan-time compared to the 384-line acquisition.Acknowledgements
We would like to acknowledge grant support from the National Institutes of Health (CA245920 and EB031894), Arizona Biomedical Research Centre (CTR056039), the Technology and Research Initiative Fund (TRIF) Improving Health Initiative, and the University of Arizona’s National Science Foundation supported Research Training Group in Data Driven Discovery.References
1. Keerthivasan MB, Galons JP, Johnson K, Umapathy L, Martin DR, Bilgin A, Altbach MI. Abdominal T2-Weighted Imaging and T2 Mapping Using a Variable Flip Angle Radial Turbo Spin-Echo Technique. J Magnetic Resonance Imaging. 2022 Jan;55(1):289-300.
2. Toner, B., Arberet, S., Han, F., Nadar, M., Deshpande, V., Altbach, M., & Bilgin, A. (2023). Deep learning reconstruction of radial T2 weighted data sets with data consistent unrolled neural networks. In Proceedings of the 2023 Annual Meeting of the ISMRM, Toronto, CA.
3. Huang, C., Altbach, M. I., & El Fakhri, G. (2014). Pattern recognition for rapid T2 mapping with stimulated echo compensation. Magnetic resonance imaging, 32(7), 969-974.
4. Mildenhall, B., Hedman, P., Martin-Brualla, R., Srinivasan, P. P., & Barron, J. T. (2022). Nerf in the dark: High dynamic range view synthesis from noisy raw images. In Proceedings of the IEEE/CVF Conference on Computer Vision and Pattern Recognition (pp. 16190-16199).
5. Chen, D., Tachella, J., & Davies, M. E. (2022). Robust equivariant imaging: a fully unsupervised framework for learning to image from noisy and partial measurements. In Proceedings of the IEEE/CVF Conference on Computer Vision and Pattern Recognition (pp. 5647-5656).
6. Huang, C., Graff, C. G., Clarkson, E. W., Bilgin, A., & Altbach, M. I. (2012). T2 mapping from highly undersampled data by reconstruction of principal component coefficient maps using compressed sensing. Magnetic resonance in medicine, 67(5), 1355-1366.
Figures
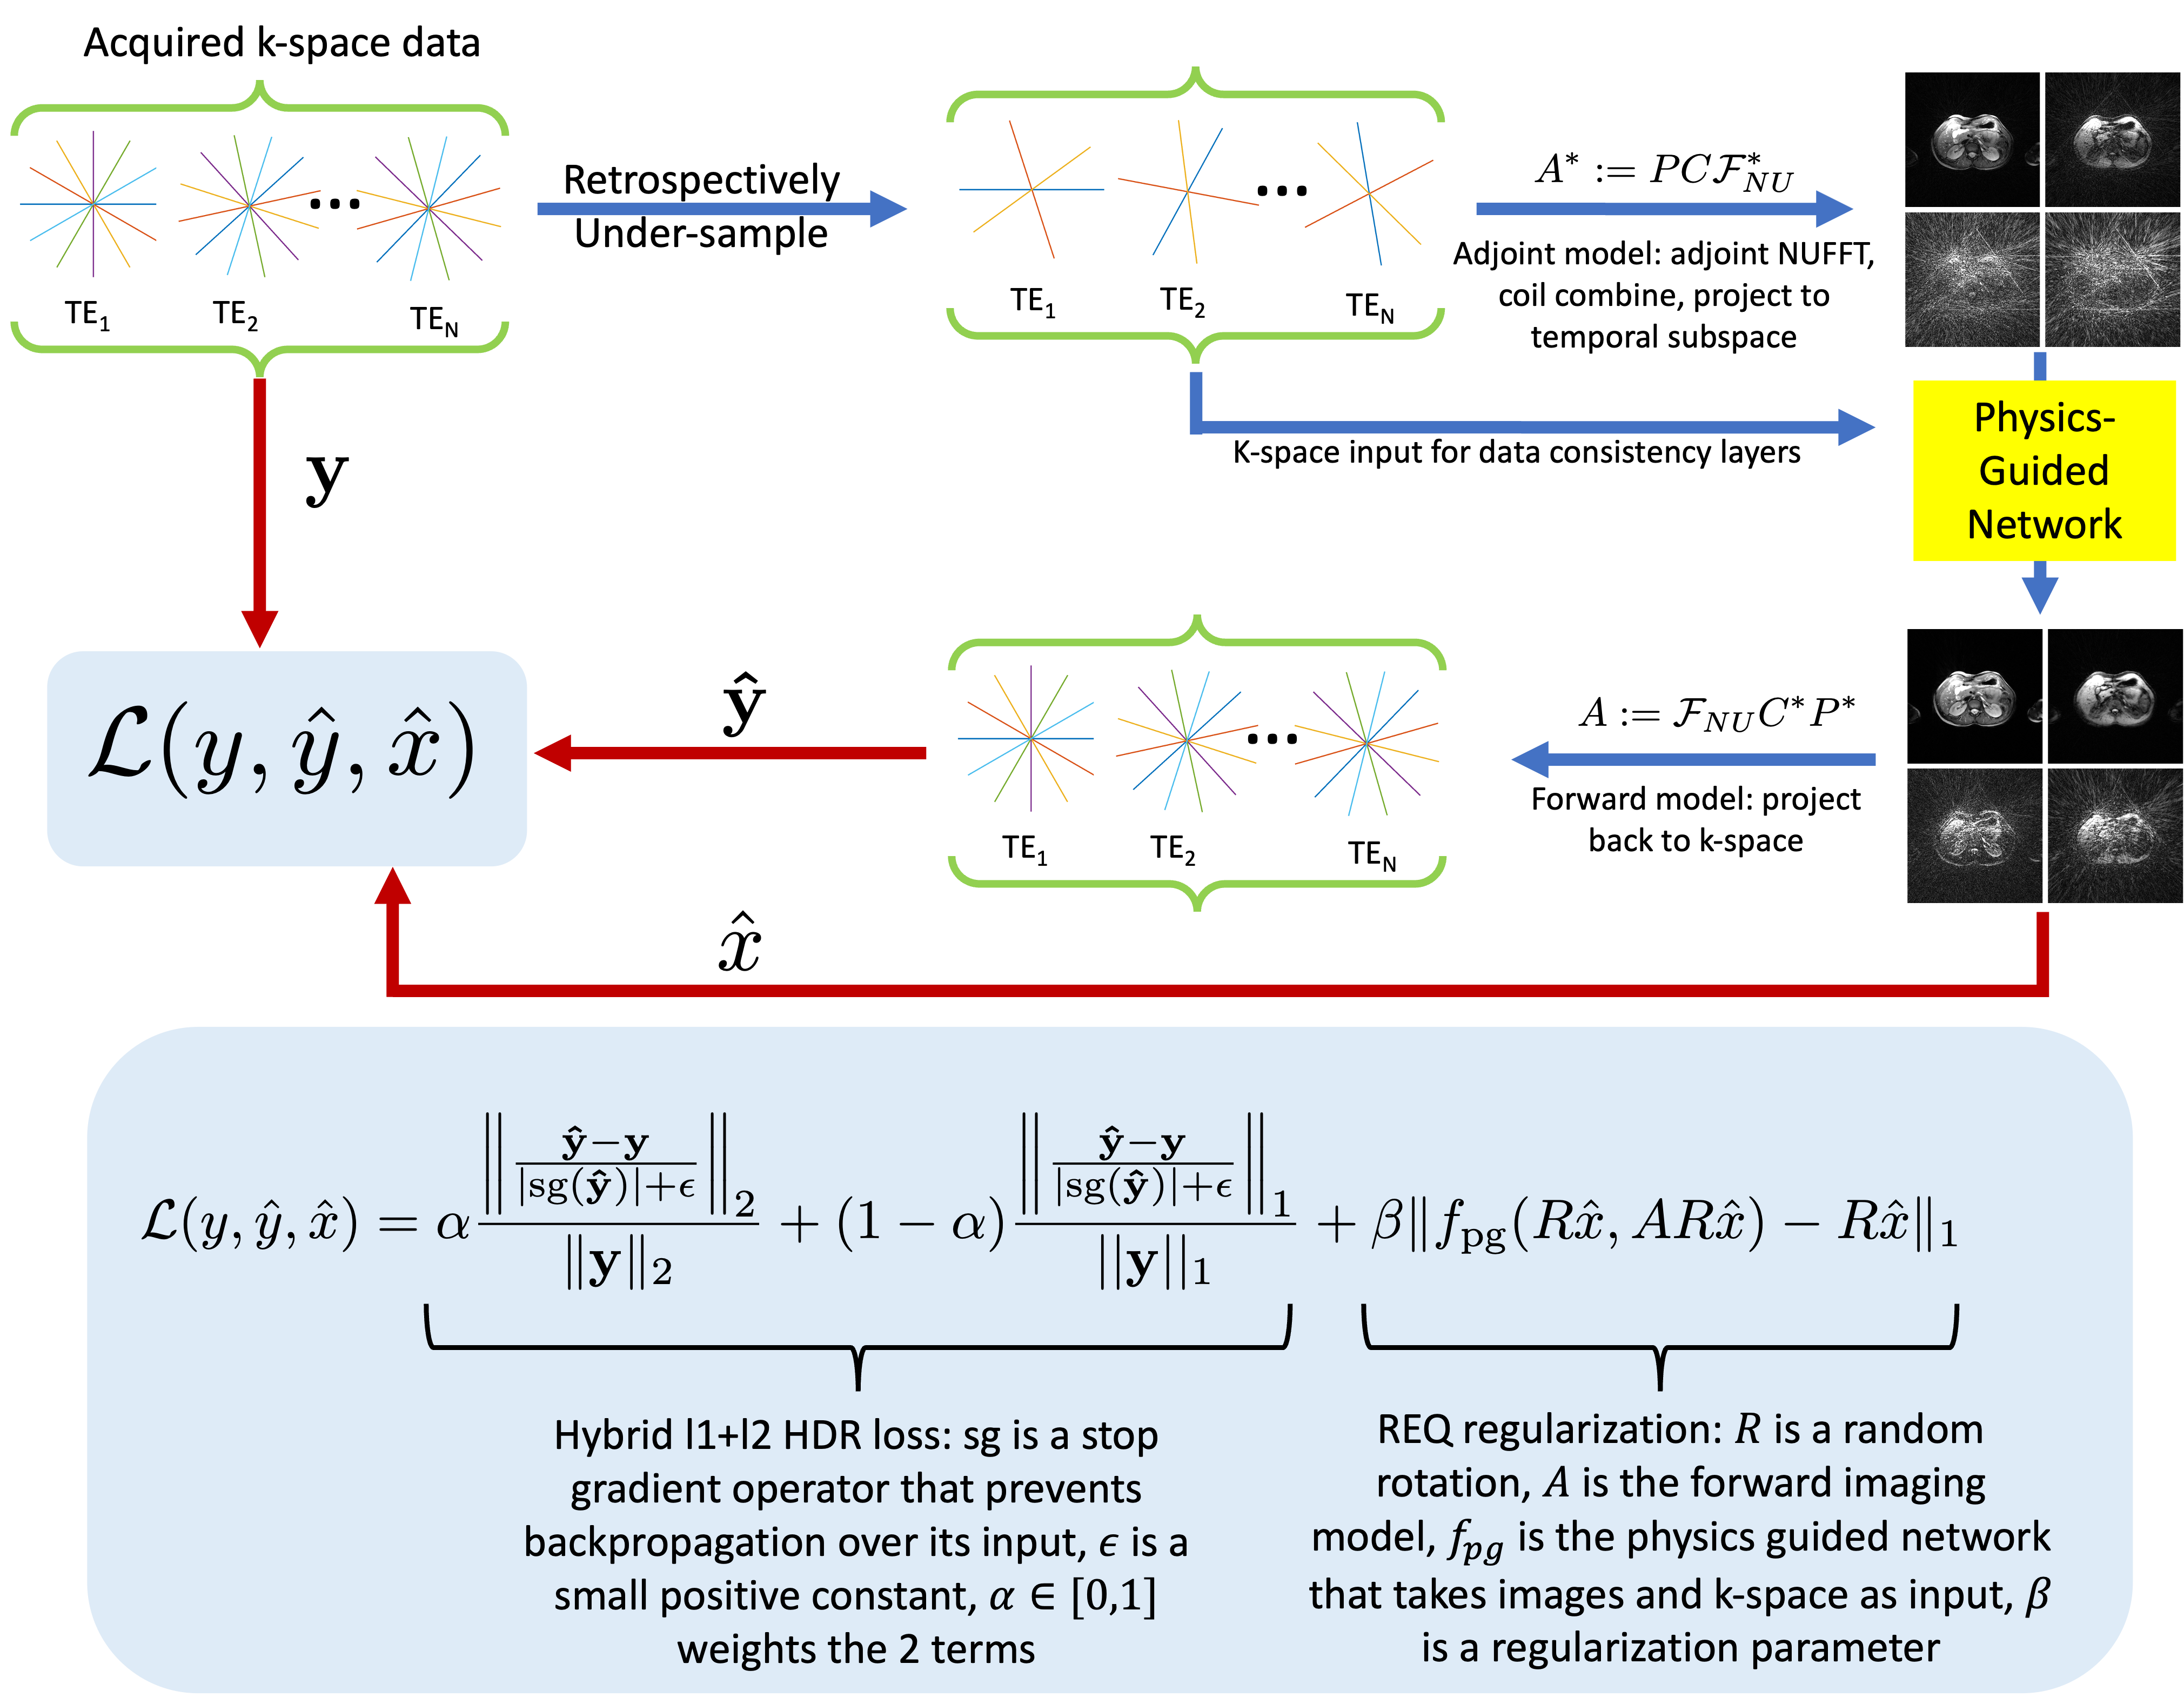
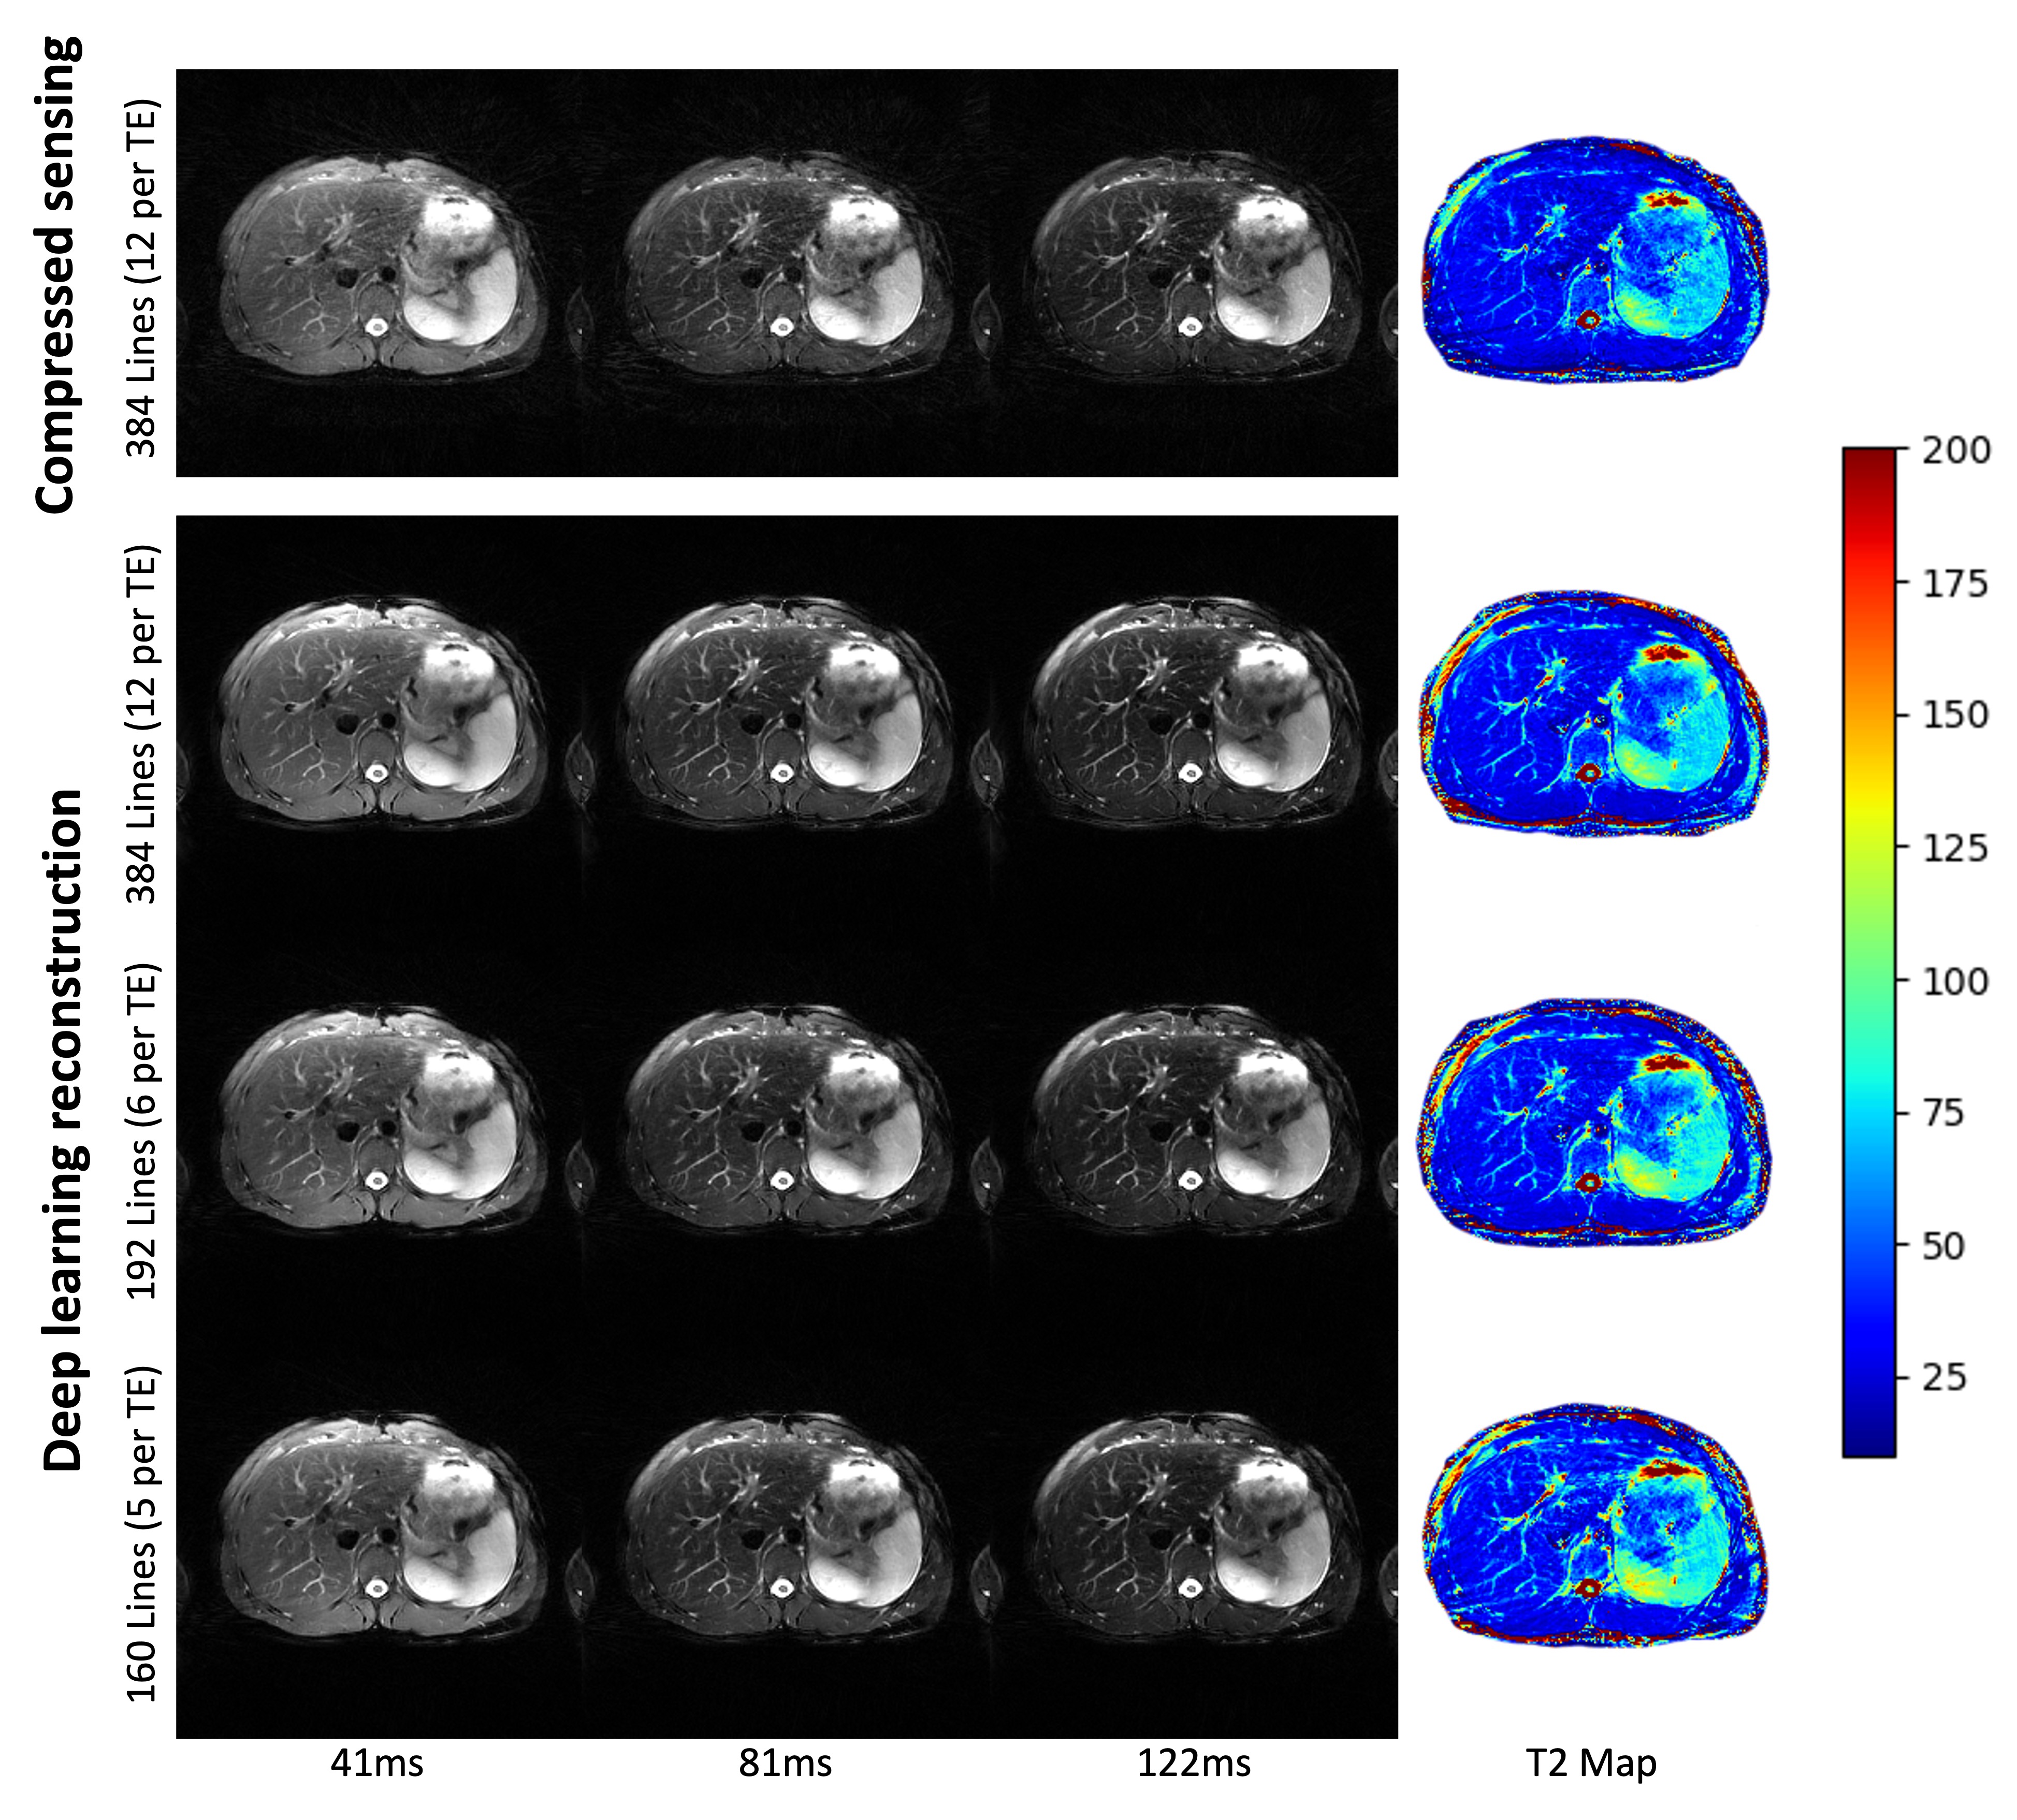
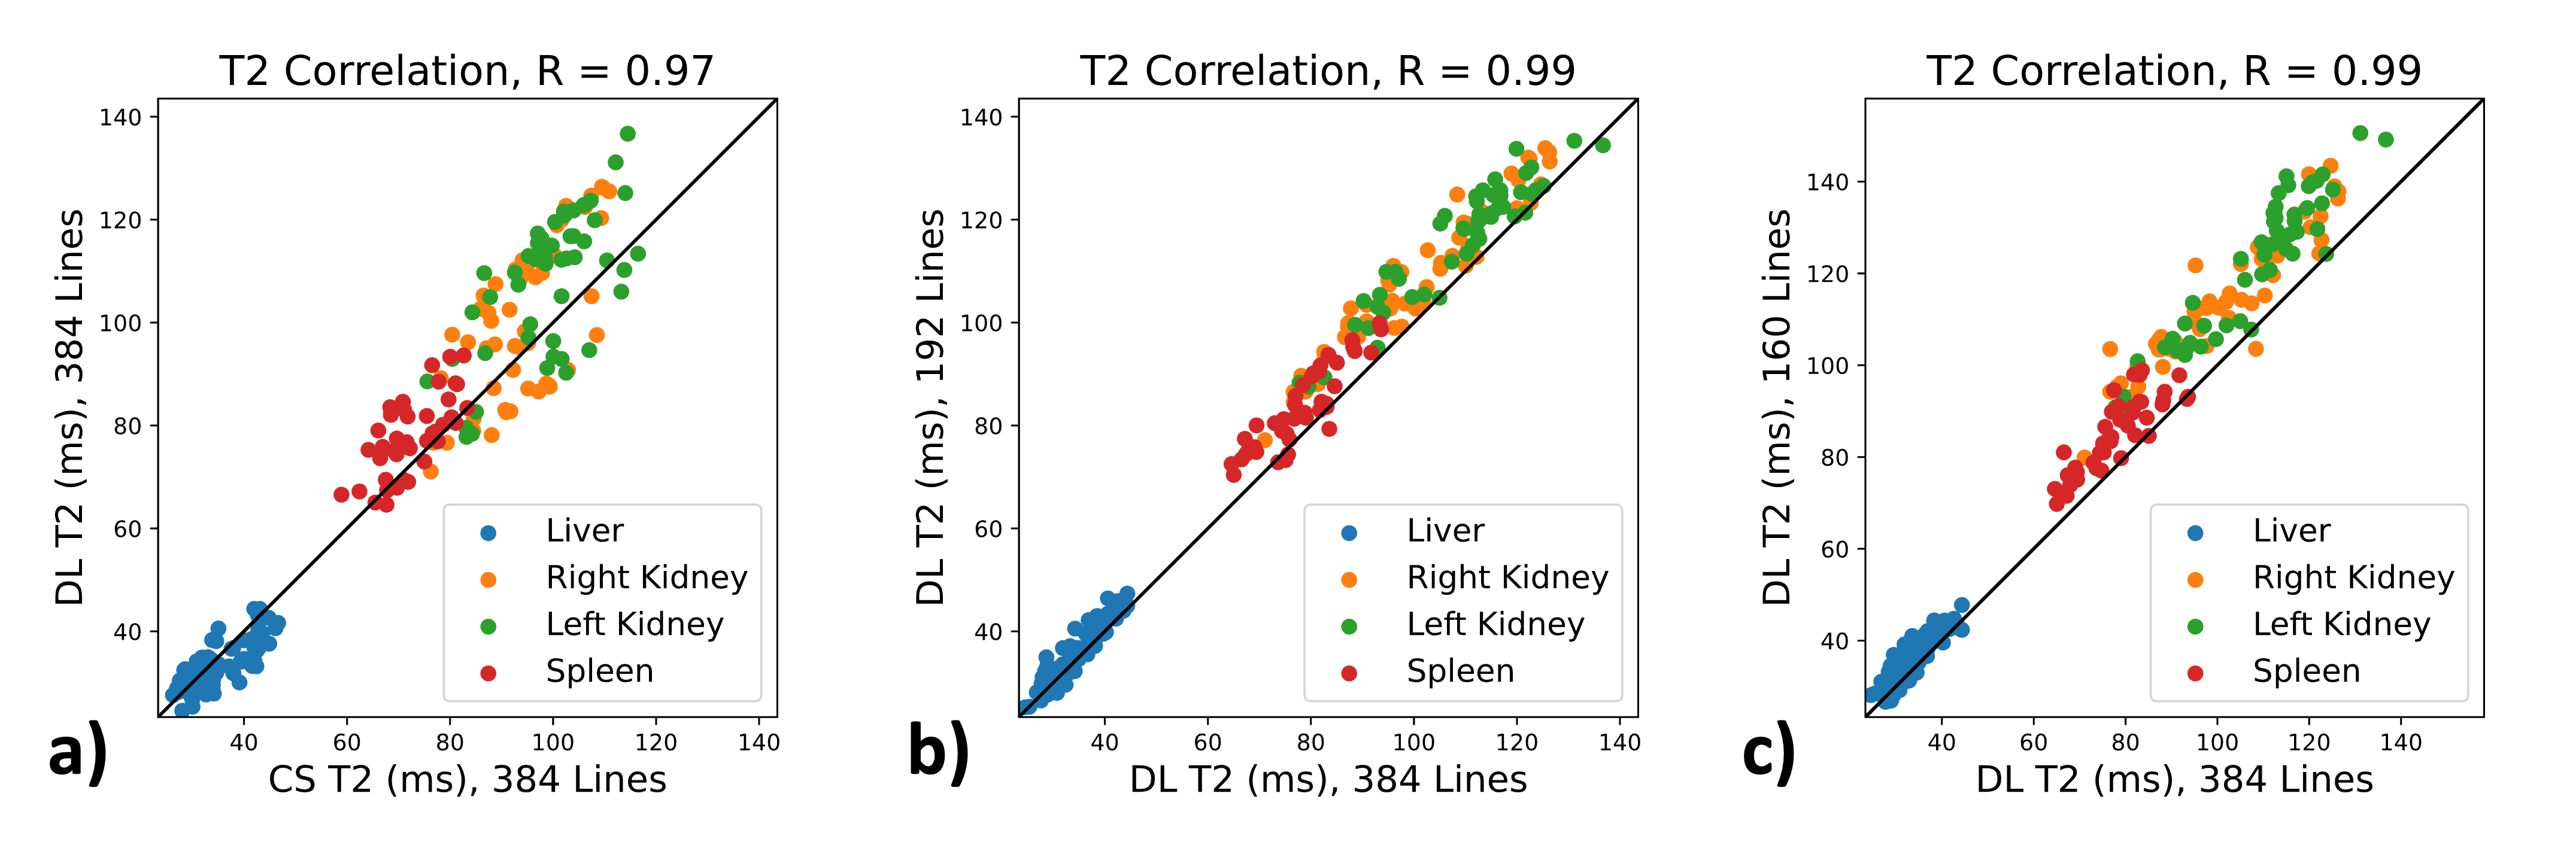
Figure 3: Comparison of mean T2 values within ROIs. a) shows that with the full acquired dataset, T2 values obtained using the DL and CS methods show strong correlation, and the datapoints cluster around the identity line. b) and c) compare the DL method using retrospectively under-sampled data with the same method utilizing the entire dataset. We observe strong correlation between the T2 values, albeit a small positive bias from the under-sampled reconstruction.
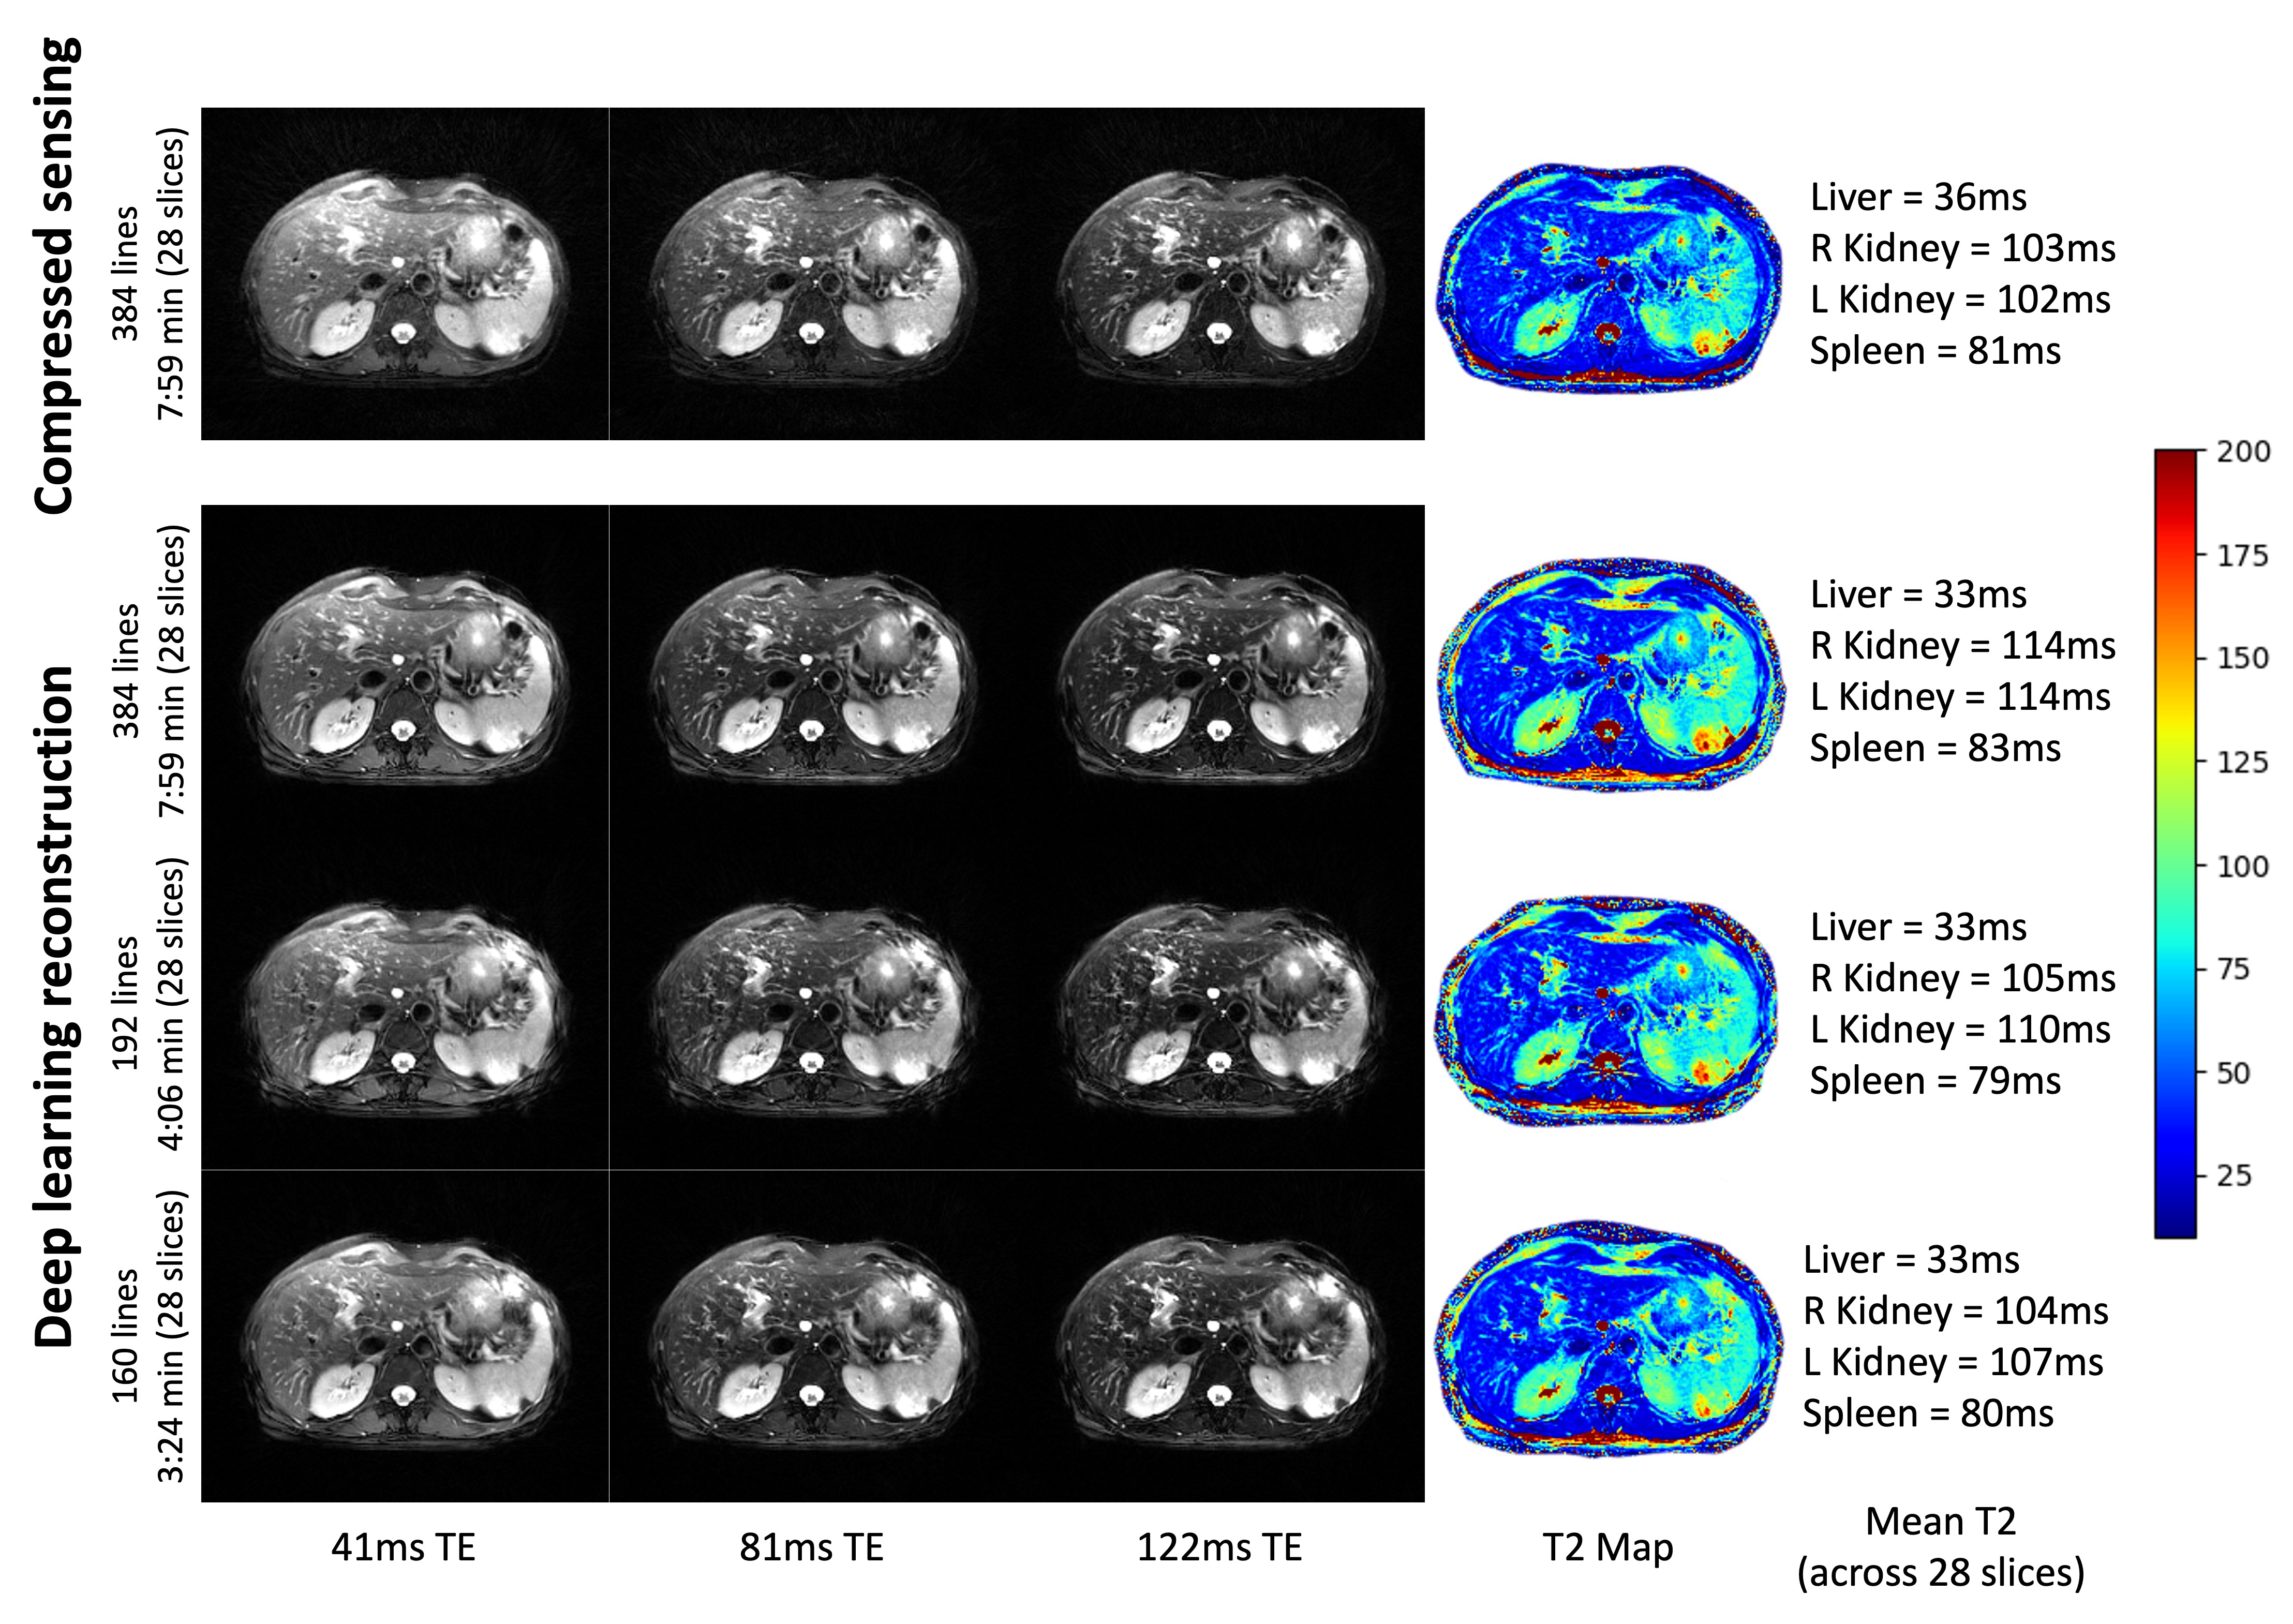
Figure 4: 3 of the 32 TE images and T2 map of the same subject scanned 3 different times at different under-sampling rates. A 7:59min, 384-line acquisition was reconstructed with both the CS and DL methods. A 4:06min, 192-line acquisition was reconstructed with the DL method. A 3:24min, 160-line acquisition was reconstructed with the DL method. Mean T2 values across all slices (since ROIs can differ for each scan) of 4 organs reported to the right.
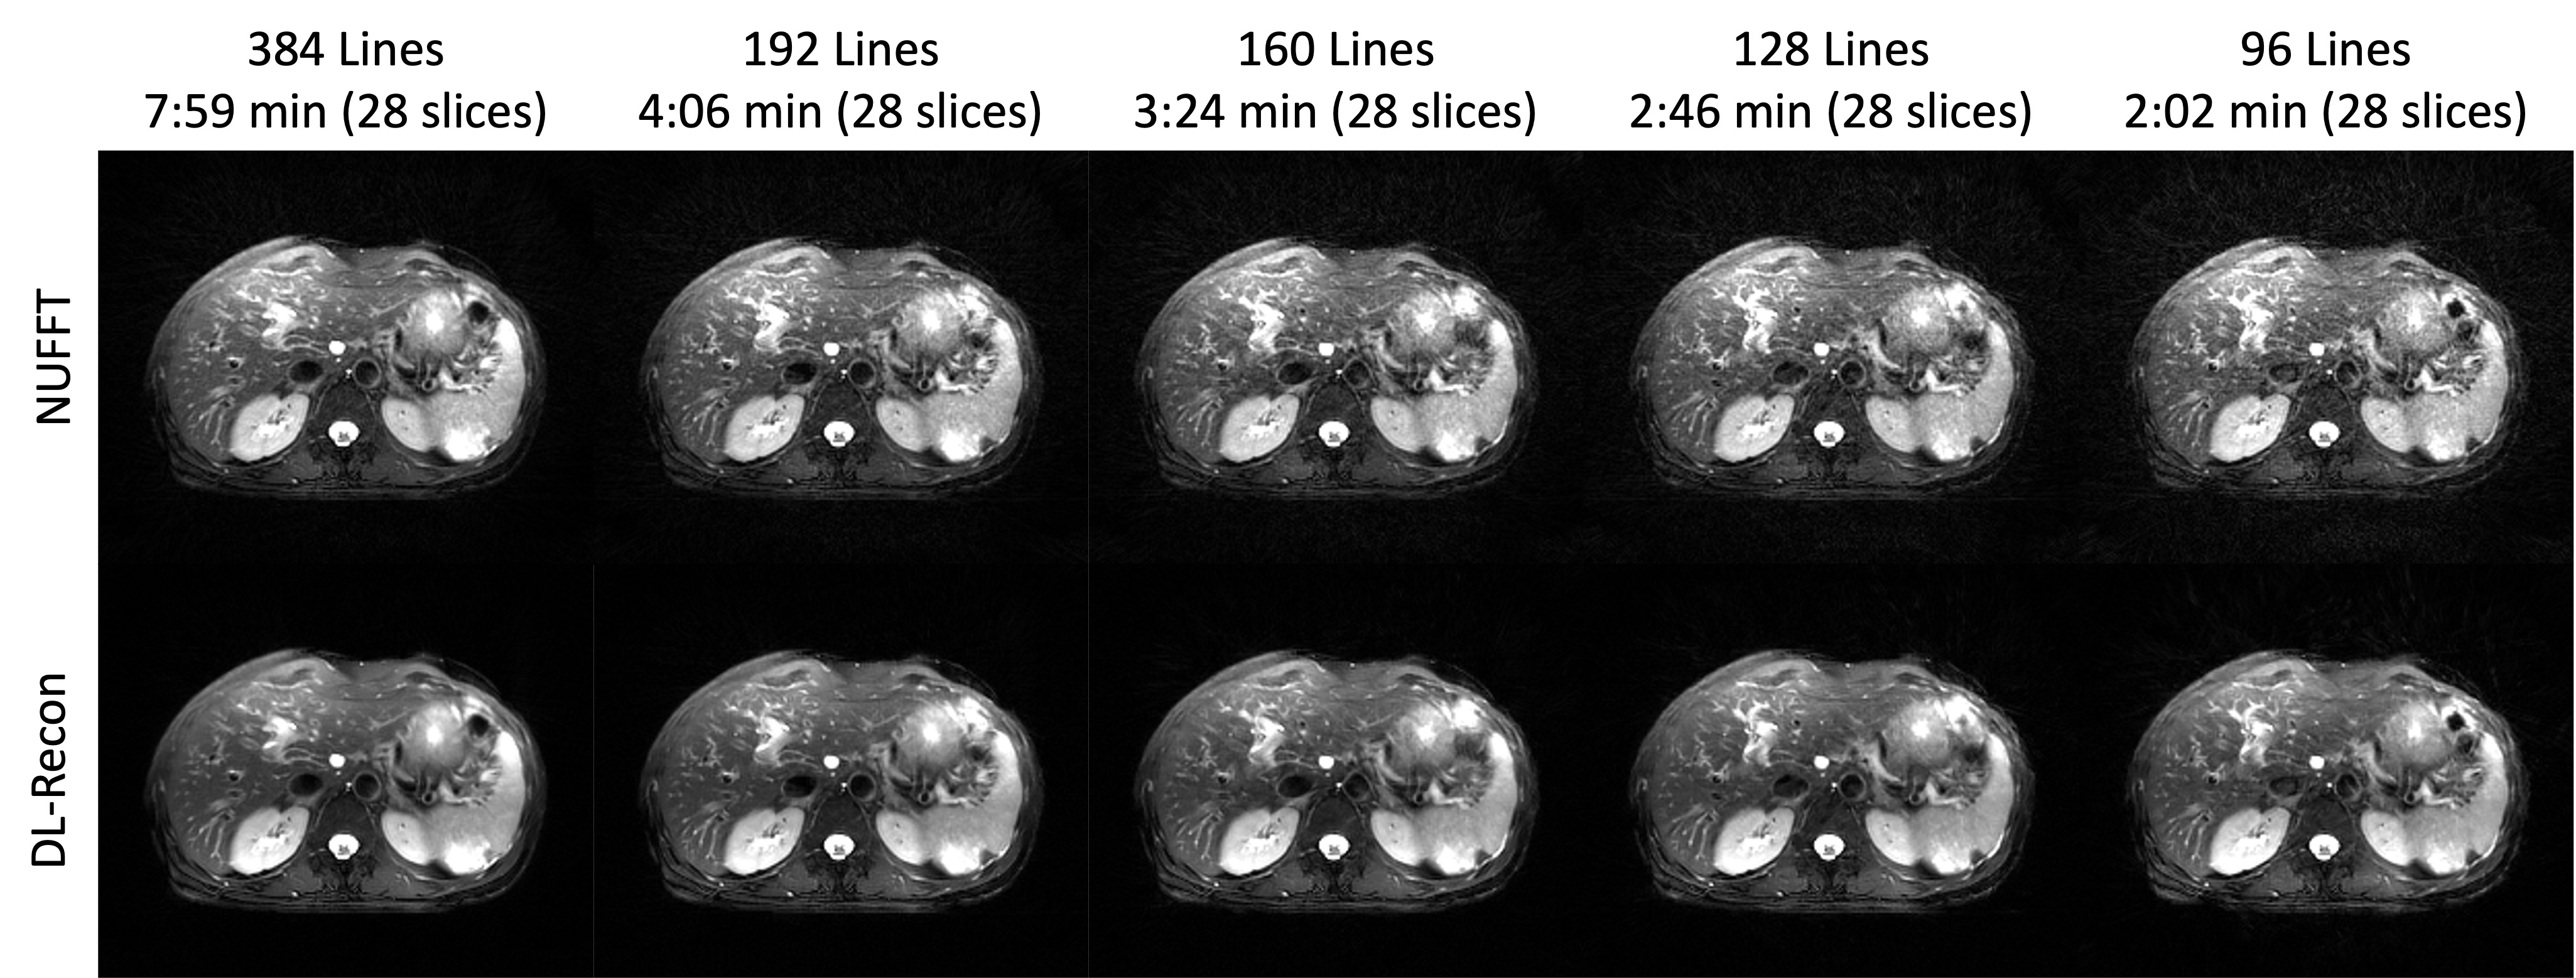
Figure 5: Qualitative results of the composite images (using data from all TEs to reconstruct a single T2 weighted image). The same subject was scanned 5 times at different under-sampling rates. We compare a simple NUFFT reconstruction (top) to the proposed DL method (bottom). The presence of under-sampling artifacts increases with less data but are suppressed with the DL method.