0725
3D Kidney Segmentation in MRI using Transformers1Antaros Medical AB, Mölndal, Sweden, 2The University of Sheffield, Sheffield, United Kingdom, 3Basel Muscle MRI, Department of Biomedical Engineering, University of Basel, Basel, Switzerland, 4University of Leeds, Leeds, United Kingdom, 5University of Exeter, Exeter, United Kingdom, 6University of Bordeaux, Bordeaux, France, 7Department of Clinical Sciences in Malmö, Lund University Diabetes Centre, Malmö, Sweden
Synopsis
Keywords: Kidney, Kidney, Segmentation, TKV, Transformers
Motivation: Convolutional Neural Networks (CNNs) have long been the go-to deep-learning architecture for medical image segmentation, but in recent years transformer-based architectures adapted from large language models are setting a new standard.
Goal(s): The aim of this study was to test if transformers are suitable for 3D kidney segmentation on high-resolution MRI.
Approach: A transformer-based deep-learning architecture (UNETR) was trained and tested against a supervised method on 82 patient datasets from the iBEAt study on diabetic kidney disease.
Results: UNETR provides fast segmentation with comparable results to the supervised method, but additional refinement is needed to reduce the limits of agreement.
Impact: Novel transformer-based architectures for medical image segmentation may be useful for fast 3D segmentation of individual kidneys.
INTRODUCTION
Convolutional Neural Networks (CNN) and U-Nets have long been the go-to architecture for segmentation of medical images1-5 but in recent years transformer-based architectures adapted from large language models are increasingly setting the standard6. In contrast to CNN’s, Transformers model long-range dependencies and thus capture more global contextual information7. They have been applied successfully for kidney segmentation on CT but have not yet been evaluated in MRI.The aim of this work is to test whether a transformer-based architecture may be a suitable approach for 3D single-kidney segmentation on T1-weighted MRI.
METHODS
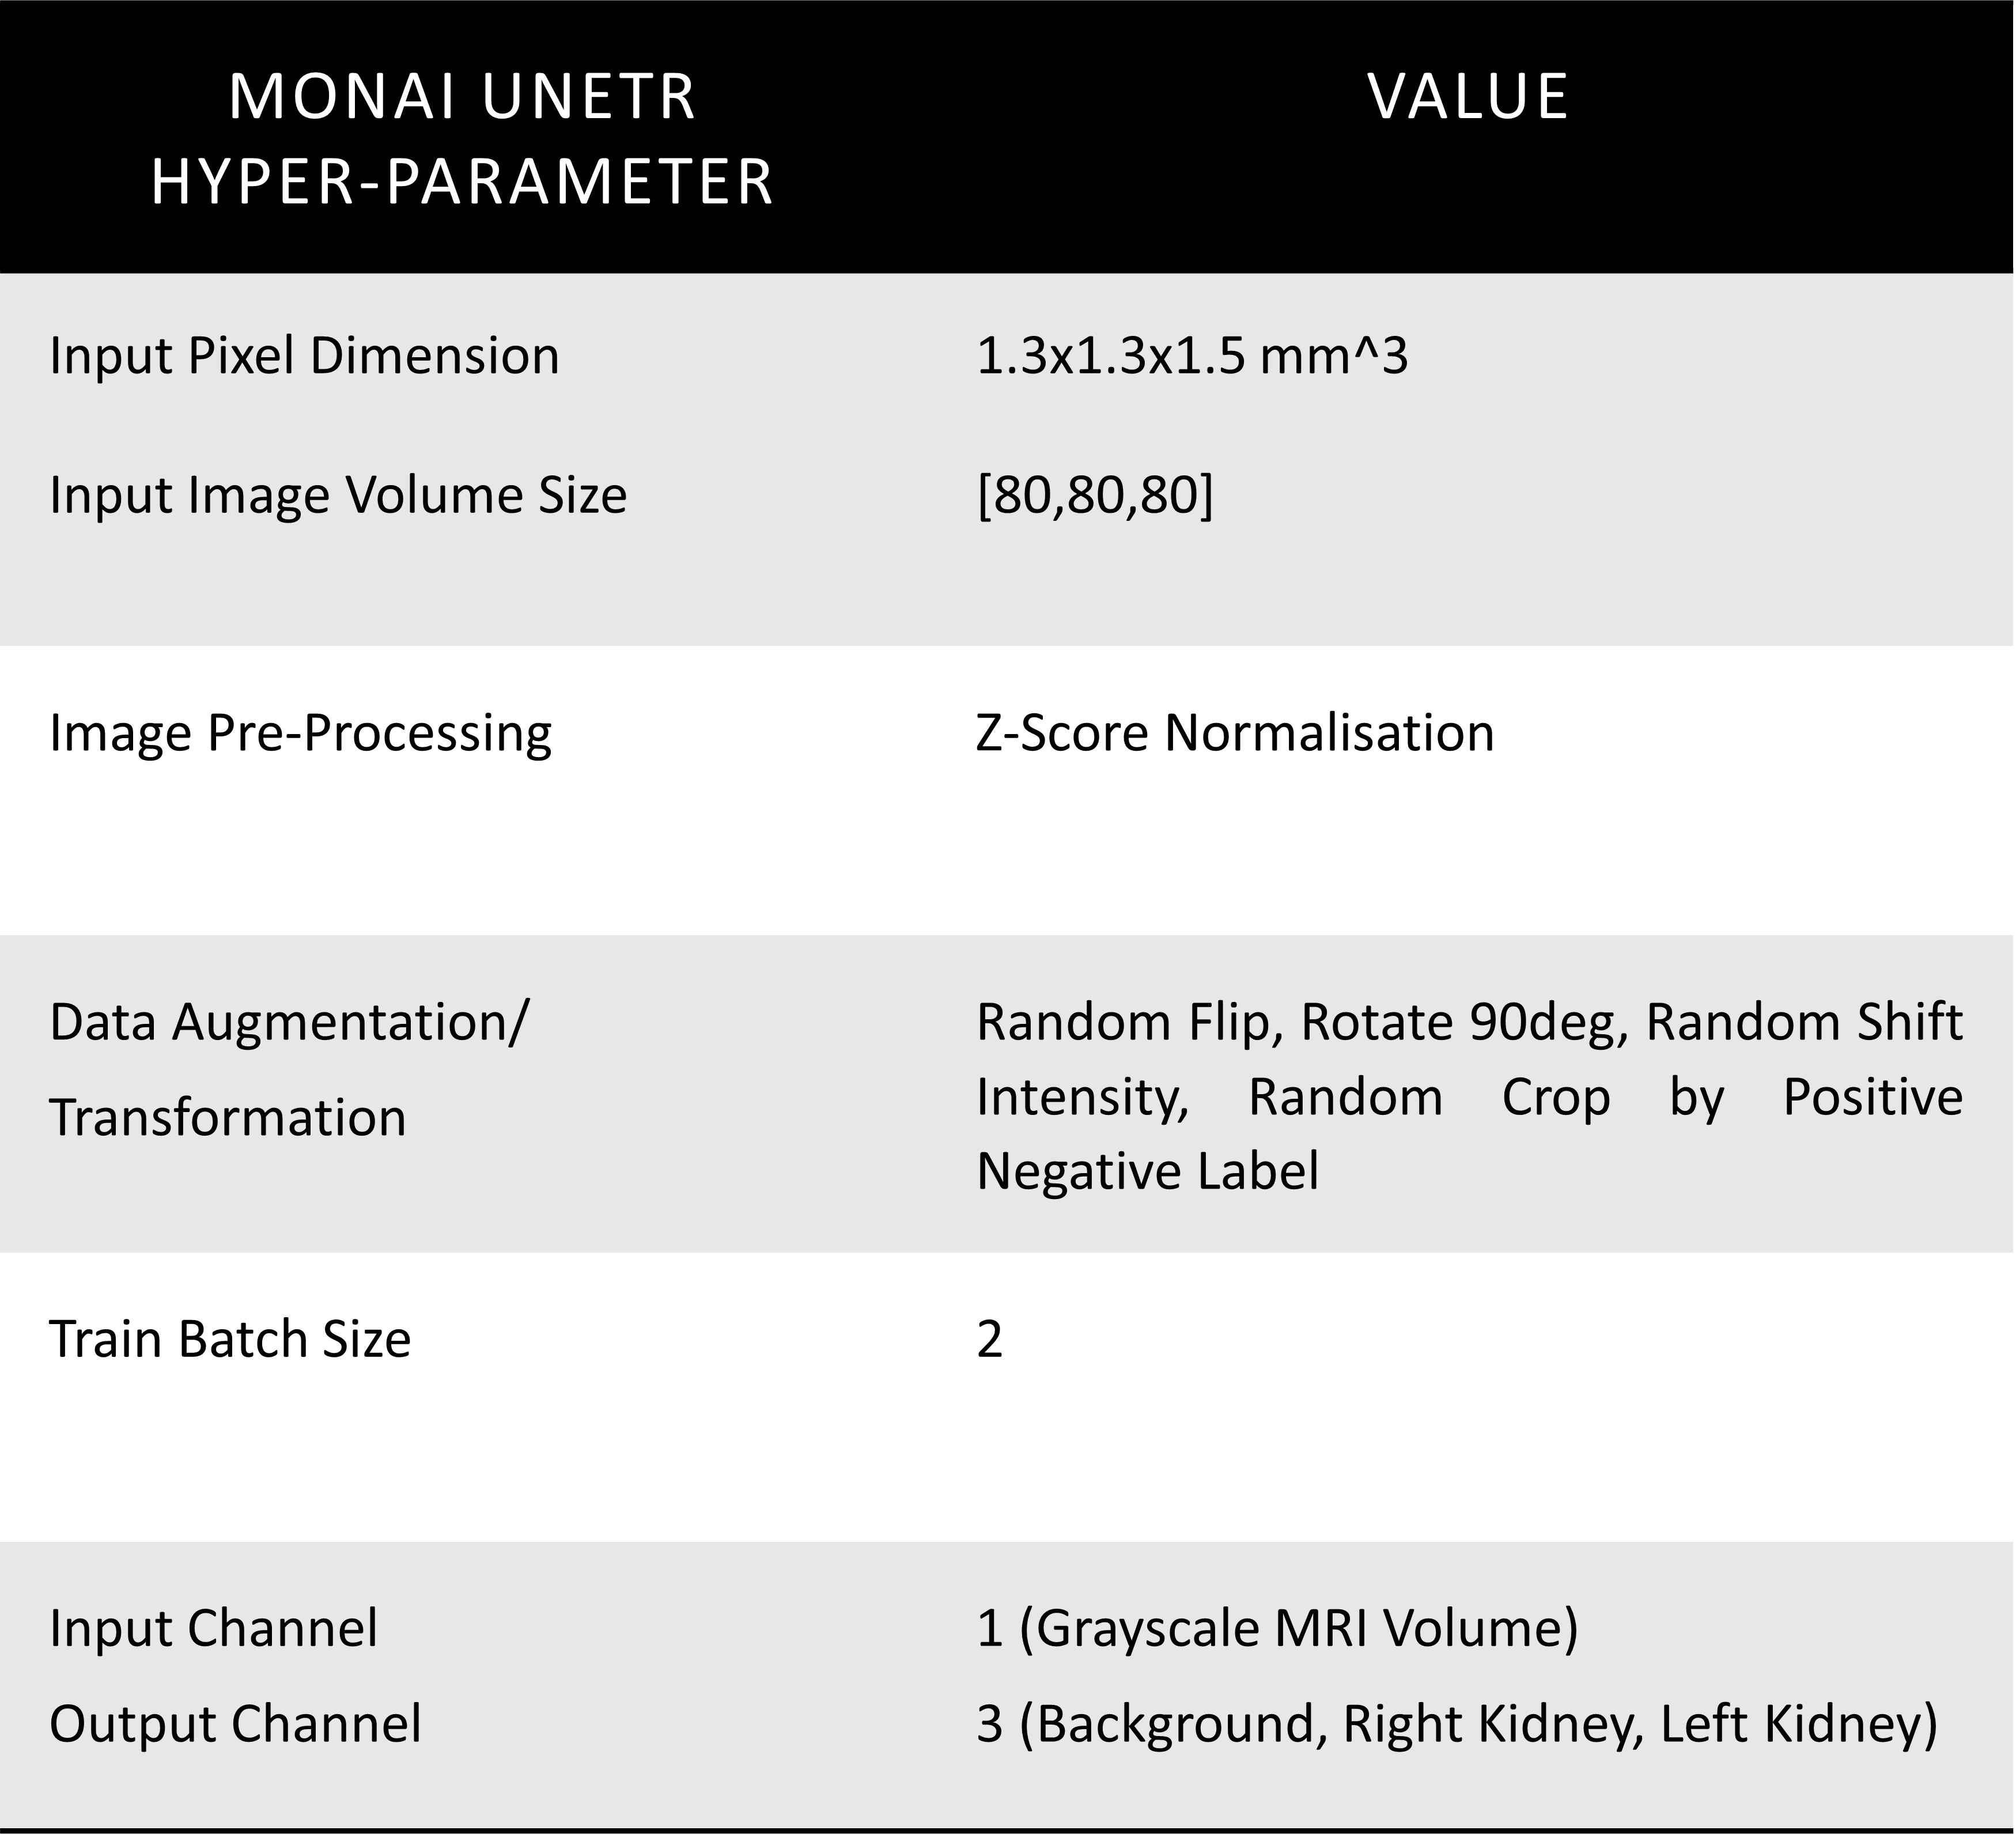
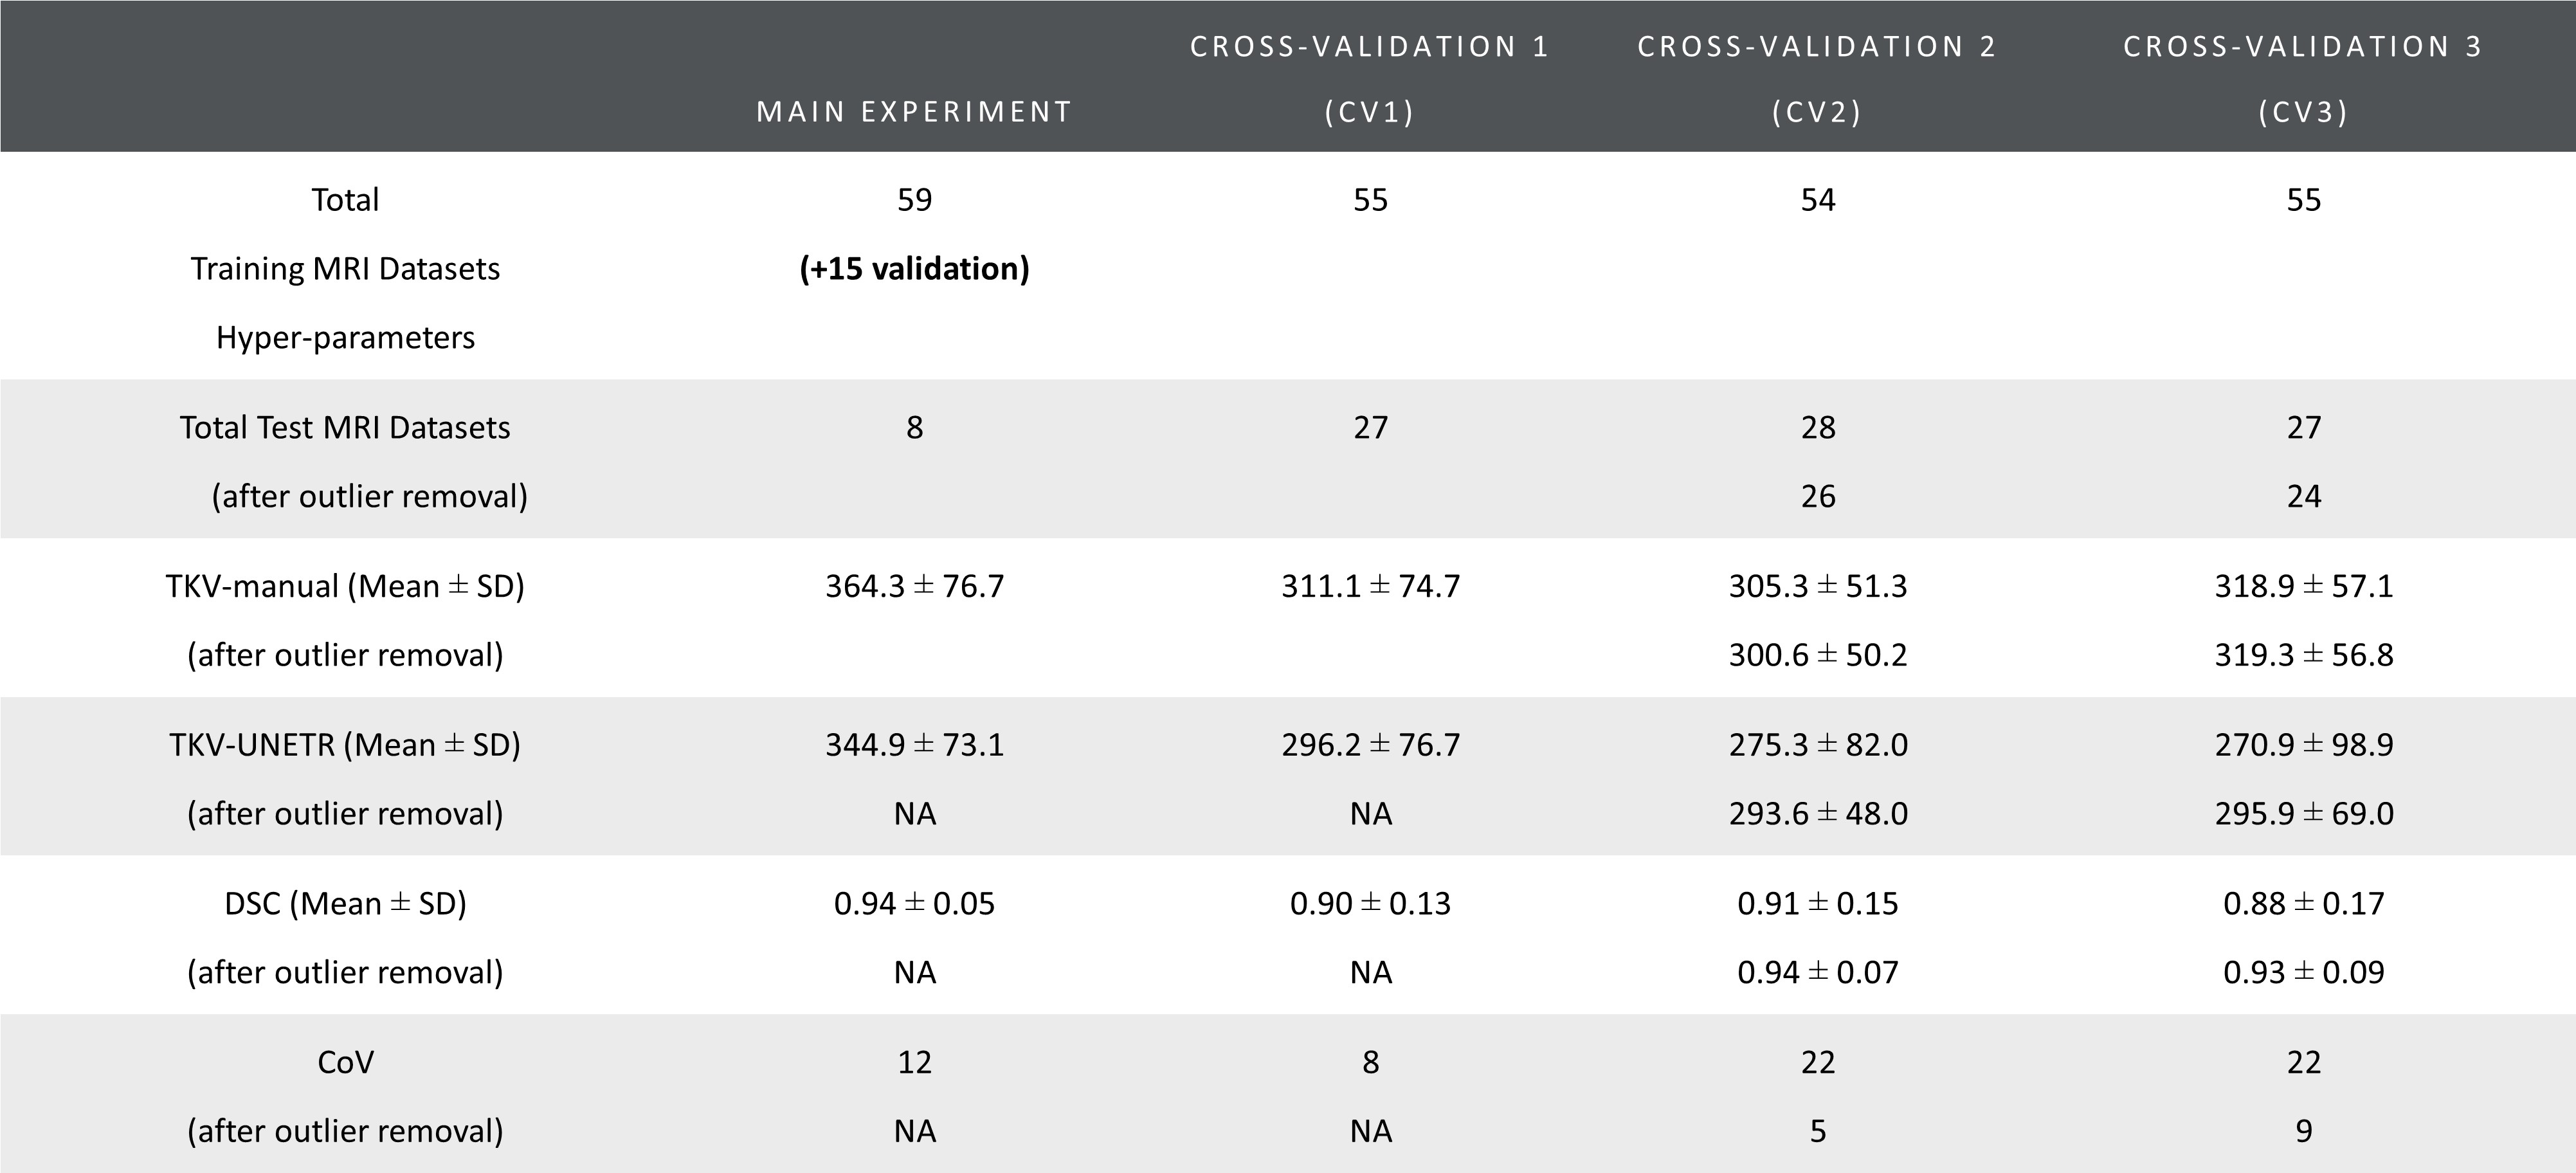
MRI Acquisition, Data Annotation: 82 patients with available and twice reviewed kidney segmentation masks were selected from the 3 sites with the same vendor in the ongoing iBEAt study (www.beat-dkd.eu/) on diabetic kidney disease (DKD)8. Multiparametric MRI was performed on a MAGNETOM Prisma 3T (Siemens Healthcare GmbH, Erlangen, Germany). Whole kidney segmentation was performed on a coronal, single breath-hold, 3D-Dixon of the abdomen (FOV: 400x400mm2; TR = 4.01ms; TE1 = 1.34ms; TE2 = 2.57ms; FA = 9deg; Slice thickness = 1.5mm; Bandwidth1 = 820Hz/Px, Bandwidth2 = 1040 Hz/Px; reconstructed voxel= 1.3x1.3x1.5mm3; parallel imaging = CAIPIRINHA, PAT=3). The Dixon was acquired 7 minutes after injection of a quarter dose of a macrocyclic contrast agent. The left and the right kidneys were outlined semi-automatically by a nephrologist, using region-growing on masks created by K-means clustering of the fat and water images. Kidney masks were reviewed by two independent staff.Training, Validation, Testing, and Cross-Validation: Segmentation was performed using the UNETR7 implementation in MONAI9 (hyperparameters in Table 1). For the main experiment, 59 datasets were used for training, 15 for validation, and 8 for testing. The training was performed on a workstation with an Intel Xeon 10-core 2.2GHz CPU and NVIDIA GeForce GTX 1080 Ti 11GB GPU, taking approximately 24 hours. Additionally, three-fold cross-validation (CV1, CV2, CV3) was performed with 2 sets utilised for training and the remaining set used for testing (Table 2).
Statistical Analyses: Total Kidney Volumes (TKV) were computed by adding up left and right kidney volumes. Dice Score Coefficient10 (DSC), Bland-Altman, Coefficient of Variation (CoV) for repeated measures11, and non-parametric Wilcoxon signed rank test for paired samples assessed the performance of the automated segmentation method. Statistical significance was defined at p<0.05.
RESULTS
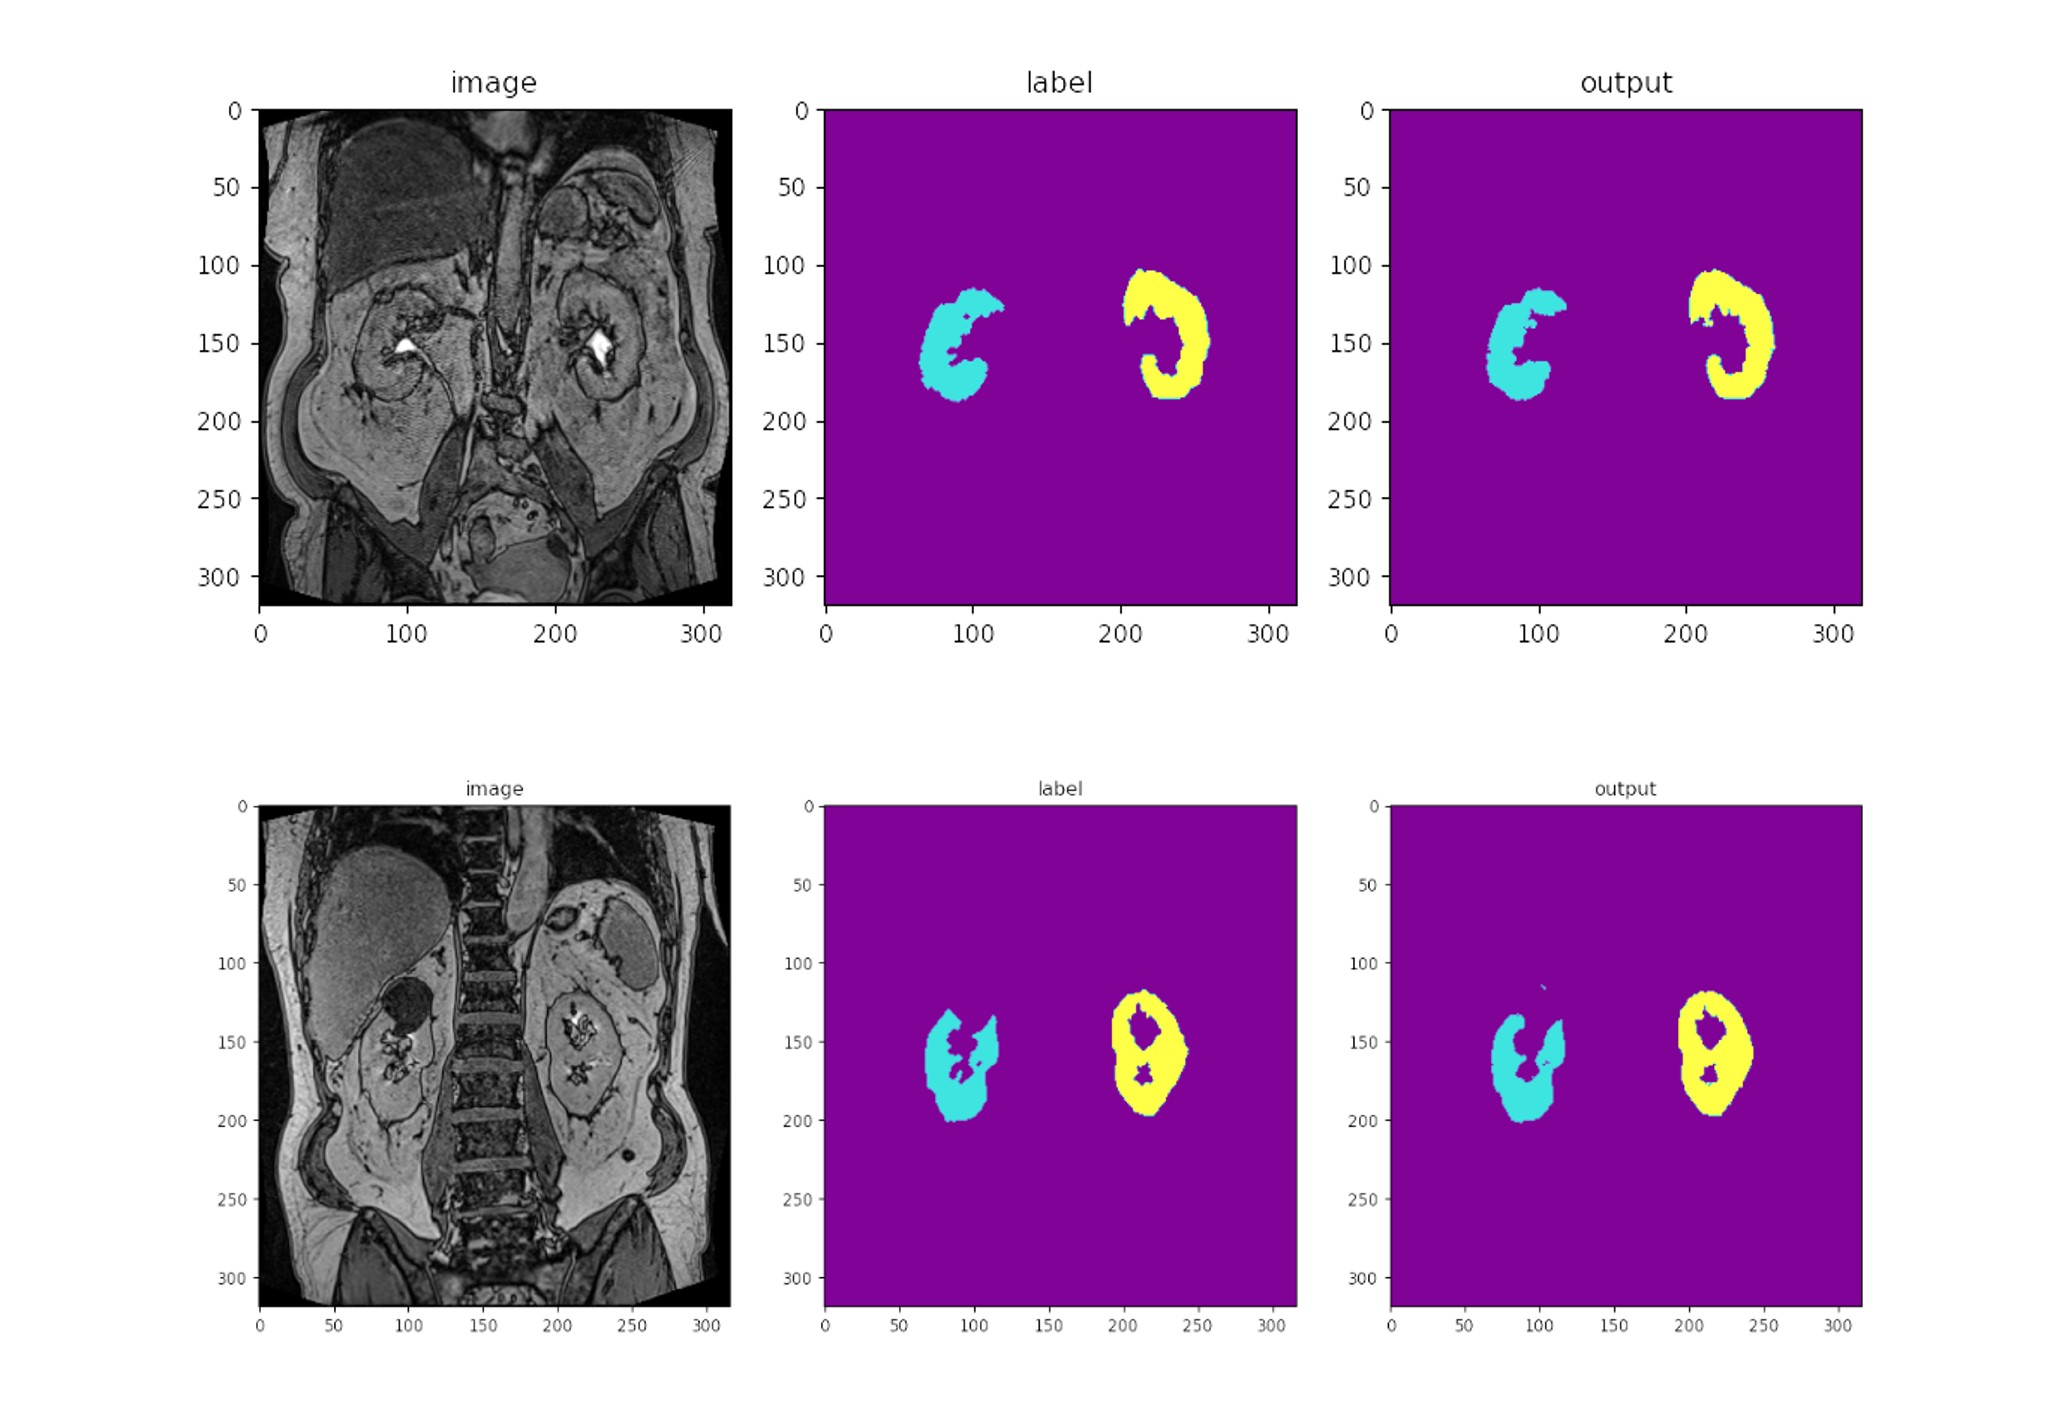
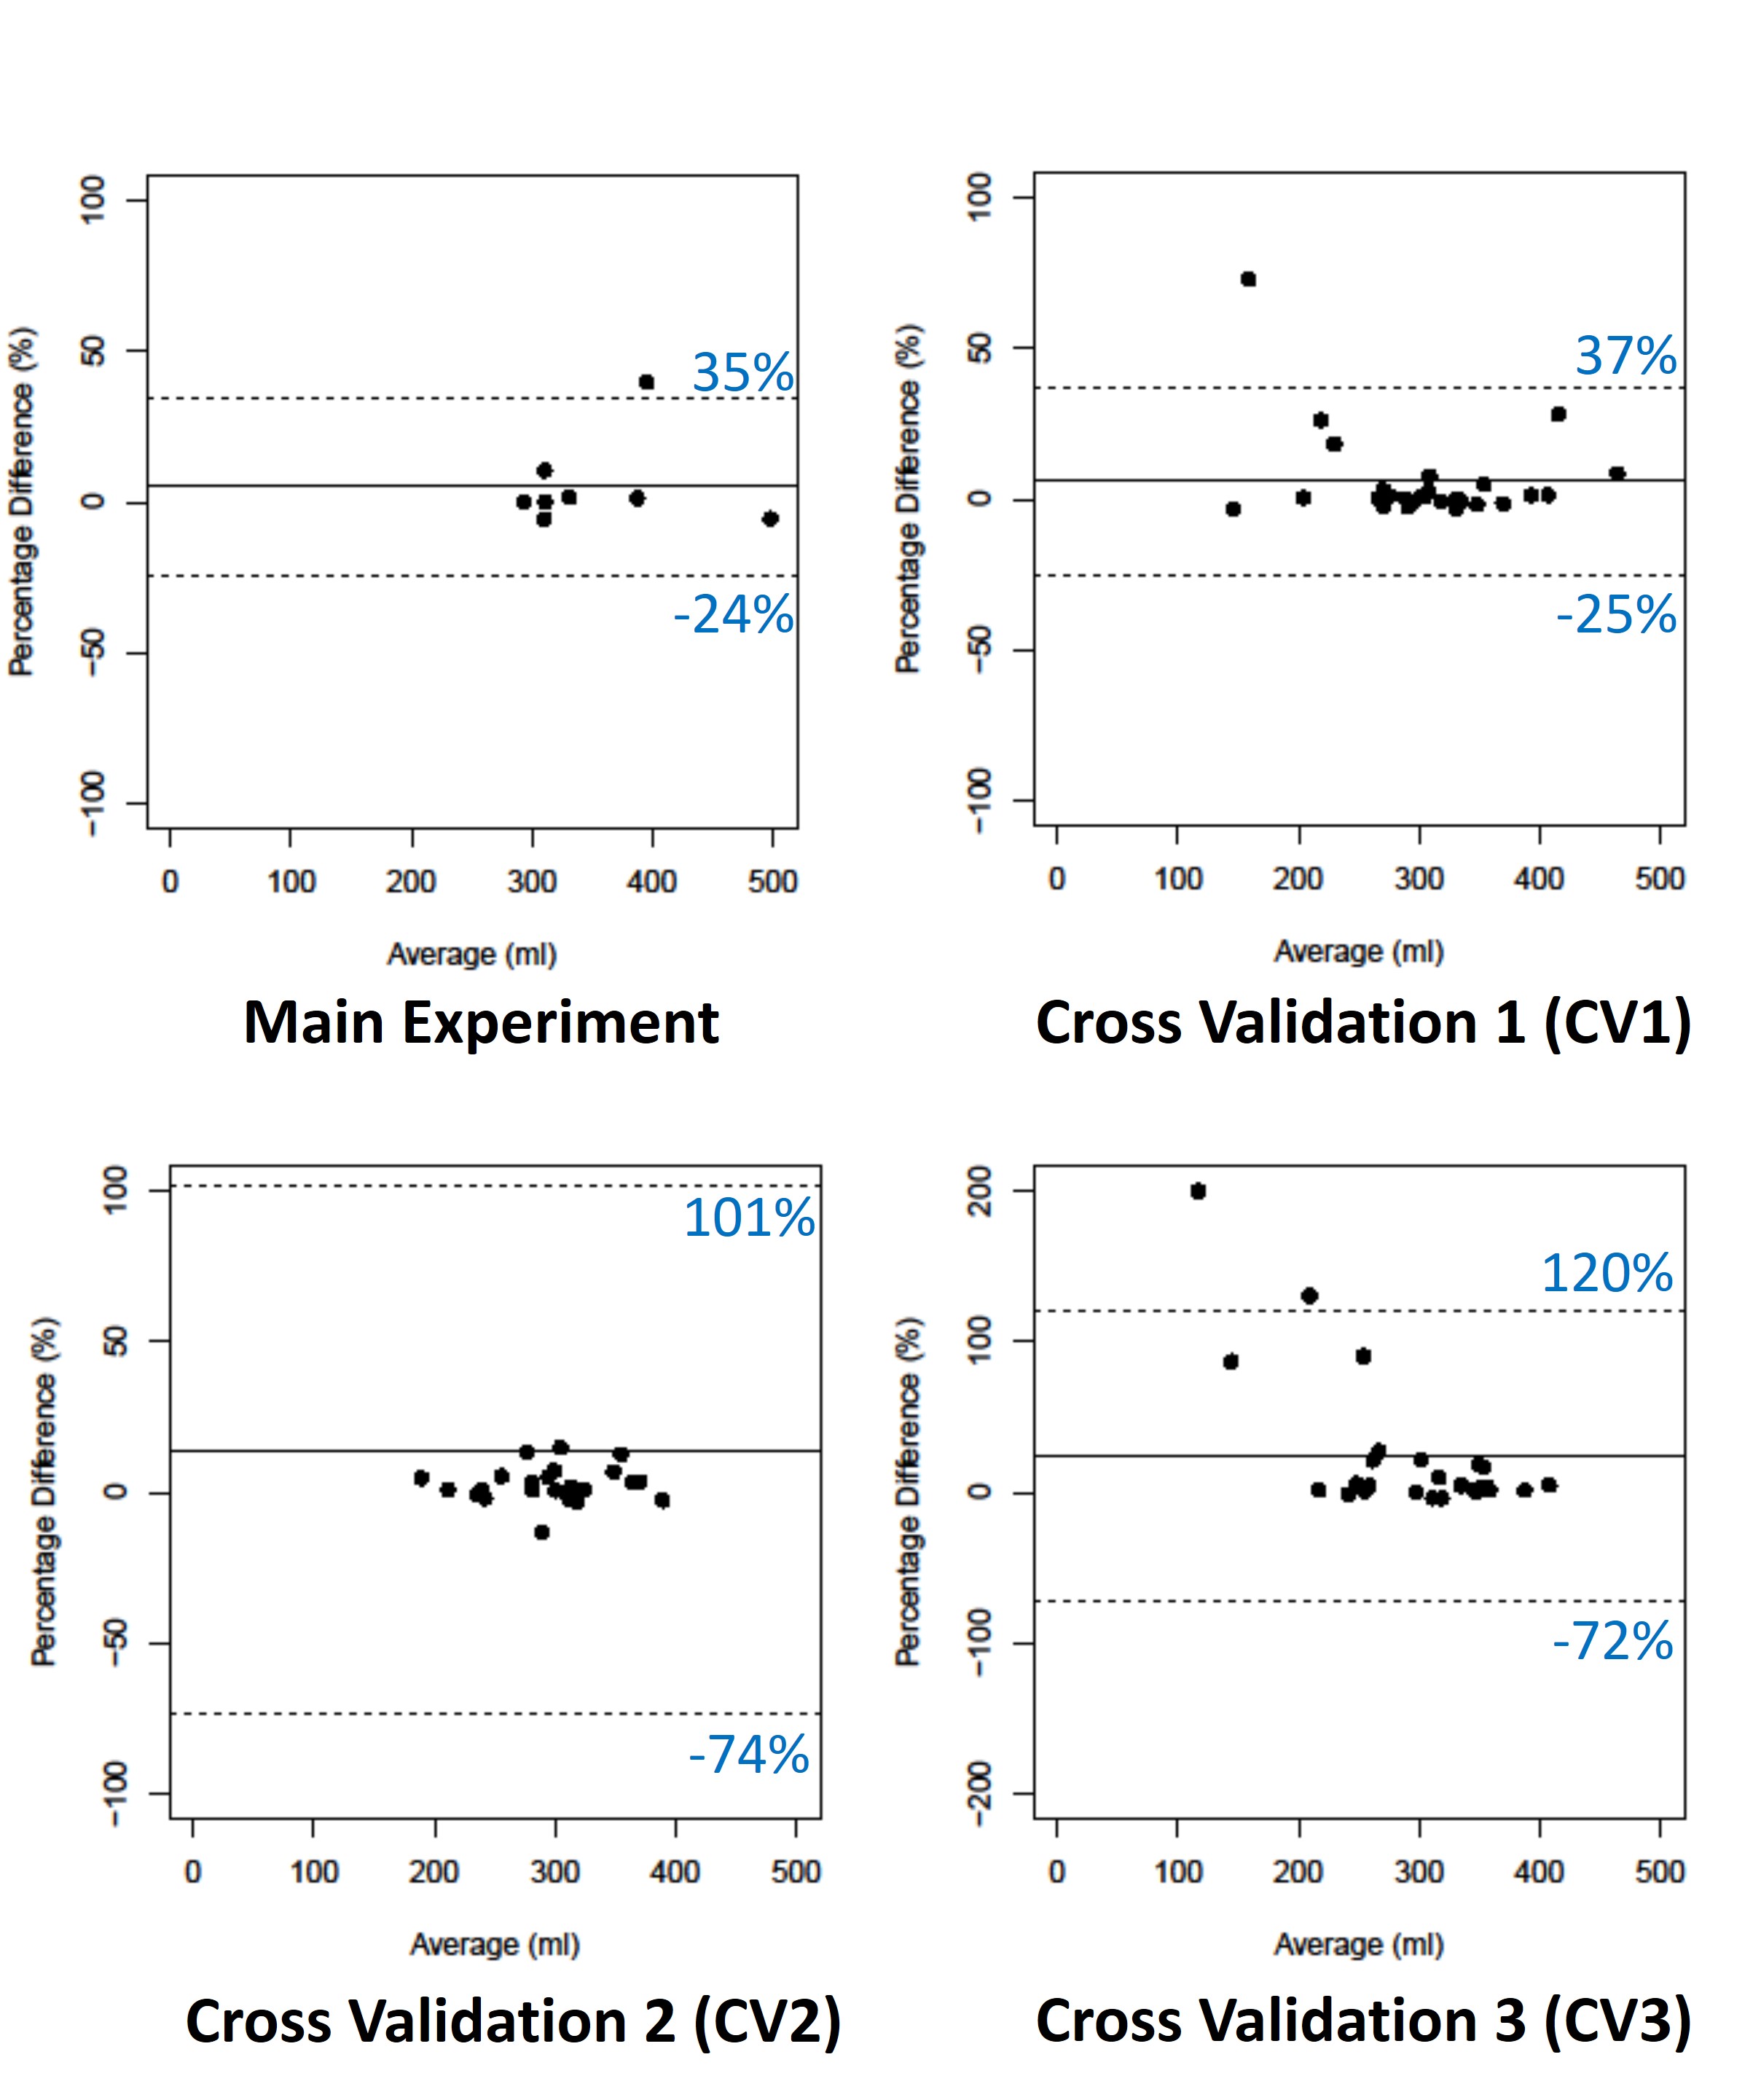
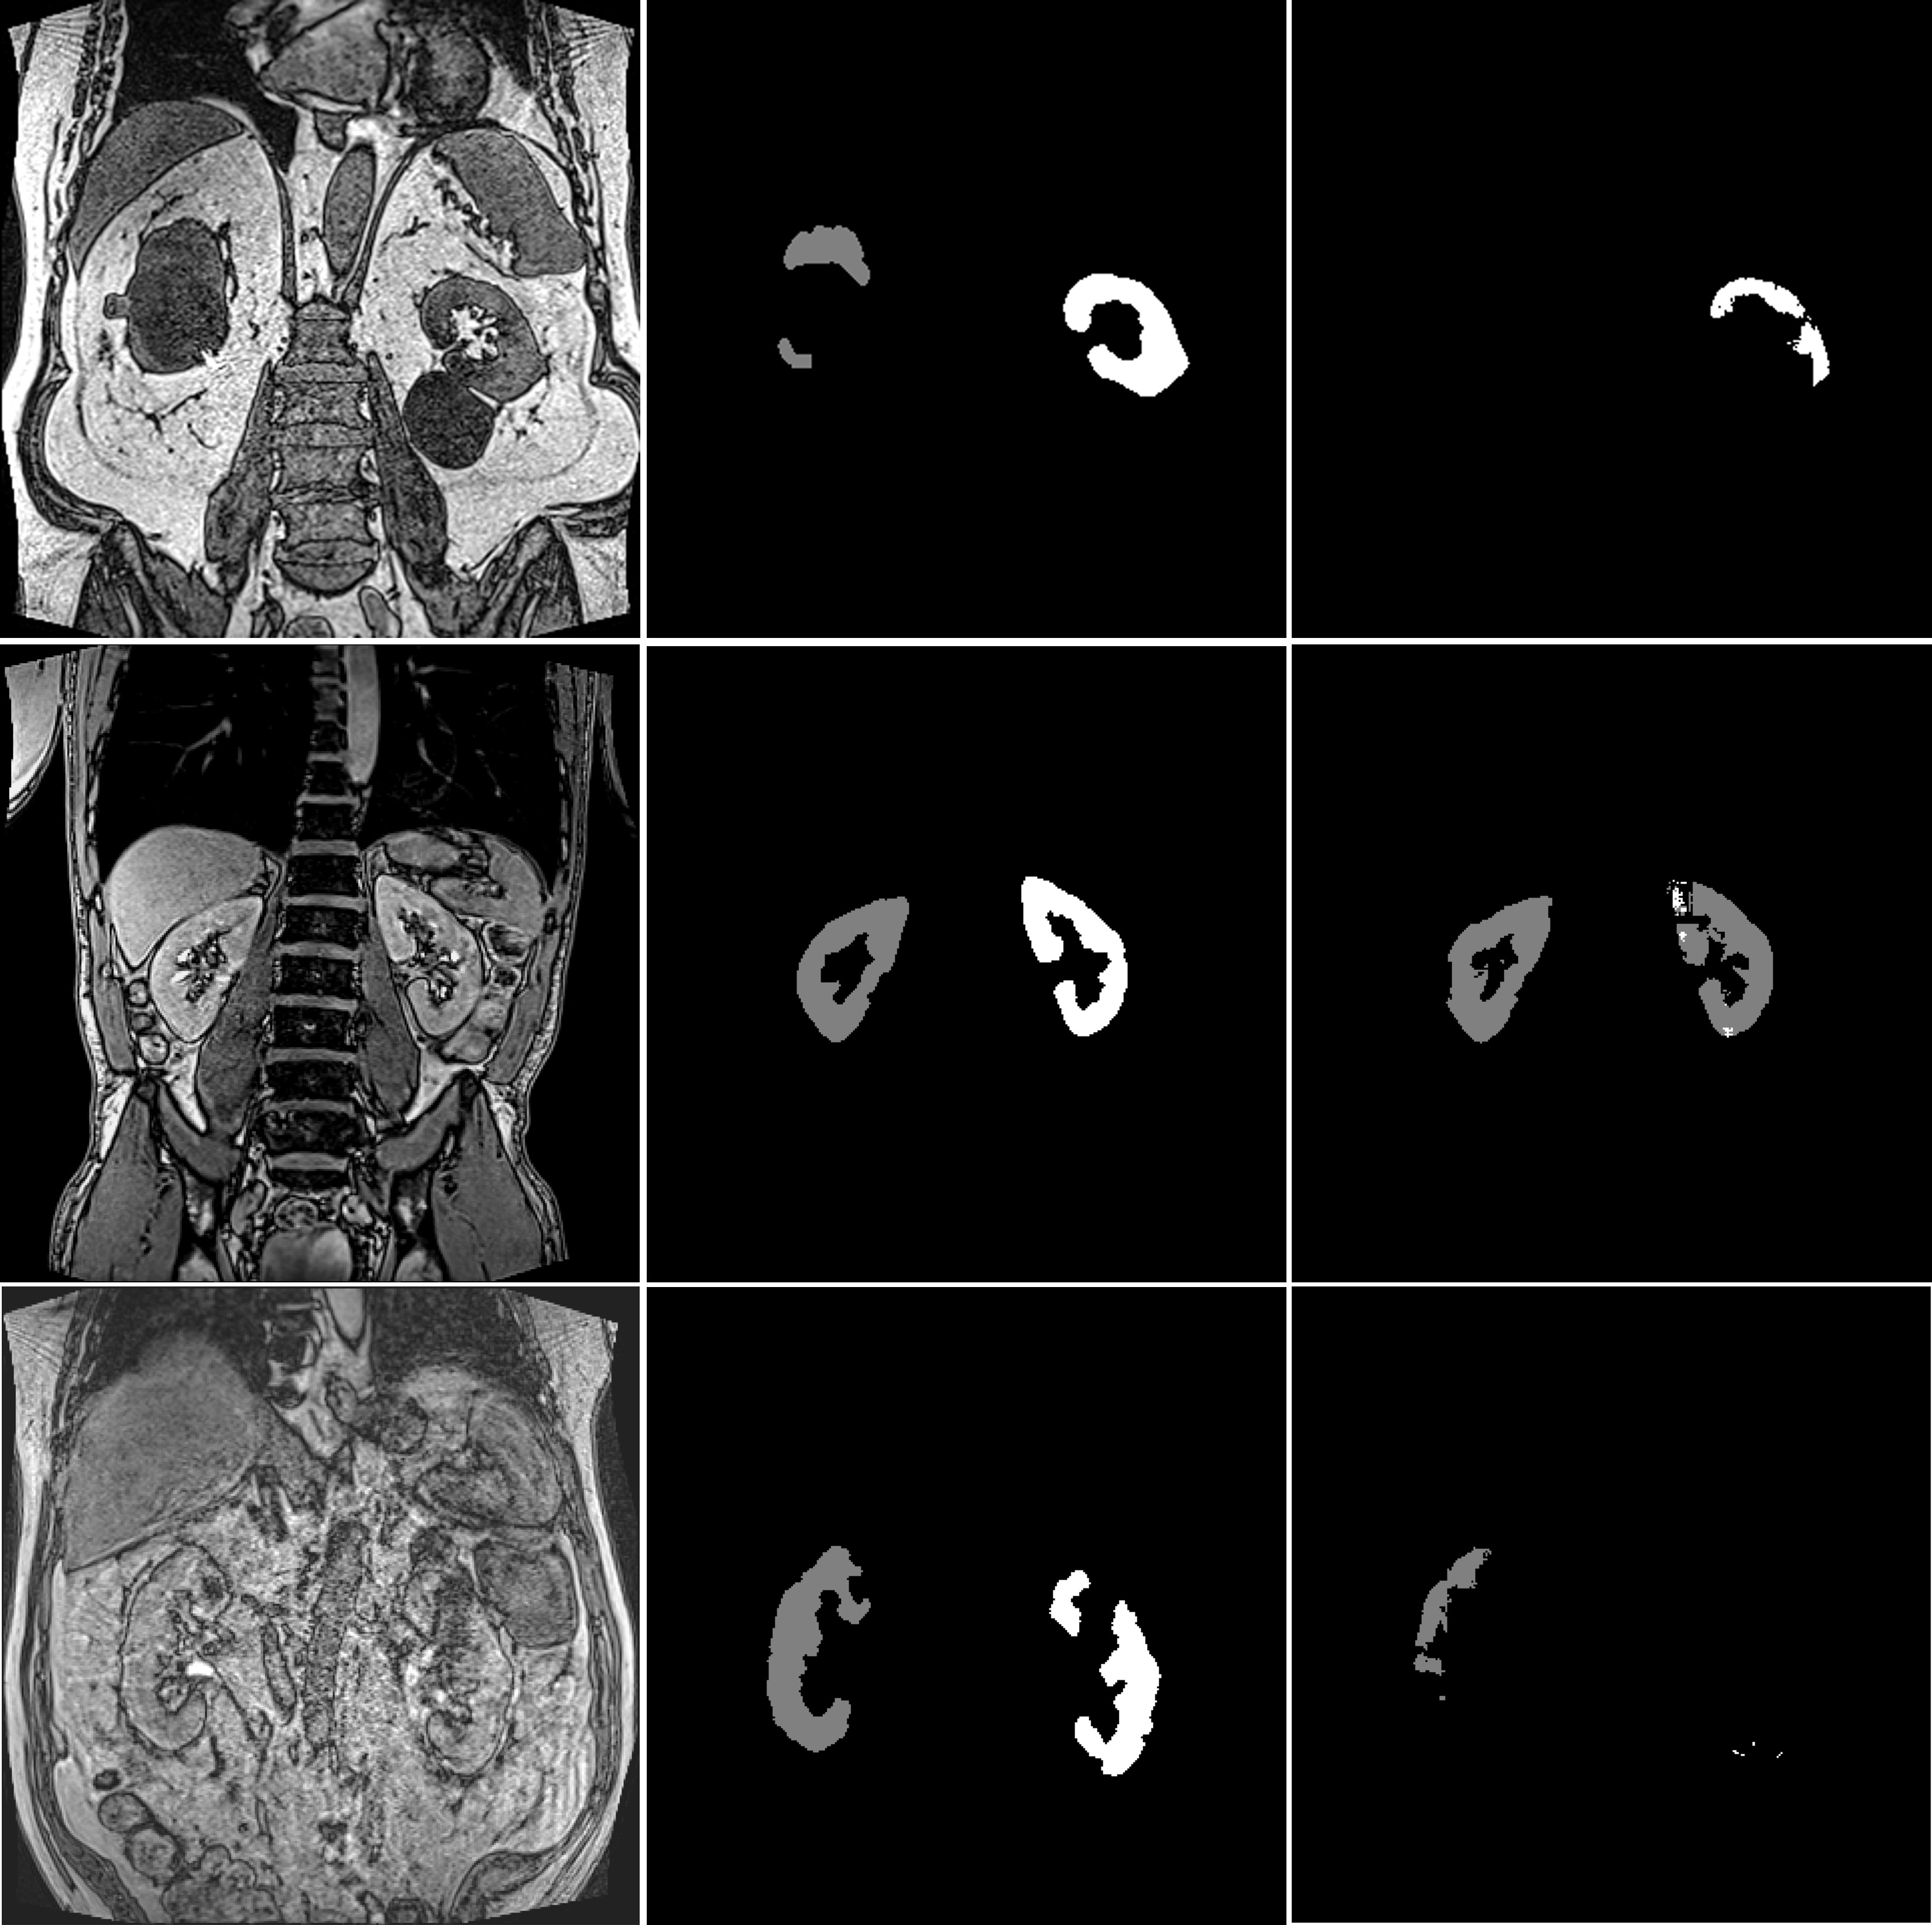
Figure 1 shows example segmentations for two cases where the automated results are considered successful.Table 2 summarises DSC, TKV and CoV for all experiments. DSC ranged from 0.88 to 0.94 and CoV between supervised and automated TKV ranged from 8% to 22%. The lower limit of agreement (LoA) ranged from -74% to −24% and the upper LoA from +35% to +120% (Figure 2). The mean difference was significant for CV2 (p=0.01) and CV3 (p<0.001) but not for the main experiment (p=0.38) and CV1 (p=0.09).
Closer inspection of the outliers suggests that issues with automated segmentation were largely due to one of four causes (Figure 3): (1) gross morphological differences from a typical kidney due to large cysts; (2) pre-contrast Dixon with lower kidney/fat separation contrast; (3) lean participants with minimal levels of perirenal fat; (4) poor image quality due to breathing artefacts in the breath hold sequence.
To estimate the impact of these issues, key metrics were recalculated after excluding such cases. This improved DSC slightly to 0.90-0.94, CoV improves to the range [5%, 12%], lower LoA improved to the range [–28%, -9%] and upper LoA to the range [+14%, +48%]. The difference with supervised segmentation in CV2 (p=0.03) and CV3 (p<0.001) remained significant.
DISCUSSION
In most cases, UNETR generates promising single-kidney segmentation results in an automated fashion, with results for the key biomarker TKV that are close to those derived from supervised segmentation.Substantial segmentation errors were identified in a smaller number of cases with characteristics that were atypical of the general training population. This indicates the need for either retraining the model in a more representative training set, and/or complementing the automated segmentation with additional post-processing and automated quality control (QC) steps to identify and exclude unreliable results.
However, the results also show that even after excluding the extreme outliers, the limits of agreement remain large compared to typical volumetric changes expected over time in a disease such as DKD. Future studies will investigate whether the results can be improved further by extending the training set.
CONCLUSION
Transformer-based architectures are a promising alternative approach for segmentation of individual kidneys on high-resolution T1-weighted MRI. However, careful further analysis, finetuning and post-processing is needed to better understand and reduce the difference with supervised results.Acknowledgements
This project has received funding from the Innovative Medicines Initiative 2 Joint Undertaking under grant agreement No 115974. The JU receives support from the European Union’s Horizon 2020 research and innovation programme and EFPIA and JDRF.
Any dissemination of results reflects only the author's view; the JU is not responsible for any use that may be made of the information it contains.
References
- Daniel, Alexander J., et al. "Automated renal segmentation in healthy and chronic kidney disease subjects using a convolutional neural network." Magnetic resonance in medicine 86.2 (2021): 1125-1136.
- Klepaczko, Artur, et al. "Whole kidney and renal cortex segmentation in contrast-enhanced MRI using a joint classification and segmentation convolutional neural network." Biocybernetics and Biomedical Engineering 42.1 (2022): 295-311.
- Inoue, Kaiji, et al. "The utility of automatic segmentation of kidney MRI in chronic kidney disease using a 3D convolutional neural network." Scientific Reports 13.1 (2023): 17361.
- Rombolotti, Maria, et al. "Automatic cyst and kidney segmentation in autosomal dominant polycystic kidney disease: Comparison of U-Net based methods." Computers in Biology and Medicine 146 (2022): 105431.
- Taylor, Jonathan, et al. "An Artificial Intelligence generated Automated Algorithm to measure Total Kidney Volume in ADPKD." Kidney International Reports.
- Zhao, Dan, et al. "Current progress in artificial intelligence-assisted medical image analysis for chronic kidney disease: A literature review." Computational and Structural Biotechnology Journal (2023).
- Hatamizadeh, Ali, et al. "Unetr: Transformers for 3d medical image segmentation." Proceedings of the IEEE/CVF winter conference on applications of computer vision. 2022.
- Gooding, Kim M., et al. "Prognostic imaging biomarkers for diabetic kidney disease (iBEAt): study protocol." BMC nephrology 21 (2020): 1-11.
- Cardoso, M. Jorge, et al. "Monai: An open-source framework for deep learning in healthcare." arXiv preprint arXiv:2211.02701 (2022).
- Dice, L. R. Measures of the amount of ecologic association between species. Ecology 26, 297–302, doi:10.2307/1932409 (1945).
- Jones, R. G. & Payne, R. B. Clinical investigation and statistics in laboratory medicine (American Association for Clinical Chemistry, 1997).
Figures