0719
Disease Classification of 129Xe Ventilation MRI using Artificial Intelligence1Pulmonary Medicine, Cincinnati Children's Hopsital, Cincinnati, OH, United States, 2Pulmonary Medicine, Cincinnati Children's Hospital, Cincinnati, OH, United States, 3Pulmonary, Critical Care and Sleep Medicine, University of Cincinnati, Cincinnati, OH, United States
Synopsis
Keywords: Lung, Hyperpolarized MR (Gas)
Motivation: Xenon ventilation MRI shows distinct defect patterns that appear disease-specific but are difficult to measure. Deep learning, via neural networks, can generate texture features to classify images. Image classification has applications in diagnostics, phenotyping and predicting outcomes.
Goal(s): To determine if neural networks could determine disease classification from xenon MRI.
Approach: 2D neural networks were trained on data from eight disease states (including healthy controls) and assessed on top-1, top-3 accuracy and recall.
Results: The top performing network had a 54% top-1 and 86% top-3 accuracy.
Impact: Artificial intelligence can classify disease from xenon MRI alone with moderate accuracy and differentiate between similar conditions. In the future, deep learning could be used diagnostically, for phenotyping disease subgroups and predicting outcomes.
Purpose
129Xe MRI can characterize pulmonary disease by measuring ventilation defects related to pathology such as airway obstruction and tissue degradation.1 Ventilation imaging shows visually distinct spatial patterns like wedge-shaped defects2 and heterogeneity3 but the primary measurement, ventilation defect percent, does not account for such patterns. Machine-learning studies have shown that spatial information in pulmonary texture features are related to mortality and health outcomes,4, 5 suggesting that image texture has diagnostic or predictive value. Neural networks also harness texture features but learn optimized features from training data. In this proof-of-concept investigation, we determined if artificial intelligence trained on 129Xe ventilation images could classify disease from ventilation images alone.Methods
Participants and Image Acquisition: Data were retrospectively pooled from IRB-approved protocols where participants provided written, informed consent/assent to 129Xe MRI. Participants were divided based on health status: healthy control, asthma, receiving bone marrow transplant [BMT], broncho-pulmonary dysplasia (BPD), cystic fibrosis (CF), lymphangioleiomyomatosis (LAM), other interstitial lung diseases (ILDs), and systemic juvenile idiopathic arthritis (SJIA). MRI were acquired on a 3.0T Philips Achieva or Ingenia scanner (Philips Healthcare) with a custom RF coil or a flexible vest coil (Clinical MR Solutions) and a 2D axial cartesian sequence. Gas hyperpolarization was performed on either a Polarean 9810 or 9820 hyperpolarizer (Polarean). 129Xe MRI was acquired during breath-hold of 1/6th total lung capacity of 129Xe inhaled from functional residual capacity.Data Processing: A summary of data processing and analysis is provided in Figure 1. A custom Keras data generator performed augmentation and loading. Transforms were applied randomly with limits: 10px x/y-translation, 20% scaling, 0.5rad rotation, x-axis flipping, gaussian noise (20%), and gaussian-smoothed (intensity=300, deviation=15) image warping. Following augmentation, images were normalized on the range [0,1]. Data were split into 5-fold training, validation, and testing sets (70/10/20%).
Network: Neural networks were written in Python 3.10 using Tensorflow and Keras 2.10 using established architectures (alexNet, GoogleNet, VGG16, ResNet50, and ResNet50V2) with a final eight element dense layer with softmax activation. Adam optimization (learning rate=10-4) was used for gradient updates. Training loss was evaluated by categorical cross-entropy and weighted by class size. Training was performed on a Linux workstation with an RTX-A5000 GPU (Nvidia, Santa Clara CA).
Statistical Analysis: Performance was reported by top-1 accuracy (correct classification was the most probable output), top-3 accuracy (correct classification was one of the top-3 outputs), categorical cross-entropy (label-output similarity) and recall (true positives normalized to class size).
Results
Images from 307 participants were included for training, testing and validation. Training was performed for 200 epochs. Table 1 shows classification metrics for the five classification architectures, with ResNetV2 performing best across metrics with 54% top-1 accuracy and 86% top-3 accuracy. Figure 2 shows sample output from the network (using ResNet50V2), with the top prediction overlaid on the image. For each prediction, a pie chart shows the relative probability for each class according to the network. Table 2 shows classification performance separated by health status. Figure 3 shows a confusion matrix for ResNetV2, showing common misclassifications.Discussion
Neural networks were able to successfully classify diseases from ventilation images. Overall accuracy was reduced (54%) but LAM(75%) and BMT(71%) were more accurate, possibly due to the overrepresentation of these conditions in the dataset. Misidentified images may reflect underlying pathology. The BMT group included diverse etiologies, which may have contributed to the network frequently assigning a BMT label. For instance, both asthma and BMT complications include incomplete airway obstruction and hypoventilated regions. Diffuse cysts in LAM created a unique polka-dot appearance that may have helped LAM accuracy. The ILD category was frequently misclassified as LAM, which may make sense given LAM is a specific type of ILD. Due to the limited number of available images, 3D volumes were split into slices. This improved training availability at the cost of accuracy due to the heterogeneous nature of disease. For instance, 21% of SJIA slices were classified as control, possibly due to a lack of hypoventilation or pathology in these slices.Conclusions
We demonstrated that artificial intelligence could classify disease status based on ventilation patterns in the lung. Misclassifications occurred when conditions had similar obstructive or restrictive patterns or lacked abnormalities, suggesting the network was learning features reflecting pathology. This suggests that artificial intelligence could be useful beyond simple disease classification for applications like identifying disease subtypes and predicting clinical outcomes.Acknowledgements
No acknowledgement found.References
1. Gefter WB et al. Radiology. 2021.
2. Safavi S et al. RespirMed. 2021.
3. Salerno M et al. EurJRadiol. 2001.
4. Sharma M et al. COPD. 2023.
5. Moll M et al. Chest. 2020.
Figures
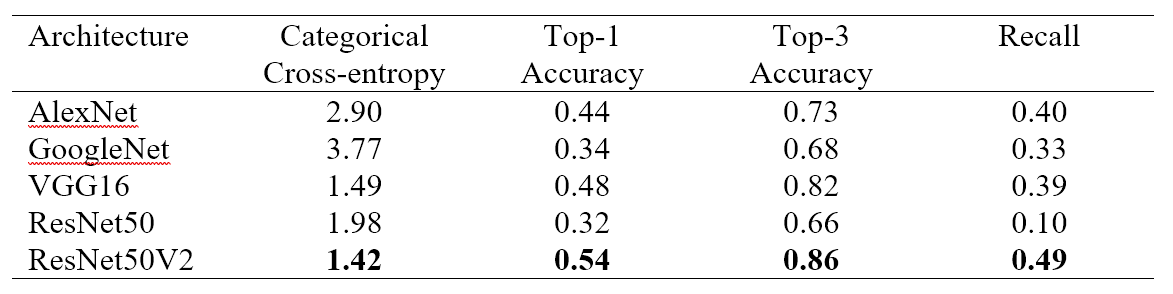
Table 1: Network performance of different classification architectures
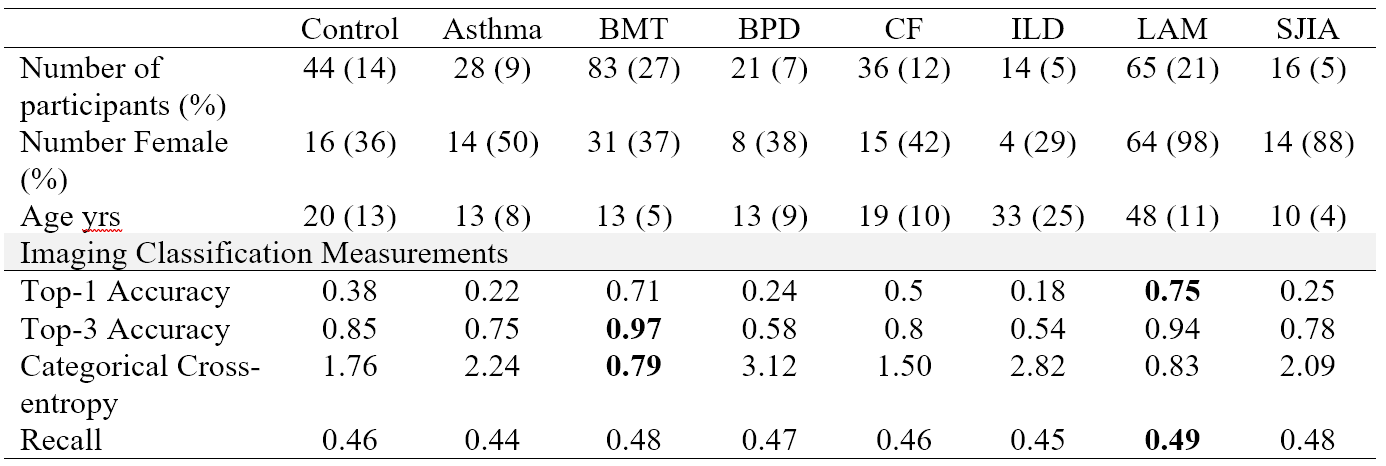
Table 2: Summary of participant demographics and disease-specific classification results for top performing architecture (ResNet50V2)
BMT=bone marrow transplant, BPD=bronchopulmonary dysplasia, CF=cystic fibrosis, ILD=interstitial lung disease, LAM=Lymphangioleiomyomatosis, SJIA= systemic juvenile idiopathic arthritis
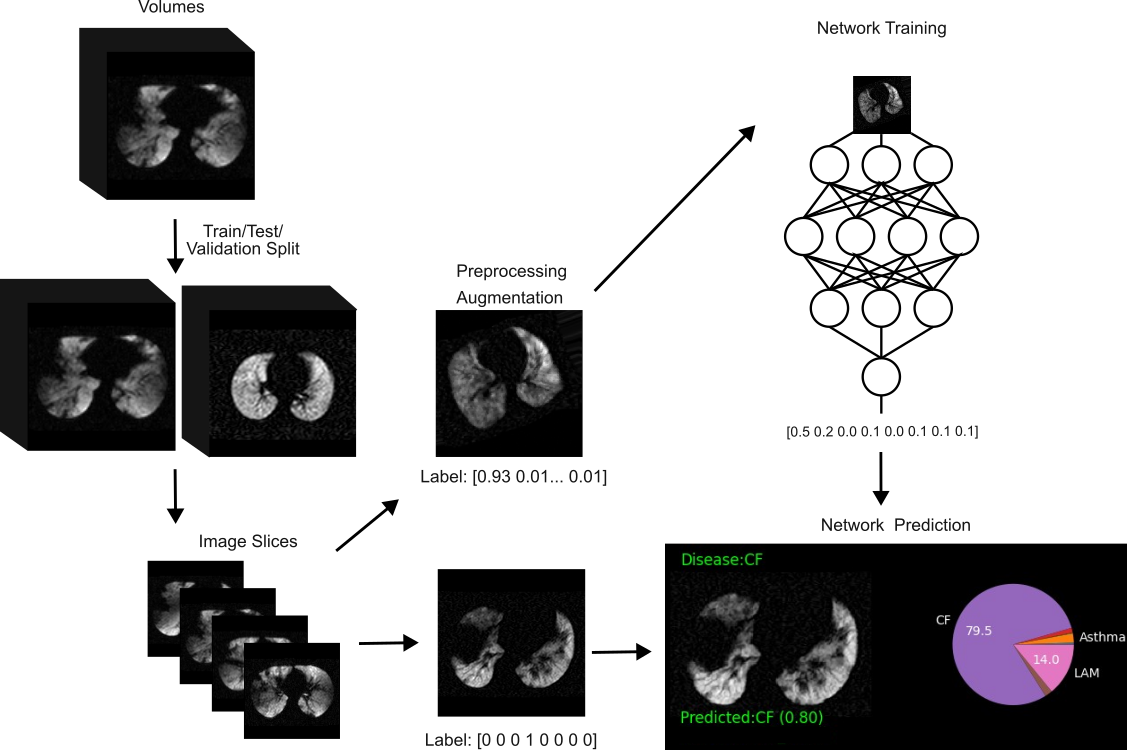
Figure 1: Neural network training and testing procedure
Training data included 3D image volumes from 307 participants in eight classes. Data were split into training/validation/testing in a 70/10/20% ratio. Volumes were split into axial slices to increase the number of samples for training. Testing data were augmented by affine and deformable transformations with a soft-labeling scheme. Data were passed to predefined network architectures and a predicted class was assigned based on the label with the highest probability. Performance was evaluated on testing data.
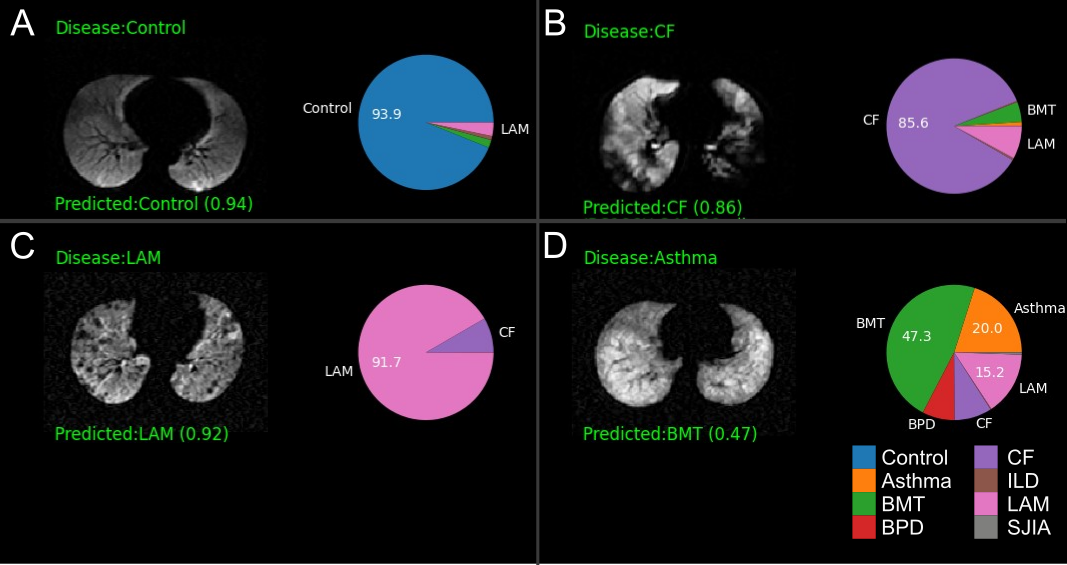
Figure 2: Representative neural network classification predictions
A) An axial slice with no defects was correctly identified as a control, B) An axial CF slice with large, heterogeneous defects was correctly classified, C) An axial LAM slice showing small, focal defects from cysts was correctly classified, D) An axial asthma slice. Ventilation heterogeneity without defects may have made classification difficult with no prediction greater than 50% probability, though the correct label was the second most likely. Both BMT and asthma often involve partial airway obstruction.
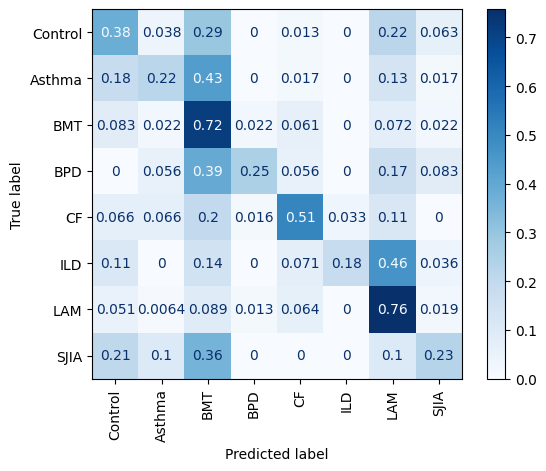
Figure 3: Confusion matrix of network predictions
Data were normalized to true labels such that rows display the proportion of true samples assigned each label.