0716
Accelerated Synthetic MRI with Deep Learning–Based Reconstruction for Breast Imaging1Department of Radiology, West China Hospital of Sichuan University, Chengdu, China, 2GE HealthCare MR Research, Beijing, China
Synopsis
Keywords: Breast, Breast, Synthetic MR,Deep Learning based reconstruction
Motivation: Synthetic MRI, with its unique advantages including unique signal acquisition, rapid synchronization, visualization and multiparameter maps, is gradually applied in breast cancer diagnosis. However, its extended scanning time restricts its broader use.
Goal(s): To accelerate synthetic MRI while maintaining its quantitative parameters and image quality using deep learning-based reconstruction (DLR).
Approach: 12 female patients were enrolled and scanned with two sets of synthetic MRI: a standard protocol and an accelerated protocol (before and after DLR). Quantitative parameters, SNR of lesion and subjective image quality were compared.
Results: Comparable image quality was achieved using accelerated synthetic MRI with DLR.
Impact: The combination of DLR with accelerated synthetic MRI protocol has significant benefits in promoting the practical application of synthetic MRI in breast imaging and enhancing examination efficiency.
Introduction
Synthetic MRI is a novel MRI technique that can simultaneously provide quantitative T1, T2, and PD maps and multi-contrast images after a single scan 1. Synthetic MRI has been shown to improve the accuracy of breast mass diagnosis, breast cancer classification, and prognosis prediction 2-7. Moreover, the image quality of synthetic T1WI and T2WI is similar to that of conventional images and diagnostically acceptable 8. Shortening the scan time is essential for clinical breast imaging 9. The lengthy examination time of synthetic MRI hinders its usage in clinical. In this study, we applied deep learning-based reconstruction (DLR) in accelerated synthetic MR breast imaging, and compare subjective image quality and quantitative values with conventional synthetic MRI to explore the impact of DLR in synthetic MR breast imaging.Methods
Patients: This IRB-approved study was performed on a 3T MR scanner (SIGNA Premier, GE Healthcare) with a dedicated 8-channel phased-array breast coil. 12 female patients (age: 32-67 years) with suspected breast cancer based on clinical evaluation were enrolled and underwent breast MRI examinations.Imaging parameters: All patients were scanned in feet first-prone position. Two sets of synthetic MRI scans: a standard protocol (manufacturer’s suggested protocol, 2x-SyMRI) and an accelerated protocol (3x-SyMRI), were added to the routine clinical examination. The scanning parameters used in standard 2x-SynMRI were: TR=4000ms, TE=17.6ms/88.0ms, slice thickness=5mm, spacing=1.0mm, matrix=256×256, FOV= 320mm×320mm, number of slices=20, echo train length=16, parallel imaging acceleration factor=2, and scan time=4min32s 8. The fast 3x-SyMRI used the same parameters as the standard 2x-SyMRI, except for acceleration factor (3) and scan time (2min56s).
Data processing: A prototype version of DLR (AIR Recon DL) was applied to reconstruct the k-space data of 3x-SyMRI to obtain images of 3x-SyMRI with DLR (3x-SyMRI-DLR). Quantitative T1, T2 and PD maps, as well as synthetic T1WI, T2WI, and T2WI-STIR images were generated using vendor-provided synthetic MR imaging software for 2x-SyMRI, 3x-SyMRI, and 3x-SyMRI-DLR. Subjective image quality was assessed by one radiologist using a 5-point Likert scale (1=poor, 5=excellent) in terms of the overall image quality, detail structure, diagnostic information for breast lesions, image homogeneity, and status of artifacts of the images 8,10. For quantitative objective assessment, T2, T1 and PD values and signal-to-noise ratio (SNR) of lesion were measured. The SNRlesion were calculated using the following formula: SNRlesion = SIlesion/SDfat. The ROIs delineation for lesion and fat are shown in Figure 1. The ROIs were coped across all three sequences.
Statistical analysis: The quantitative parameters between of 2x-SyMRI, 3x-SyMRI, and 3x-SyMRI-DLR were compared using the Kruskal-Wallis test. A P value less than 0.05 was considered statistically significant. Spearman correlation coefficient (r) was computed to assess the correlation of quantitative data among three sequences.
Results
There was no significant difference observed in T2, T1, and PD values of the lesion when comparing 3x-SyMRI and 3x-SyMRI-DLR to 2x-SyMRI. Strong correlations were found between 2x-SyMRI and 3x-SyMRI-DLR, as well as between 2x-SyMRI and 3x-SyMRI for lesion T1 (r=0.861, P<0.001; r=0.841, P<0.001) and lesion PD values (r=0.835, P<0.001; r=0.823, P=0.001). Excellent correlations were observed for lesion T2 values between 2x-SyMRI and 3x-SyMRI-DLR, and between 2x-SyMRI and 3x-SyMRI (r=0.971, P<0.001, r=0.956, P=<0.001) (Table 1, Figure 2).When comparing SNRlesion on T1WI, T2WI, and T2WI-STIR images, there was no statistically significant difference (Table 1).As shown in Table 2 and Figure 3, when evaluating all contrast-weighted images, 3x-SyMRI-DLR and 2x-SyMRI had higher image scores for overall image quality, detail structure, diagnostic information, and artifact status, compared to 3x-SyMRI. There was no significant difference in image homogeneity among three sequences (P=0.223).
Discussion
Our results demonstrated that 3x-SyMRI-DLR maintained stable quantitative measurements of T1, T2, and PD values compared to 2x-SyMRI, while offering improved image quality over 3xSynMRI. This aligns with previous results on head imaging 10. However, inconsistent with visual comparison, 3x-SyMRI-DLR exhibited no significant improvement in SNRlesion over 3x-SyMRI, which may be because SDfat is inappropriate to calculate SNRlesion. We used SDfat because there is no background noise in multi-contrast images of synthetic MRI. Future research can explore alternative methods for accurately calculating SNR, and involve more radiologists in subjective image quality assessments.Conclusion
The incorporation of DLR in accelerated synthetic MRI for breast imaging maintained stable quantitative parameter values with a 35% reduction in scan time compared to standard synthetic MRI, while preserving image quality. This will facilitate the clinical application of synthetic MRI in diagnosing breast diseases, and improve the examination efficiency.Acknowledgements
No acknowledgement found.References
[1] Matsuda M, Tsuda T, Ebihara R, et al. Enhanced Masses on Contrast-Enhanced Breast: Differentiation Using a Combination of Dynamic Contrast-Enhanced MRI and Quantitative Evaluation with Synthetic MRI. J Magn Reson Imaging. 2021 Feb;53(2):381-391. doi: 10.1002/jmri.27362. Epub 2020 Sep 11. PMID: 32914921.
[2] Liu J, Xu M, Ren J, et al. Synthetic MRI, multiplexed sensitivity encoding, and BI-RADS for benign and malignant breast cancer discrimination. Front Oncol. 2023 Feb 3;12:1080580. doi: 10.3389/fonc.2022.1080580. PMID: 36818669; PMCID: PMC9936239.
[3] Kazama T, Takahara T, Kwee TC, et al. Quantitative Values from Synthetic MRI Correlate with Breast Cancer Subtypes. Life (Basel). 2022 Aug 25;12(9):1307. doi: 10.3390/life12091307. PMID: 36143344; PMCID: PMC9501941.
[4] Li Q, Xiao Q, Yang M, et al. Histogram analysis of quantitative parameters from synthetic MRI: Correlations with prognostic factors and molecular subtypes in invasive ductal breast cancer. Eur J Radiol. 2021 Jun;139:109697. doi: 10.1016/j.ejrad.2021.109697. Epub 2021 Apr 8. PMID: 33857828.
[5]Matsuda M, Fukuyama N, Matsuda T,et al. Utility of synthetic MRI in predicting pathological complete response of various breast cancer subtypes prior to neoadjuvant chemotherapy. Clin Radiol. 2022 Nov;77(11):855-863. doi: 10.1016/j.crad.2022.06.019. Epub 2022 Aug 30. PMID: 36055826.
[6] Li Q, Xiao Q, Yang M, et al. Histogram analysis of quantitative parameters from synthetic MRI: Correlations with prognostic factors and molecular subtypes in invasive ductal breast cancer. Eur J Radiol. 2021 Jun;139:109697. doi: 10.1016/j.ejrad.2021.109697. Epub 2021 Apr 8. PMID: 33857828.
[7] Du S, Gao S, Zhao R, et al. Contrast-free MRI quantitative parameters for early prediction of pathological response to neoadjuvant chemotherapy in breast cancer. Eur Radiol. 2022 Aug;32(8):5759-5772. doi: 10.1007/s00330-022-08667-w. Epub 2022 Mar 10. PMID: 35267091.
[8] Fujioka T, Mori M, Oyama J, et al. Investigating the Image Quality and Utility of Synthetic MRI in the Breast. Magn Reson Med Sci. 2021 Dec 1;20(4):431-438. doi: 10.2463/mrms.mp.2020-0132. Epub 2021 Feb 2. PMID: 33536401; PMCID: PMC8922358.
[9] Patel S, Heacock L, Gao Y, et al. Advances in Abbreviated Breast MRI and Ultrafast Imaging. Semin Roentgenol. 2022 Apr;57(2):145-148. doi: 10.1053/j.ro.2022.01.004. Epub 2022 Jan 23. PMID: 35523528.
[10] Kim E, Cho HH, Cho SH, et al. Accelerated Synthetic MRI with Deep Learning-Based Reconstruction for Pediatric Neuroimaging. AJNR Am J Neuroradiol. 2022 Nov;43(11):1653-1659. doi: 10.3174/ajnr.A7664. Epub 2022 Sep 29. PMID: 36175085; PMCID: PMC9731246.
Figures
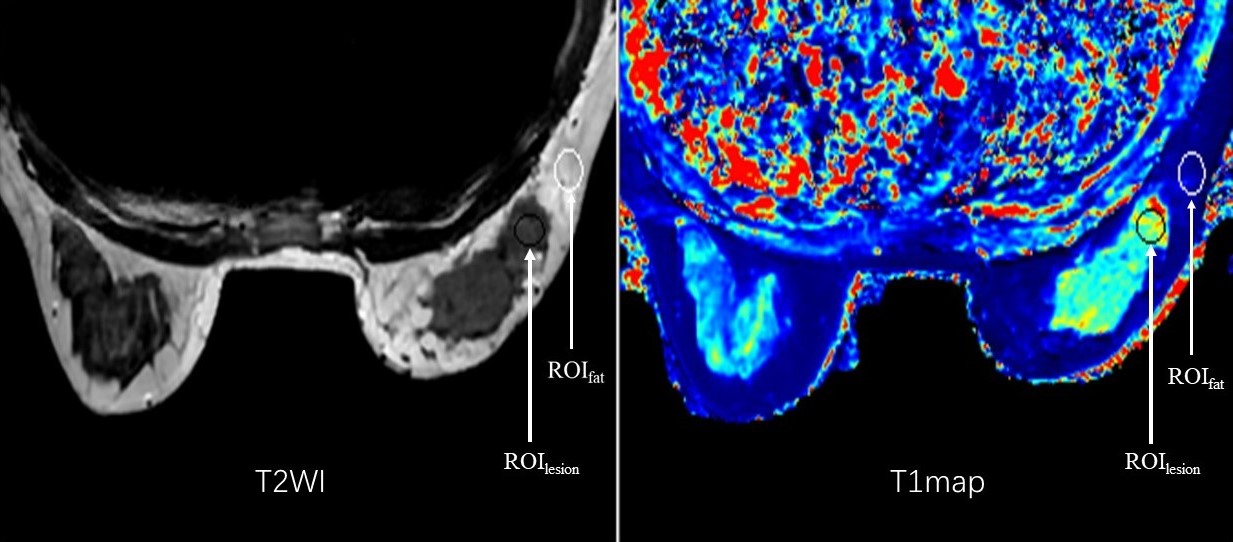
Figure 1. ROIs delineation for the lesion and fat. The ROIlesion was carefully drawn on the slice displaying the largest cross-section of the lesion with reference to the dynamic contrast enhanced MR images. The ROIfat was placed on the same slice where the fat appeared homogeneous.
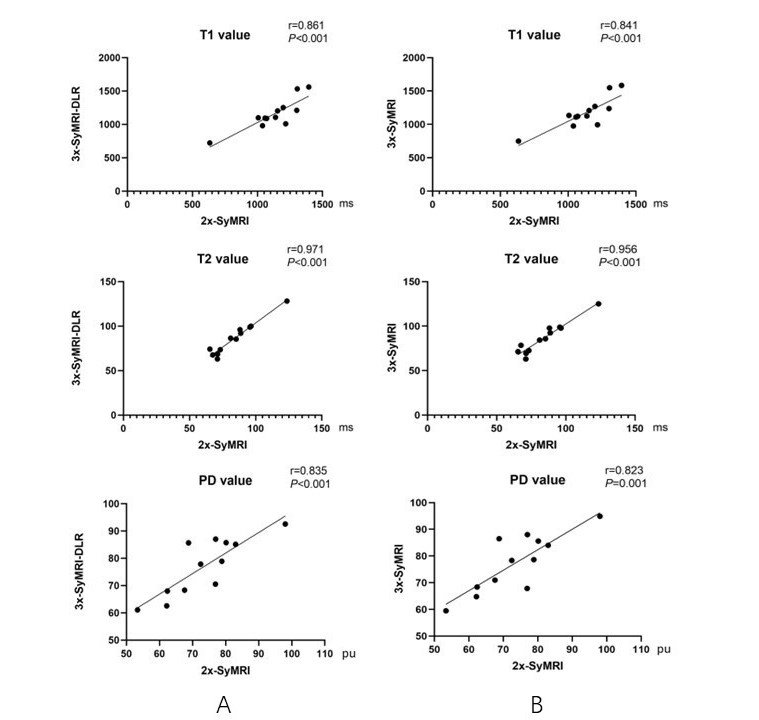
Figure 2. Scatter plots showing results of T1, T2 and PD values for the correlations between 3x-SyMRI-DLR versus 2x-SyMRI (A) and 3x-SyMRI versus 2x-SyMRI (B). Spearman rank correlation coefficient r (two-tailed) and P values were also displayed. The P values < 0.05 were considered statistically significant.
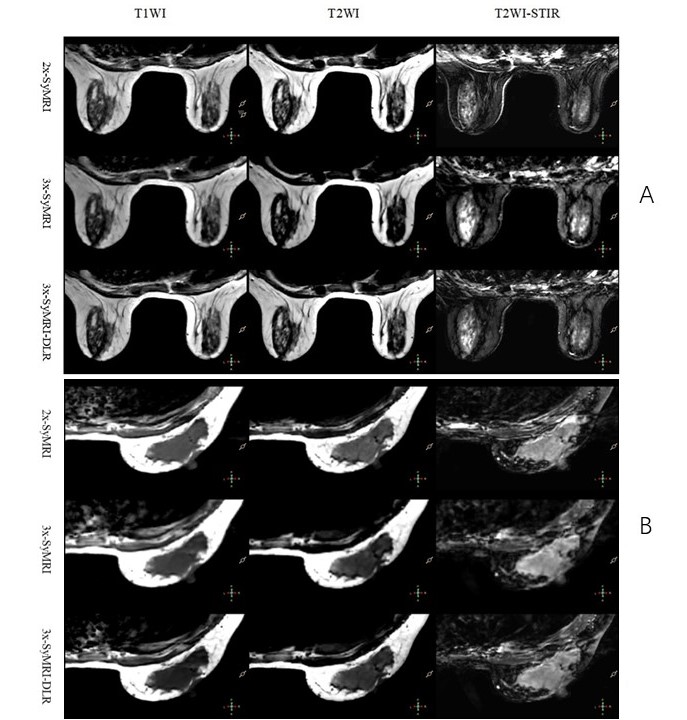
Figure 3. Axial contrast-weighted images of a 44-year-old (A) and 46-year-old women (B) who underwent breast MR imaging. By applying DLR, the overall image quality, detail structure, diagnostic information and status of artifacts image artifacts of the 3x-SyMRI-DLR appear significantly improved for all contrast-weighted images. No significant difference is noted in image homogeneity between the three sequences.
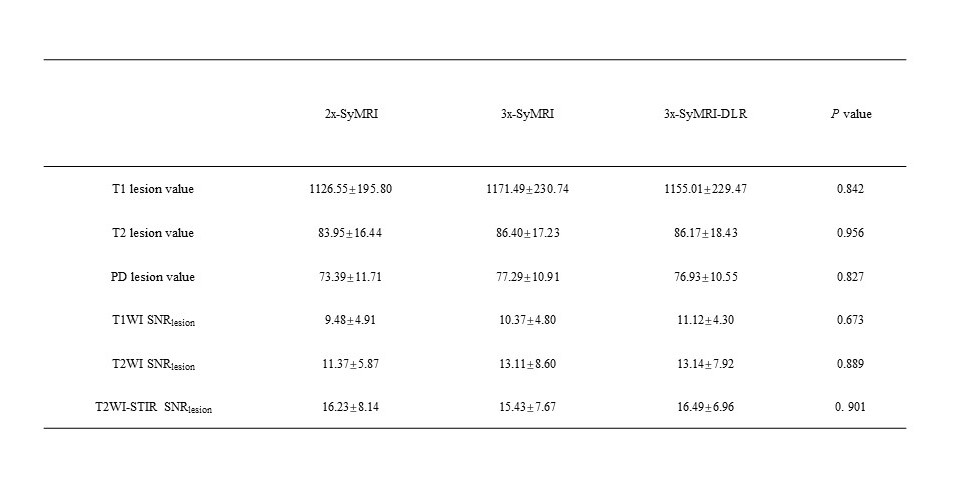
Table 1. T1, T2, PD values and signal-to-noise ratio (SNR) of lesion of 2x-SyMRI,3x-SyMRI and 3x-SyMRI-DLR. Values are mean ± standard deviation. P < 0.05 was considered statistically significant. Kruskal-Wallis test was used for quantitative parameters comparison.
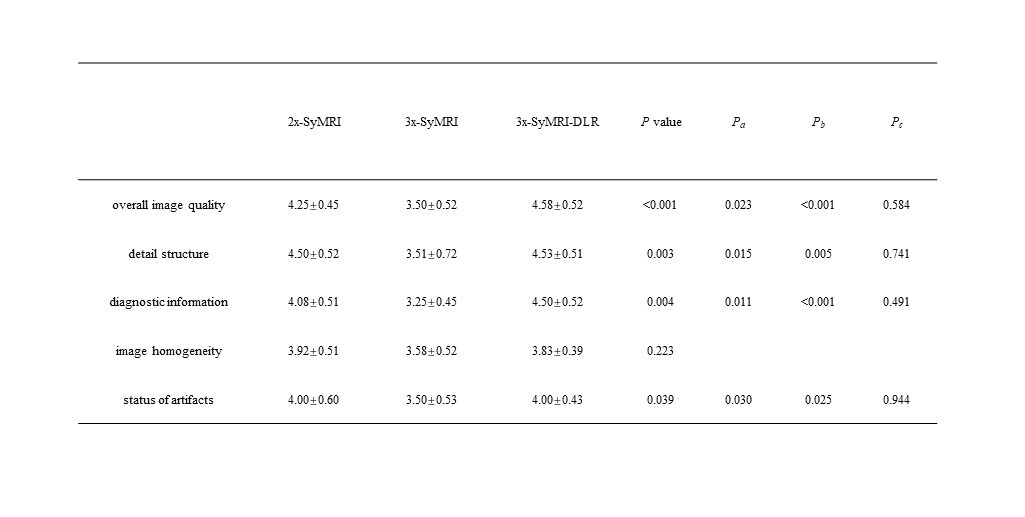
Table 2. Subjective image quality assessment of conventional 2x-SyMRI,3x-SyMRI and 3x-SyMRI-DLR. Values are mean ± standard deviation. P < 0.05 was considered statistically significant. Kruskal-Wallis test was used for quantitative parameters comparison. Pa value is for the comparison between 2x-SyMRI and 3x-SyMRI, Pb value is for the comparison between 3x-SyMRI and 3x-SyMRI-DLR, Pc value is for the comparison between 2x-SyMRI and 3x-SyMRI-DLR.