0715
Predicting tumor recurrence of locally advanced rectal cancer after neoadjuvant chemoradiotherapy based on multi-task deep-learning model1Fudan University Shanghai Cancer Center, Shanghai, China, 2ShanghaiTech University, Shanghai, China, 3MR Application Development, Siemens Shenzhen Magnetic Resonance Ltd, Shenzhen, China
Synopsis
Keywords: Pelvis, Machine Learning/Artificial Intelligence
Motivation: The promising application of deep learning (DL) techniques for prognostic prediction in various tumors has been reported, but mostly with single-task models
Goal(s): Exploring the use of multi-task DL models to automate the whole process of prediction for rectal cancer patients.
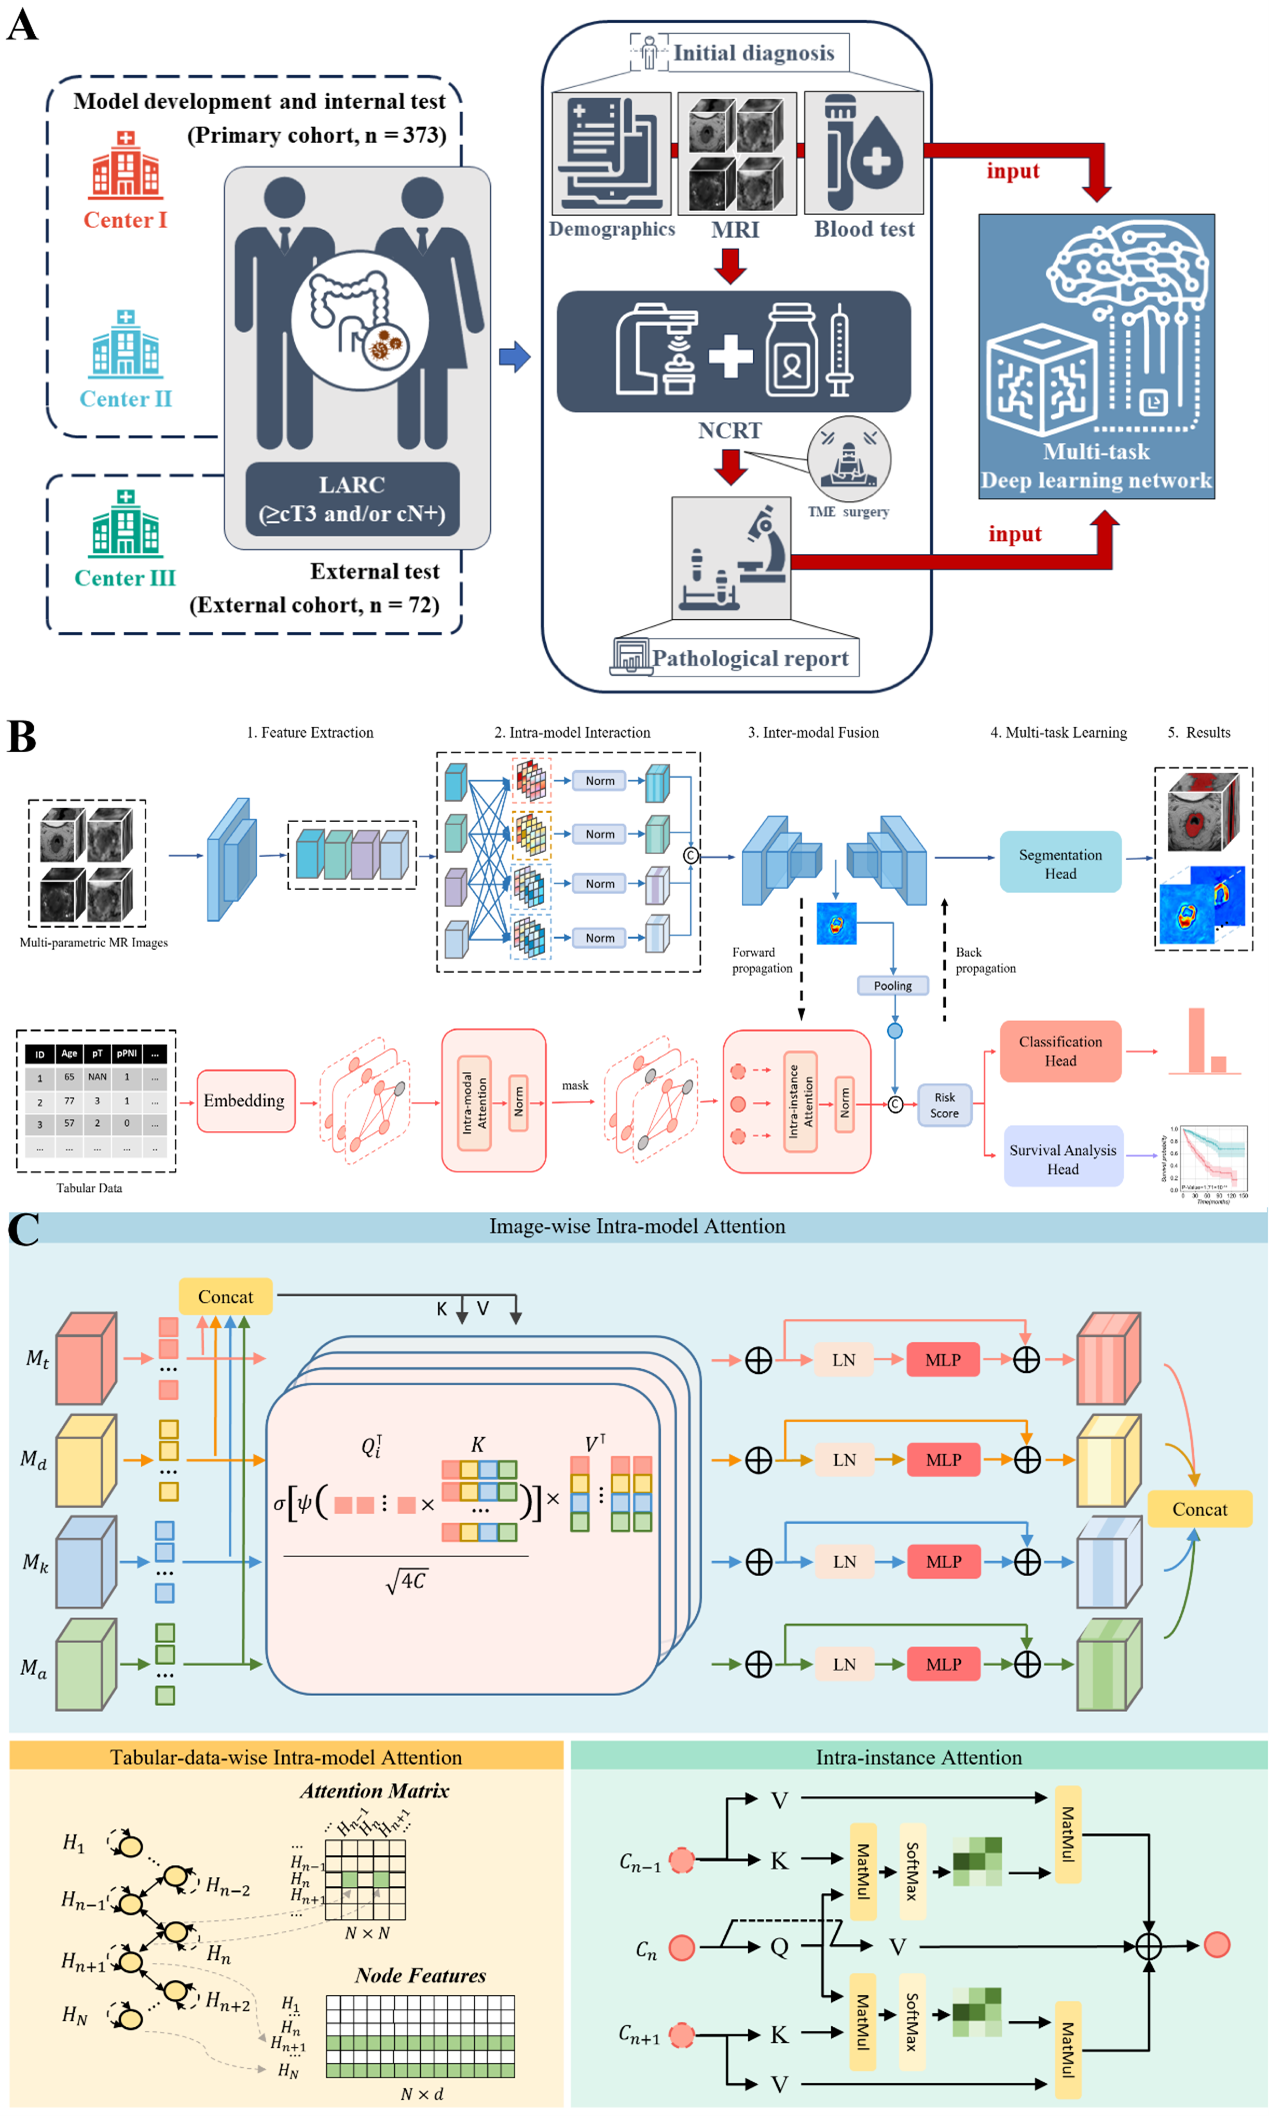
Approach: We designed a modality-fusion-based multi-task DL model to concurrently predict tumor volumes, patient relapse state, and patient risk scores based on a combination of multimodal MR images and clinical tabular data.
Results: The multi-task DL model achieved favorable predictive performance at the stage of initial diagnosis with automatic lesion identification, and further improved with the inclusion of postoperative pathology indicators.
Impact: Multi-tasking DL may be a new approach and orientation to fully automate the process of clinical prediction, and its feasibility is expected to be further explored in other oncology studies in the future.
INTRODUCTION:
Personalized management of locally advanced rectal cancer (LARC) depends on reliable prognostic prediction, which remains a challenge for current methods. Recently, novel deep learning models demonstrate exciting results in this field. This study was to develop and validate a multi-task deep learning model for full process automatic prediction of disease-free survival (DFS) of LARC patients treated with neoadjuvant chemoradiotherapy (NCRT).METHODS
This study retrospectively included rectal cancer patients treated with nCRT from three centers, and each patient has clinical information, baseline multimodal MRI images (T2, ADC, Dapp, Kapp), and follow-up survival data. We developed a deep multi-task joint survival model that simultaneously performed tumor segmentation, risk classification, and survival prediction. These three tasks collaborated with each other, which contributed to fully exploiting the key features of both imaging data and clinical data. To better explore the multi-view information from multimodal data, an attention mechanism was introduced to learn the jointly represented features within and across different modalities, leading to reduced noise level on the experimental results. To cope with the missing data situation, we employed a mask-based graph network structure, which can fully utilize the data and improve the adaptability and robustness of the network. In addition, we compared the performance of other well-designed single-task models and our proposed model. Several metrics were adopted for evaluation, including DSC (Dice Similarity Coefficient) for segmentation task; AUC (area under the receiver operating characteristic curve), accuracy, sensitivity, specificity, positive predictive value and negative predictive value for risk classification task; C-index and AUC of time-ROC for survival prediction task.RESULTS
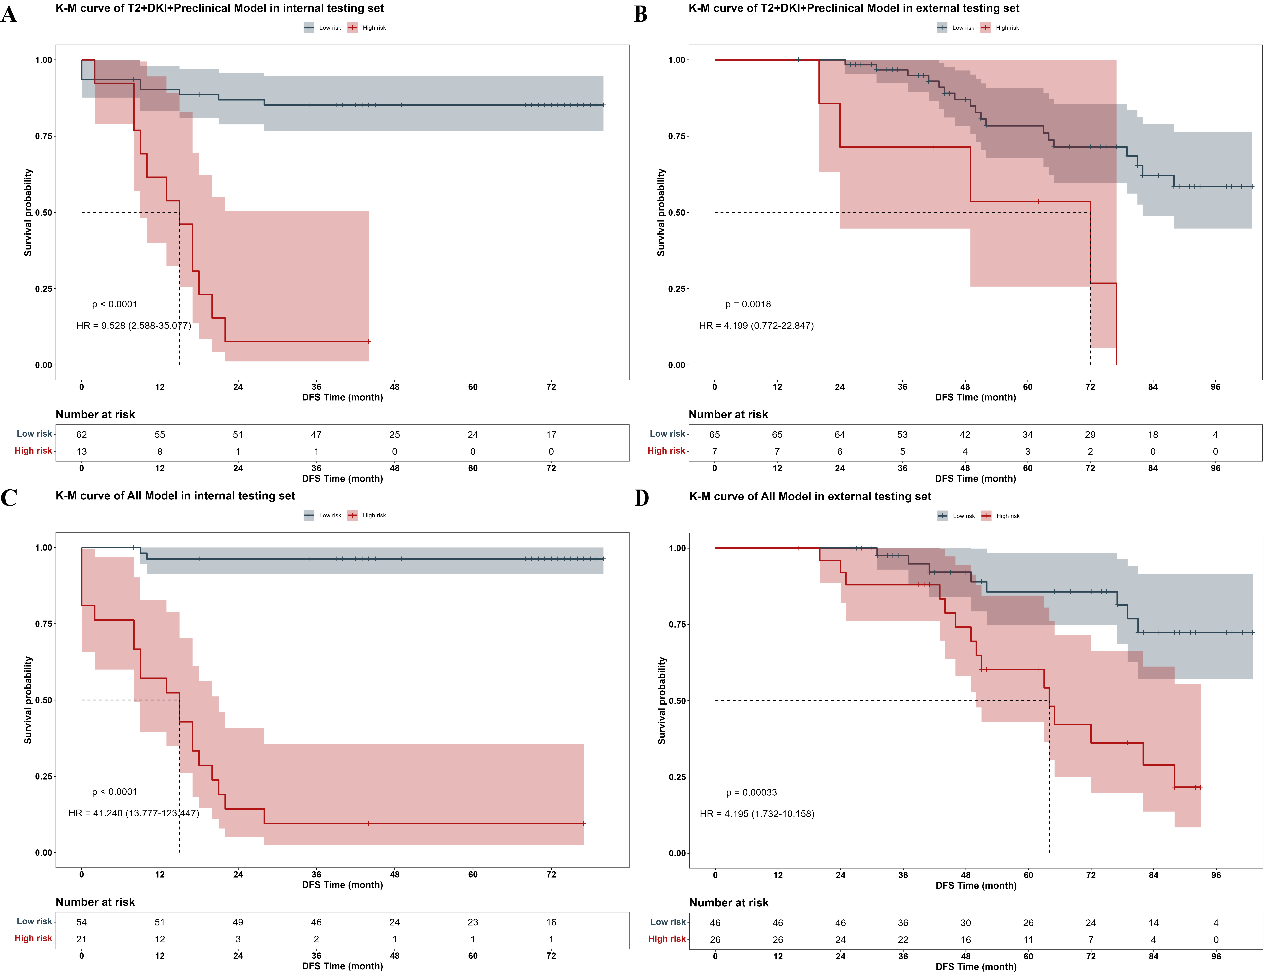
There were 261, 75 and 73 cases included in the training, internal testing and external testing set respectively. The best performance for DFS prediction was presented on model with all available data input, achieving AUC of 0.961 (95%CI: 0.877-0.988) for risk classification, C-index of 0.915 (95% CI: 0.860, 0.970) for survival prediction, and DSC of 0.724 for segmentation. The high-risk group stratified by risk according to the DL-score of models had significantly worse DFS than the low-risk group (HR = 41.240 [95% CI: 13.777, 123.447], P < 0.001). And models’ generalizability was proven in the external testing set (HR = 4.195 [95%CI: 1.732-10.158, P < 0.001]).DISCUSSION
In our study, the multi-task DL model performed significantly better than any single-task CNNs with manually labelling in relapse risk classification. We speculated that the inclusion of segmentation could lead to a more focused attention for both the classification and survival tasks. Although the area of attention did not exactly match the area labeled by the clinicians, it did not significantly deviate from the tumor area and may be beneficial in detecting valuable features of the peri-tumor area that were not recognized by the clinicians, which contributed to the improvement on predictive performance. In fact, several previous studies have demonstrated a tight association between image features in the peri-tumor region and tumor biology or clinical outcomes.CONCLUSION
We developed and validated a fully automatic and multimodal deep learning model to predict tumor recurrence of LARC after nCRT without any manually labeling of the tumor. The model could integrate multiple types of prognosis-related information and effectively stratify the recurrence risk of patients at different clinical treatment periods, thus providing important information for treatment decisions-making and advancing the development of precision medicine in rectal cancer.Acknowledgements
No acknowledgement found.References
No reference found.Figures
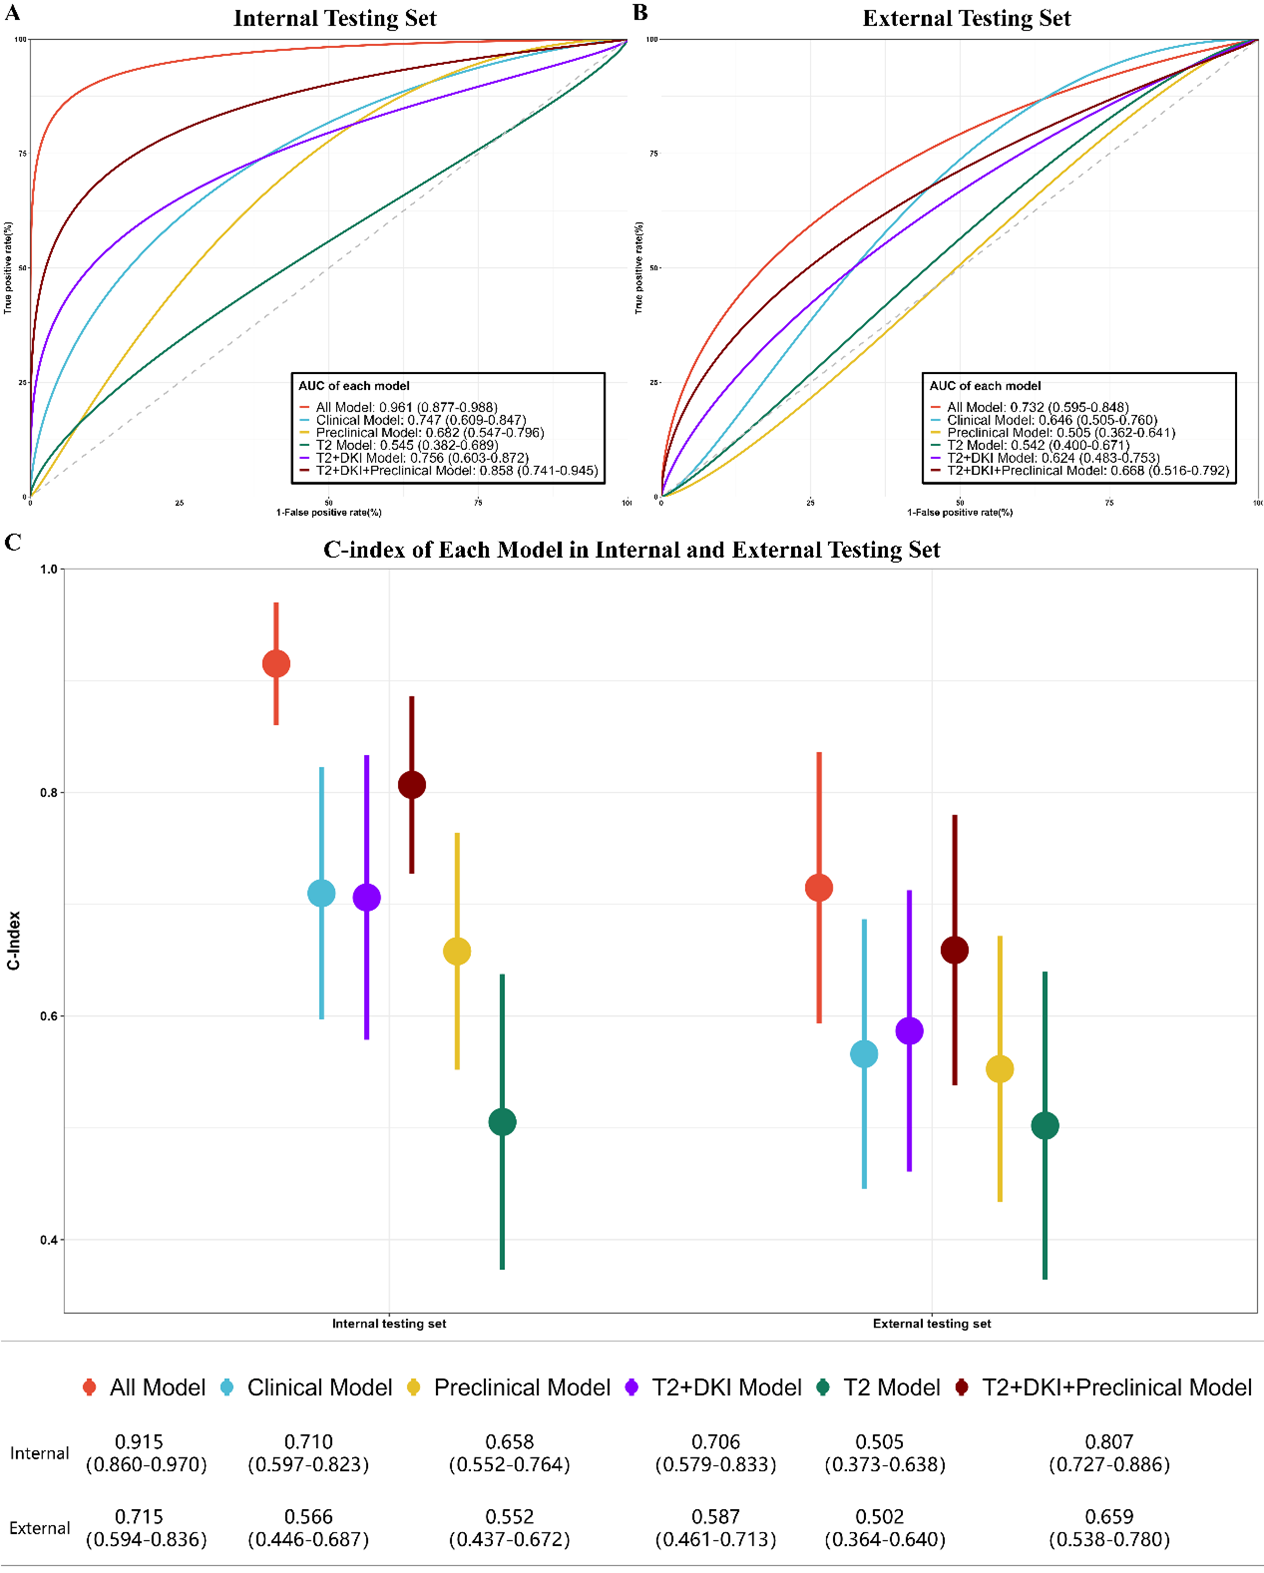
Receiver operating characteristic (ROC) curves for the (A) internal testing and (B) external testing sets for relapse risk classification and (C) C-index for survival prediction based on models with different data input. Data in brackets are 95% CIs. AUC = area under the ROC curve.