0709
Quantitative MRI method for characterising endometriomas1Perspectum, Oxford, United Kingdom, 2University of Oxford, Oxford, United Kingdom, 3Clinica Di Radiologia EOC, Istituto Di Imaging Della Svizzera Italiana (IIMSI), Lugano, Switzerland
Synopsis
Keywords: Biomarkers, Quantitative Imaging
Motivation: Diagnostic delay and uncertainty are common problems faced by patients suffering from endometriosis. Although laparoscopy remains the gold-standard for diagnosis, quantitative MRI (qMRI) could offer an alternative non-invasive approach.
Goal(s): To use qMRI to characterise endometriotic lesions.
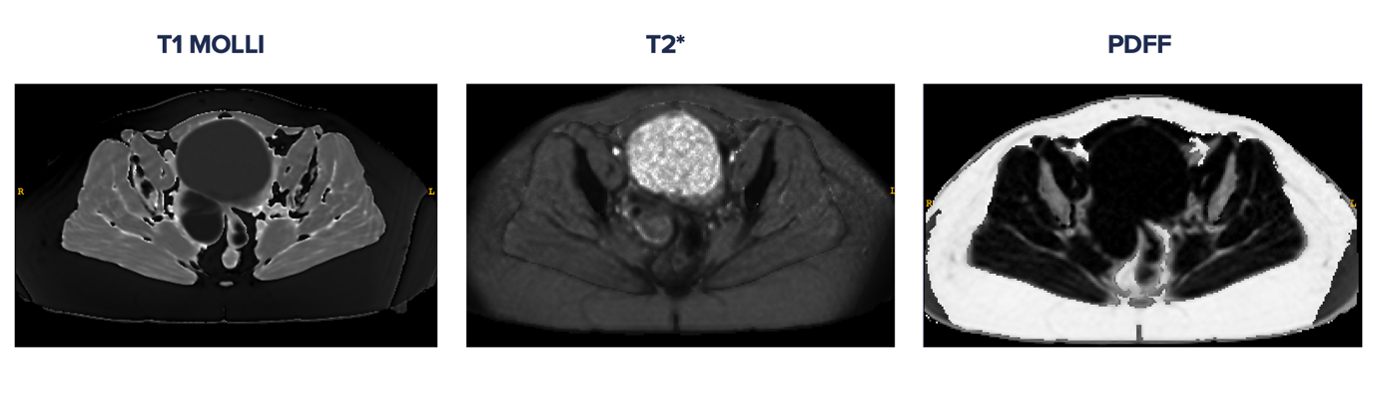
Approach: Quantitative analysis of multiparametric MRI data (including T1 MOLLI, T2* and PDFF parametric maps) to characterise tissue metrics obtained from patients suffering with chronic pelvic pain who subsequently underwent a diagnostic laparoscopy.
Results: Endometriomas have characteristic qMRI values different to other tissues in the female pelvis.
Impact: The distinctive parametric characteristics of endometriomas provides a foundation for the development of a non-invasive diagnostic tool that can detect endometriotic lesions within the pelvis.
Introduction
Endometriosis [1] affects 1 in 10 women, often causing long-term pain and infertility, with diagnosis typically taking 8 years [2] [3]. Guidelines have traditionally recommended laparoscopy as the gold-standard for diagnosis [4], however, following recent advances in AI enhanced medical imaging, clinical guidelines such as the European Society of Human Reproduction and Embryology (ESHRE) are calling for the development of novel imaging methods to reliably detect endometriosis and support early diagnosis [5]. Transvaginal ultrasound (TVU) while useful for diagnosing endometriosis, has limitations in scope and comfort, and requires expert interpretation. MRI is a standard alternative to TVU for pelvic scans but lacks quantitative metrics for pelvic structures. The characterisation of endometriomas (non-malignant mass(es) resulting from repeated deposition, inflammation, and fibrosis, constitute blood products of varying levels of iron and fibrotic content depending on the age of the mass [6]) could be supported by the use of quantitative multiparametric MRI (qMRI) [7]. qMRI, an objective way to identify different tissue types (such as tissue relaxometry values) by their MRI properties, has been successfully used to non-invasively characterise disease in other organs such as the liver using metrics like corrected T1 [8] and may have a role in endometriosis diagnosis and management. Our objective was to identify the utility of parametric maps in detecting endometriomas, in exclusion of other tissue types.Aim
To determine multiparametric MRI signal of endometriomas and to make comparisons with parametric values of other tissue located within the female pelvis.Methods
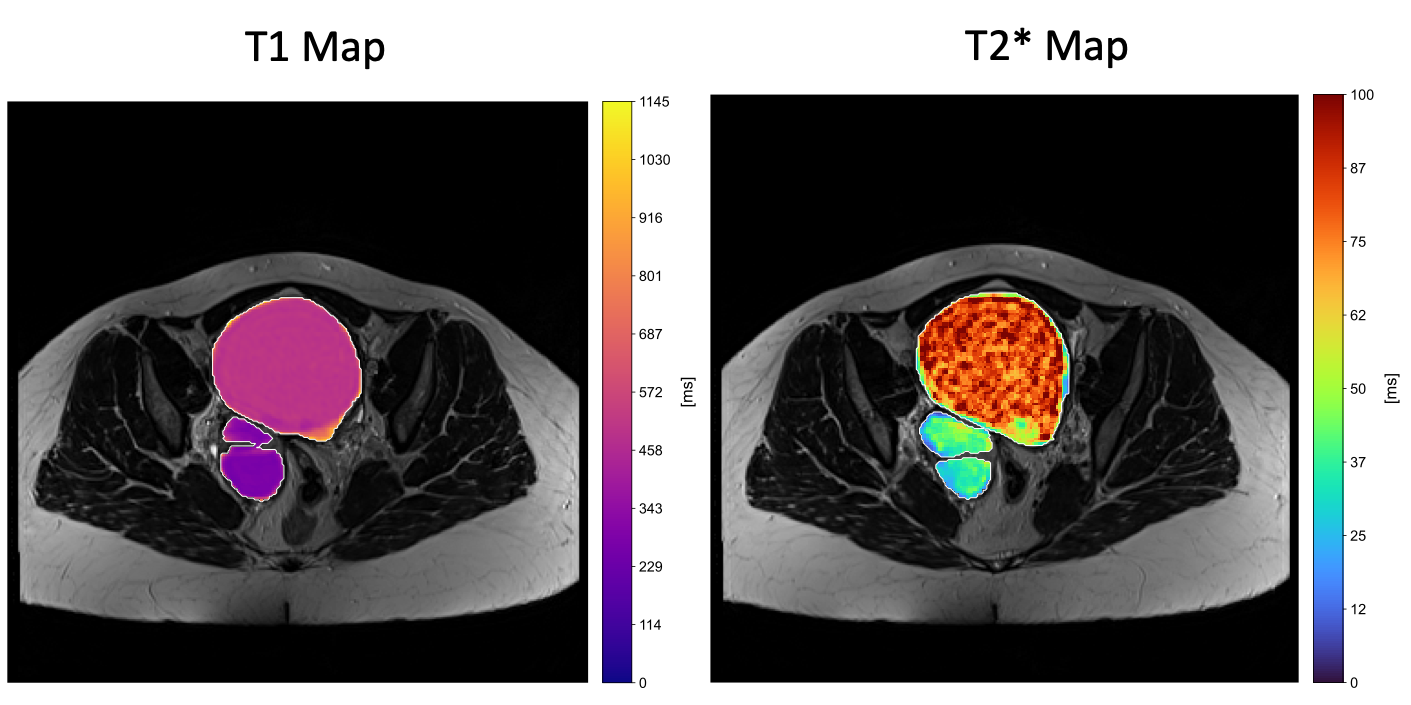
106 participants were recruited into the DEFEND study (NCT04974710). Alongside routine clinical assessment, all patients underwent an MRI scan to cover the full pelvic region (3T Siemens, Magnetom, Skyra). LiverMultiScan (LMS) scan protocols were utilised [9] to acquire parametric images with following changes to the field of view (FOV) and resolution made to allow for adequate pelvic image acquisition (Figure 1 and Figure 2):· T1 MOLLI maps: in-plane resolution 1.1x1.1mm2, slice thickness 8 mm, transverse slice, 11 sec per slice, between 1 and 15 slices collected.
· T2* and PDFF maps : in-plane resolution 1.7x1.7mm2, slice thickness 10mm, transverse slices, 9 sec for 5 slices, at least 1 set of 5 slices was collected.
Standard anatomical volumetric T1-weighted and T2-weighted images were also acquired in the same scanning session. No IV-contrast, anti-peristaltic, rectal or vaginal contrast was used.
In addition to clinical notes, anatomical images were further reviewed for evidence of endometriosis and endometriomas by a board-certified radiologist. Guided by the anatomical images, freehand regions of interest (ROI) were manually drawn on T1, T2* and PDFF maps using ITK-SNAP [10]. Tissue metrics were extracted from ROIs placed on the parametric maps for identified endometriotic lesions alongside other tissues.
Results
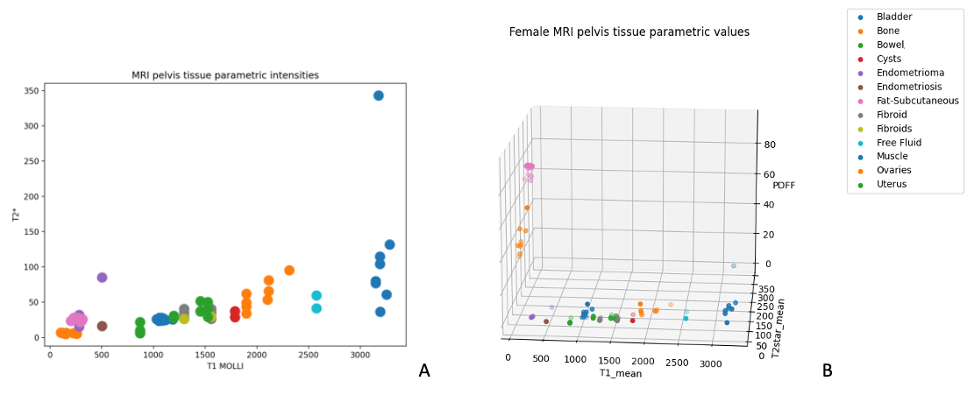
Of the 106 participants recruited, of those undergoing laparoscopy 35 (33%) participants had confirmed endometriosis, and 25 participants had MRI data appropriate for analysis. Following extraction of qMRI metrics for tissues normally found in a healthy female pelvis (including bone, bladder, bowel, muscle, ovaries, and uterus) as well as abnormal tissues found in patients (fibroids, cysts and free fluid), we found that the T1 and T2* values were overlapping for subcutaneous fat, bone and endometriomas (Figure 3A). Further stratification between quantified tissues was performed using a 3D analysis considering tissue fat parameters (Figure 3B) which resulted in complete stratification of the endometriomas from the other pelvic tissue metrics (subcutaneous fat and bone). Extracted metrics showed that endometriomas have PDFF values <5%, T1 values ranging 200-600ms and T2* values ranging 10-100ms.Discussion
Despite the high prevalence of endometriosis, it is still poorly diagnosed and patients experience diagnostic delays of up to 8 years alongside other clinical uncertainties. This prospective study demonstrated that endometriomas exhibit distinct qMRI metrics that, when considered in unison, enable their differentiation from other pelvic tissues. Endometriomas showed characteristic PDFF, T1, and T2* values that, although individually non-specific, collectively provided a unique signature. This multimetric approach overcomes the limitations of overlapping values seen in tissues like subcutaneous fat and bone, thereby enhancing the non-invasive characterisation of endometriomas. The integration of these qMRI metrics represents a promising advancement in the diagnostic imaging of endometriosis, potentially leading to more timely and accurate diagnoses.Conclusion
Quantitative multiparametric MRI shows promise for detecting endometriomas, potentially aiding early diagnosis and enhancing AI-based imaging for surgical planning and primary care diagnostics.Acknowledgements
No acknowledgement found.References
[1] | NHS, "Endometriosis," 05 September 2022. [Online]. Available: https://www.nhs.uk/conditions/endometriosis/. [Accessed 20 October 2023]. |
[2] | WHO, "Endometriosis," March 2023. [Online]. Available: https://www.who.int/news-room/fact-sheets/detail/endometriosis. [Accessed 20 October 2023]. |
[3] | R. Hadfield, H. Mardon, D. Barlow and S. Kennedy, "Delay in the diagnosis of endometriosis: a survey of women from the USA and the UK," oxfordjournals, 1996. |
[4] | NICE, "Endometriosis: diagnosis and management," 2017. [Online]. Available: https://www.nice.org.uk/guidance/ng73/chapter/Recommendations. [Accessed 20 October 2023]. |
[5] | ESHRE, "ESHRE Guideline Endometriosis," 2022. [Online]. Available: https://www.eshre.eu/Guideline/Endometriosis. [Accessed 20 October 2023]. |
[6] | S.-W. Guo, D. Ding, S. Minhong and L. Xishi, "Endometriotic Ovarian Cysts Based on the Content of Cyst Fluid and its Potential Clinical Implications," Reproductive Sciences, 2015. |
[7] | W. Fang, D. Dawei, D. Weiqiang, P. Dmytro, W. Qing and Y. Dexin, "Multi-Parametric MRI in Diagnosing Ovarian Endometrioma: a Feasibility Study," ISMRM, 2022. |
[8] | R. Banerjee, M. Pavlides, E. M. Tunnicliffe and S. K. Piechnik, "Multiparametric magnetic resonance for the non-invasive diagnosis of liver disease," Journal of Hepatology, 2014. |
[9] | V. Bachtiar, M. D. Kelly, H. R. Wilman, J. Jacobs, R. Newbould, C. J. Kelly, A. H. Herlihy and R. Banerjee, "Repeatability and reproducibility of multiparametric magnetic resonance imaging of the liver," PLoS One, 2019. |
[10] | P. A. Yushkevich, J. Piven, C. Hazlett, H. Smith, G. Smith, R. Ho, S. Ho, J. C. Gee and G. Gerig, "User-Guided {3D} Active Contour Segmentation of Anatomical Structures: Significantly Improved Efficiency and Reliability," Neuroimage, vol. 31, no. 3, pp. 1116-1128, 2006. |
Figures