0708
Non-invasive monitor expression of the glycolytic enzyme in vivo with deuterium MRI1Innovation Academy for Precision Measurement Science and Technology, Chinese Academy of Sciences, Wuhan, China, 2Department of Radiology, Union Hospital, Tongji Medical College, Huazhong University of Science and Technology, Wuhan, China, 3Clinical & Technical Support, Philips Healthcare (Beijing), Beijing, China
Synopsis
Keywords: Small Animals, Metabolism, Deuterium metabolic imaging; Tumor; Glycolytic enzyme
Motivation: Enzyme expression plays a crucial role in tumor metabolism, influencing tumor development and response to therapy. However, there is a lack of non-invasive techniques to measure the expression of glycolytic enzymes in research and clinics.
Goal(s): Verify whether Deuterium metabolic imaging (DMI), a promising non-invasive technique, can effectively monitor the expression changes of glycolysis enzyme in vivo.
Approach: Utilize deuterium MRS/MRI to monitor metabolic flux in two groups of mice with control tumor and HK2 knockdown tumor.
Results: DMI can indirectly monitor the expression changes of glycolytic enzymes represented by HK2 in vivo by measuring metabolic flux.
Impact: This study provides a non-invasive technique for measuring glycolytic enzyme expression of tumors in vivo. The proposed method might have clinical potential in cancer treatment management and response monitoring in a timely manner.
INTRODUCTION
Enzymes involved in glycolysis, such as hexokinase and lactate dehydrogenase, are upregulated in many tumors, promoting the Warburg effect, which plays a crucial role in tumor metabolism 1. Therefore, monitoring the expression of glycolytic enzymes is of great significance for understanding the development and treatment of tumors. Currently, the commonly used techniques for measuring enzyme expression are western blotting, enzyme-linked immunosorbent assay (ELISA), immunohistochemistry (IHC), etc. However, these methods are in vitro detection and cannot provide information in vivo and real-time measuring 2. DMI, as an emerging non-invasive detection technology, has proven great potential in tumor metabolism measuring 3. Previously, Felix Kreis et al 4 measured the flux of glucose metabolism in tumors with DMI. In this study, we utilized two tumor cells with different HK2 gene expressions to construct mouse models with different enzyme expression levels and verified whether DMI can effectively monitor metabolic flux caused by enzyme expression changes in vivo.METHODS
Figure 1 shows the entire experimental design. All experimental animals were randomly divided into two groups (one group for MC38-shNC, n=8; the other for MC38-shHK2, n=8). For tumor transplantation, MC38 cells and MC38 cells with HK2 knockdown resuspended in PBS were injected subcutaneously into the left leg of MC38-shNC mice and MC38-shHK2 mice, respectively. Then, DMI or spectra were performed on the mice when the tumor volume reached 500 mm3. Half of the mice in each group underwent deuterium MR spectroscopy scanning, and the other underwent dynamic MR chemical shift imaging (CSI). After the scanning, all the animals were collected for immunohistochemistry staining.Mice were anesthetized with isofluorane and anesthesia and maintained throughout the experiment (induction 3%, maintenance 1.5%). 2H surface coil is tightly attached to the tumor and placed in 1H body coil for radio-frequency (RF) transmission and signal detection. 1H anatomical T2-weighted proton image was acquired with RARE sequence. After the acquisition of the anatomical image, 2H glucose (2.0 g/kg weight) was injected manually into mice through a tail vein. For 2H-MRS, Non-localized Spectroscopy (NSPECT) was used to acquire the spectroscopy over 120 minutes. For 2H image, the CSI map data was used to acquire with 2D CSI sequence. After the scanning, the tumors were collected for hematoxylin and eosin (HE) staining and immunohistochemistry staining.
RESULTS & DISCUSSION
Figure 2 shows the comparison of dynamic metabolism spectra in MC38-shNC mice and MC38-shHK2 mice. For glucose, the concentration of MC38-shNC mice reached peak value in approximately 20 minutes, followed by a fast decrease, while the MC38-shHK2 mice declined slower. For lactate, the concentration of the MC38-shNC mice is significantly higher than that of MC38-shHK2 mice. In addition, we conducted statistics on the AUC values of lactate/glucose, and the results showed that the AUC value for MC38-shNC mice was significantly higher than that for MC38-shHK2 mice (P< 0.001). The above results indicated that knocking down HK2 will cause the rate of tumor glycolysis.The metabolism concentration obtained with the CSI sequence was acquired in 50 mins after injection of the 2H-glucose. Figure 3 shows the dynamic deuterium metabolic images in vivo for two group mice, and the concentration maps of different metabolism were overlaid on the corresponding 1H anatomical images. We can also notice that the glucose concentration of MC38-shNC mice decreased rapidly, while that of MC38-shHK2 mice decreased very slowly. For lactate, the concentration of MC38-shNC mice was significantly higher than that of MC38-shHK2 mice, and MC38-shNC mice produced a lot of lactates after 20 minutes, while the MC38-shHK2 mice only produced a little until 50 minutes. These results indicated that the deletion of HK2 genes can inhibit glycolysis and create a low metabolic environment in tumors.Figure 4 shows the result of immunohistochemistry for two group tumor tissue. The expression of HK2 enzyme and LDHA enzyme in MC38-shNC tumor is higher than that in MC38-shHK2 tumor, indicating that the deletion of HK2 genes can reduce the expression of HK2 enzyme and LDHA enzyme. In addition, correlation analysis was conducted between the AUC values of lactate/glucose for DMI and the IOD values for the HK2 and LDHA expression. It can be seen that the AUC values had a strong positive correlation with the IOD values (p<0.001), which indicated that DMI can monitor the expression of glycolytic enzymes in vivo by measuring metabolic flux.
CONCLUSION
In this study, we utilized MC38 cell and MC38 cells with HK2 gene knockdown expressions to construct mouse models with different enzyme expression levels and verified DMI can monitor the expression of glycolytic enzymes in vivo by measuring metabolic flux.Acknowledgements
This work was supported by the National Major Scientific Research Equipment Development Project of China (81627901), the National key of R&D Program of China (Grant 2018YFC0115000, 2016YFC1304702), National Natural Science Foundation of China (11575287, 11705274), and the Chinese Academy of Sciences (YZ201677).References
1. Lincet H, Icard P. How do glycolytic enzymes favour cancer cell proliferation by nonmetabolic functions? Oncogene. 2015;34(29):3751-9
2. Ou Y, Wilson RE, Weber SG. Methods of Measuring Enzyme Activity Ex Vivo and In Vivo. Annual Review of Analytical Chemistry. 2018;11(1):509-33.
3. De Feyter HM, Behar KL, Corbin ZA, Fulbright RK, Brown PB, McIntyre S, et al. Deuterium metabolic imaging (DMI) for MRI-based 3D mapping of metabolism in vivo. Science advances. 2018;4(8):eaat7314
4. Kreis F, Wright AJ, Hesse F, Fala M, Hu DE, Brindle KM. Measuring Tumor Glycolytic Flux in Vivo by Using Fast Deuterium MRI. Radiology. 2020;294(2):289-96.
Figures
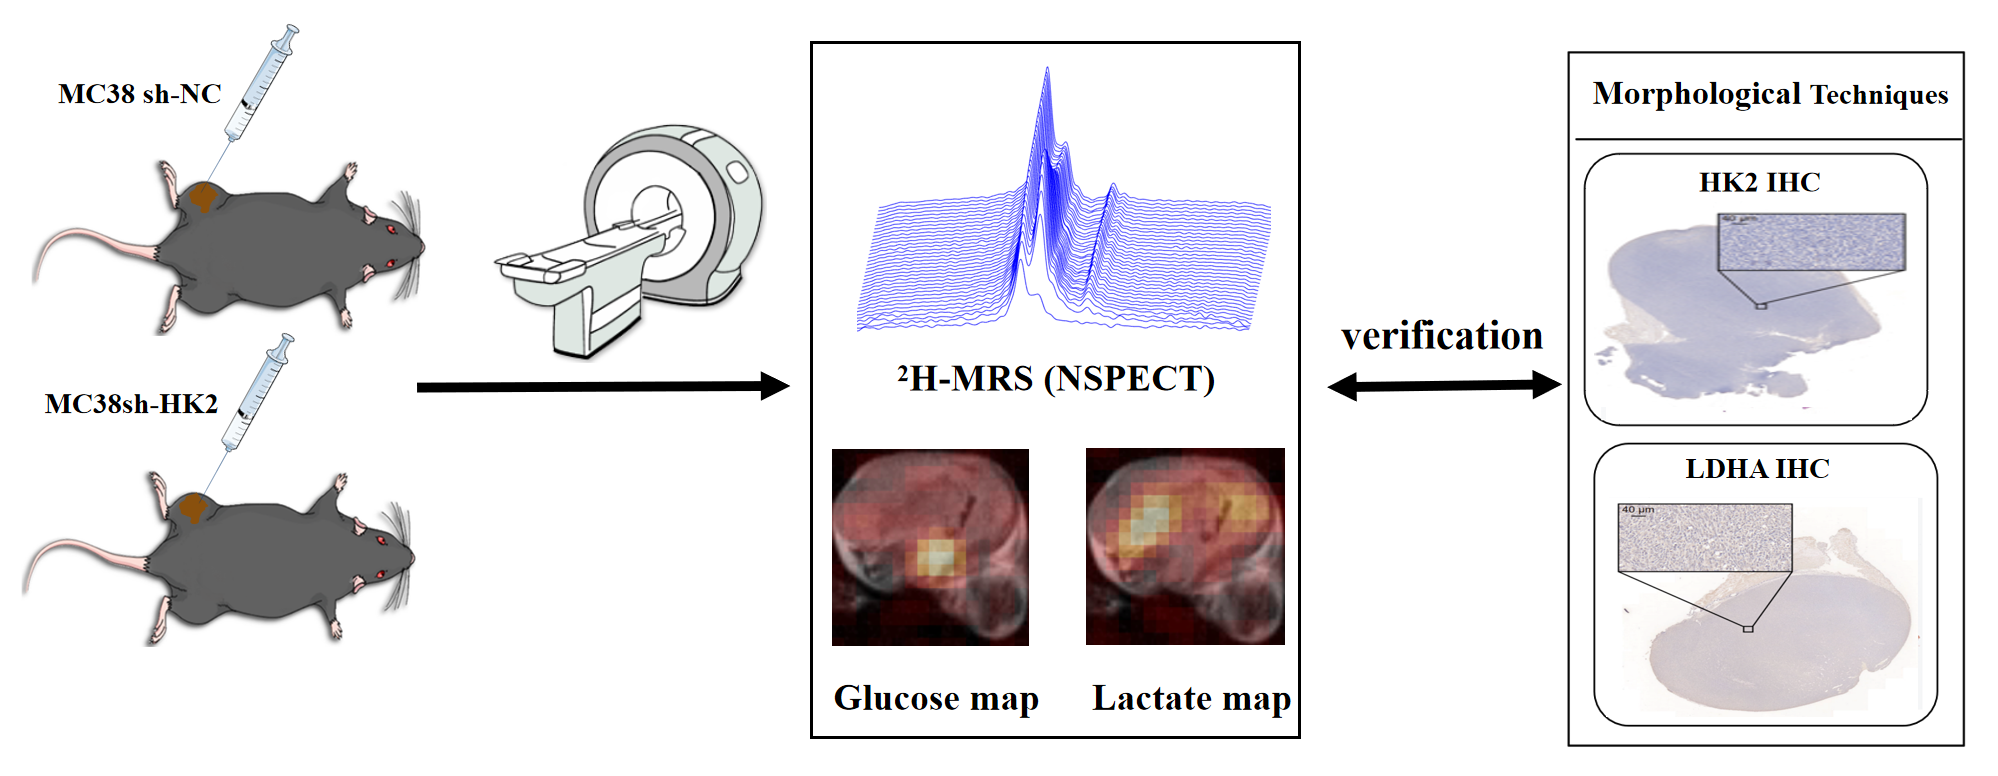
Figure 1 The entire experimental process. MC38 cell (MC38-shNC) or MC38 cells with HK2 knockdown (MC38-shHK2) were injected subcutaneously into the left leg of mice. When the tumor volume reached 500 mm3, the tumor model mice performed MR scans, after that, the tumor tissues were collected and placed for immunohistochemistry staining.
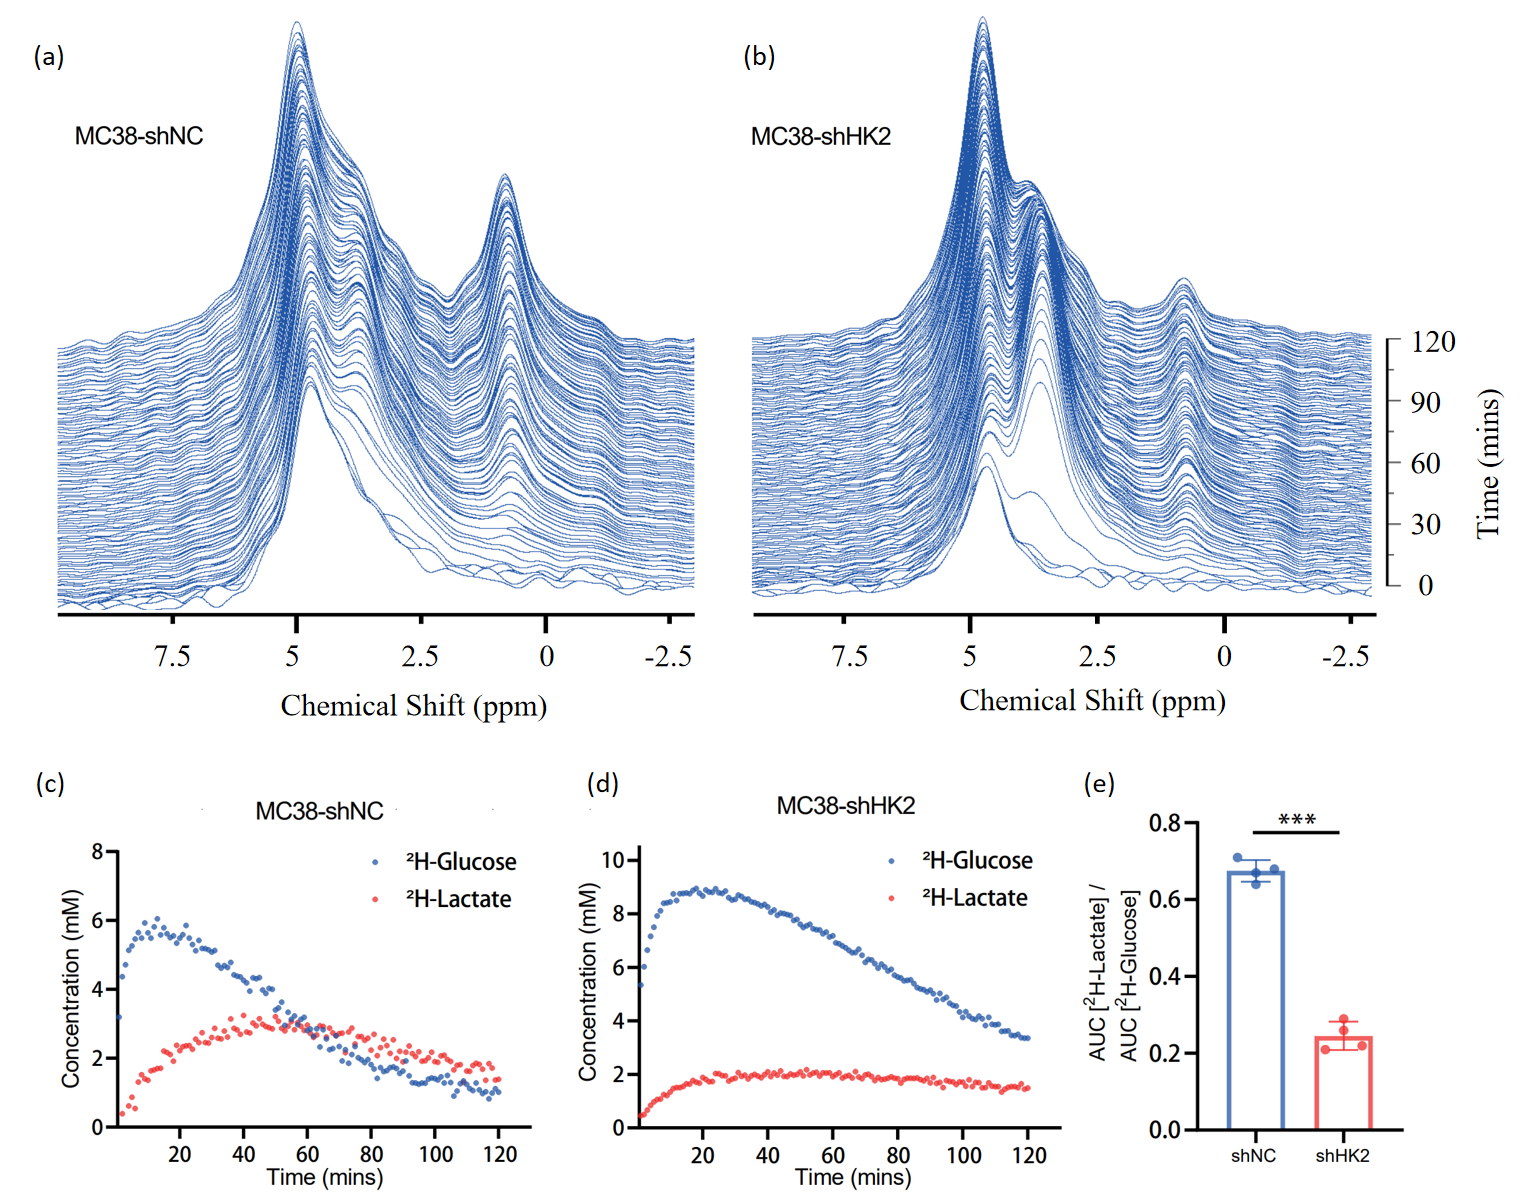
Figure 2 In vivo real-time 2H-glucose metabolism. In vivo 2H spectra for MC38-shNC mice (a), MC38-shHK2 mice (b) were recorded in 120 minutes after injection of 2 g/kg 2H-glucose. The concentrations for the 2 group mice (c, d) of 2H labeled glucose and lactate were fitted individually by using prior knowledge. In addition, we conducted statistics on the AUC values of lactate concentrations to labeled glucose concentrations.
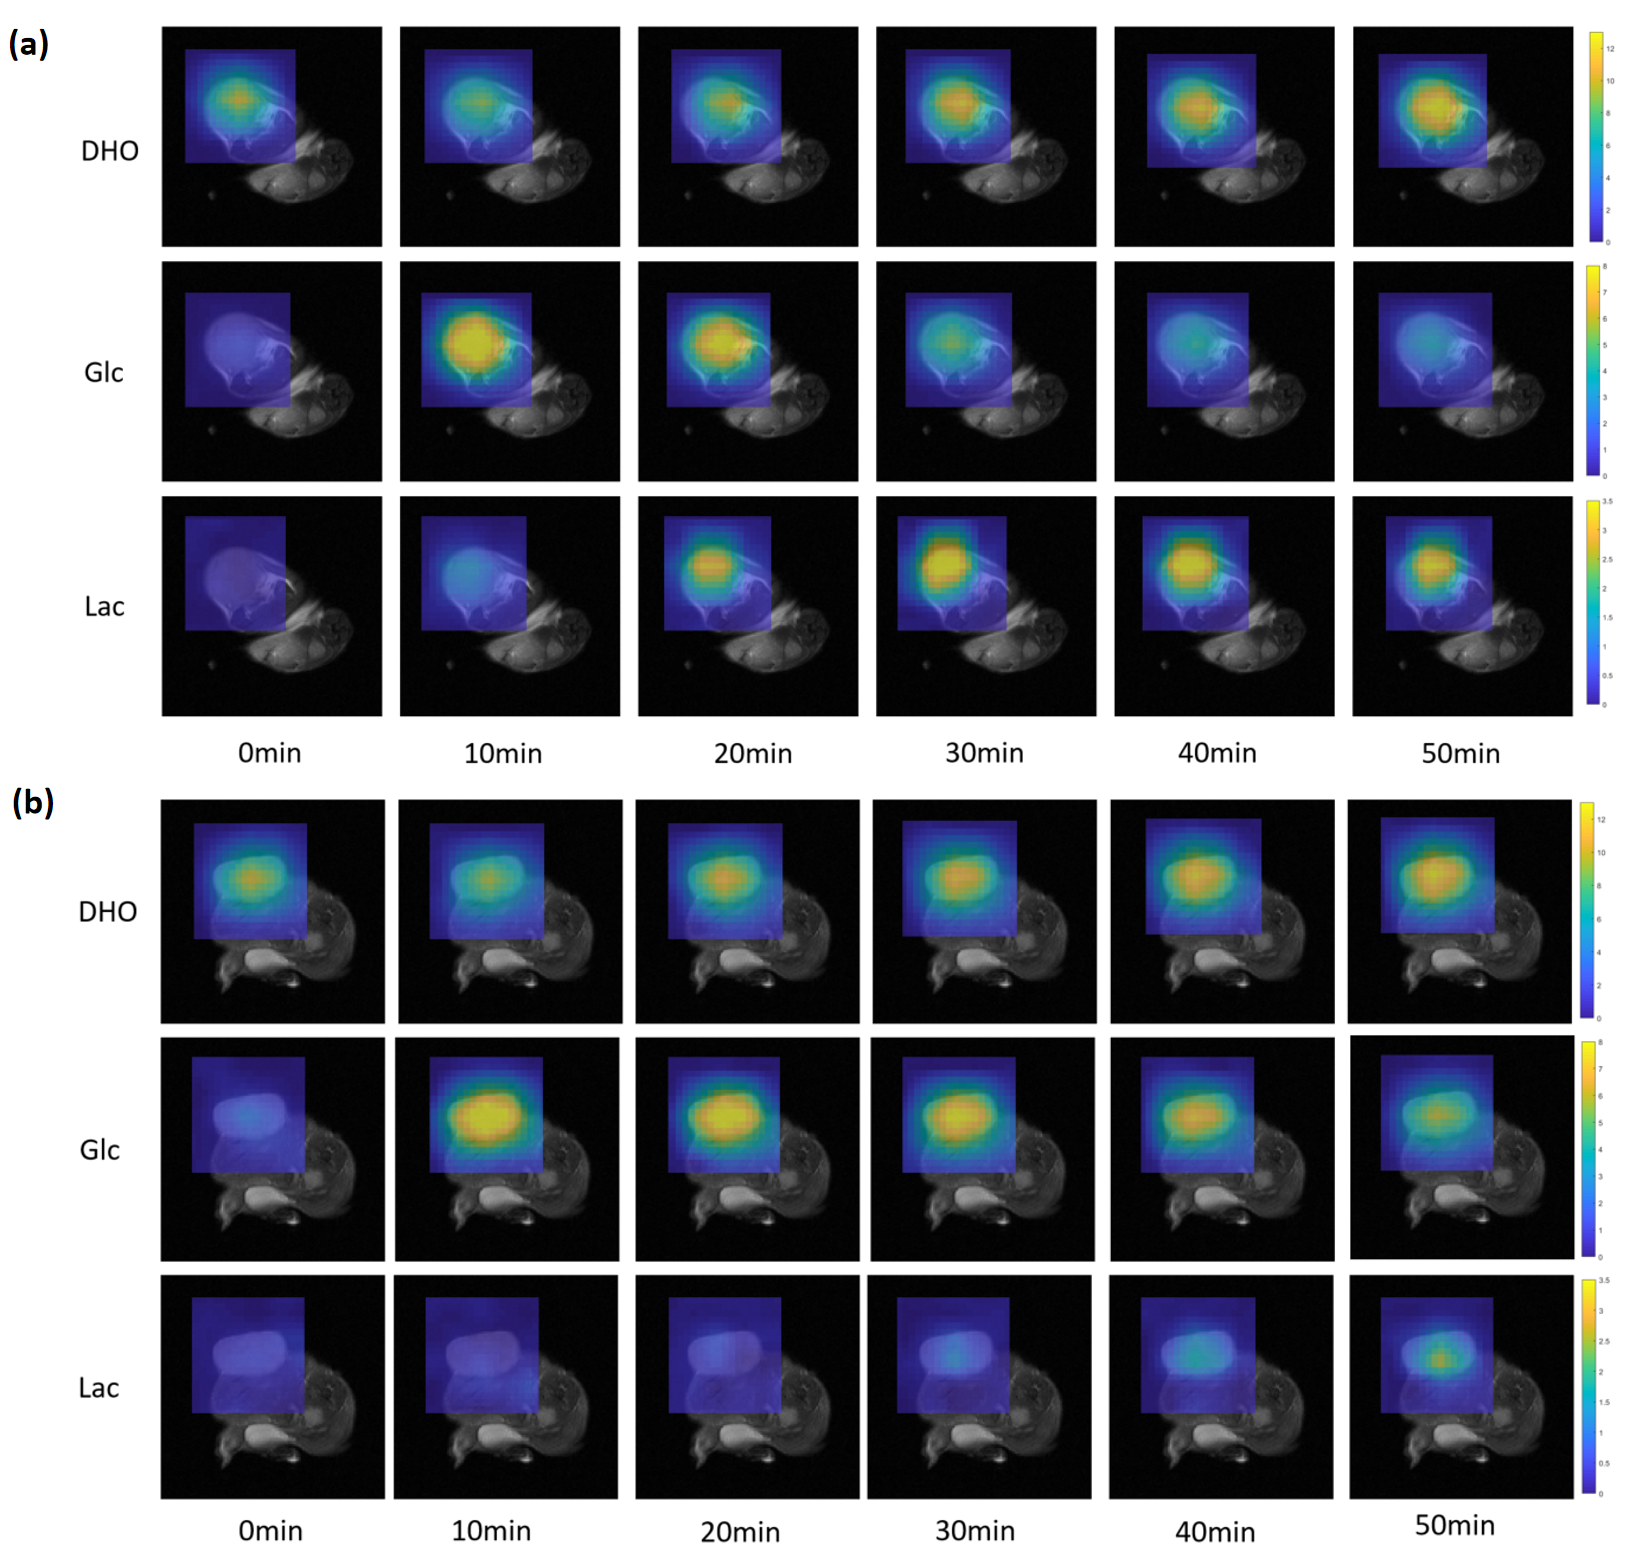
Figure 3 Dynamic 2H MR spectroscopic imaging measurements of deuterated water, glucose, and lactate concentrations in a MC38-shNC mouse (a) and MC38-shHK2 mouse (b). Axial slices from a reference 1H image acquired by using RARE sequence. Metabolite concentration maps calculated from 2D 2H chemical shift images acquired at the specified times after injection of 2 g/kg 2H-glucose. The color coding represents concentrations (in millimolar) derived from the ratios of the peak amplitudes to the initial 2H-water map.
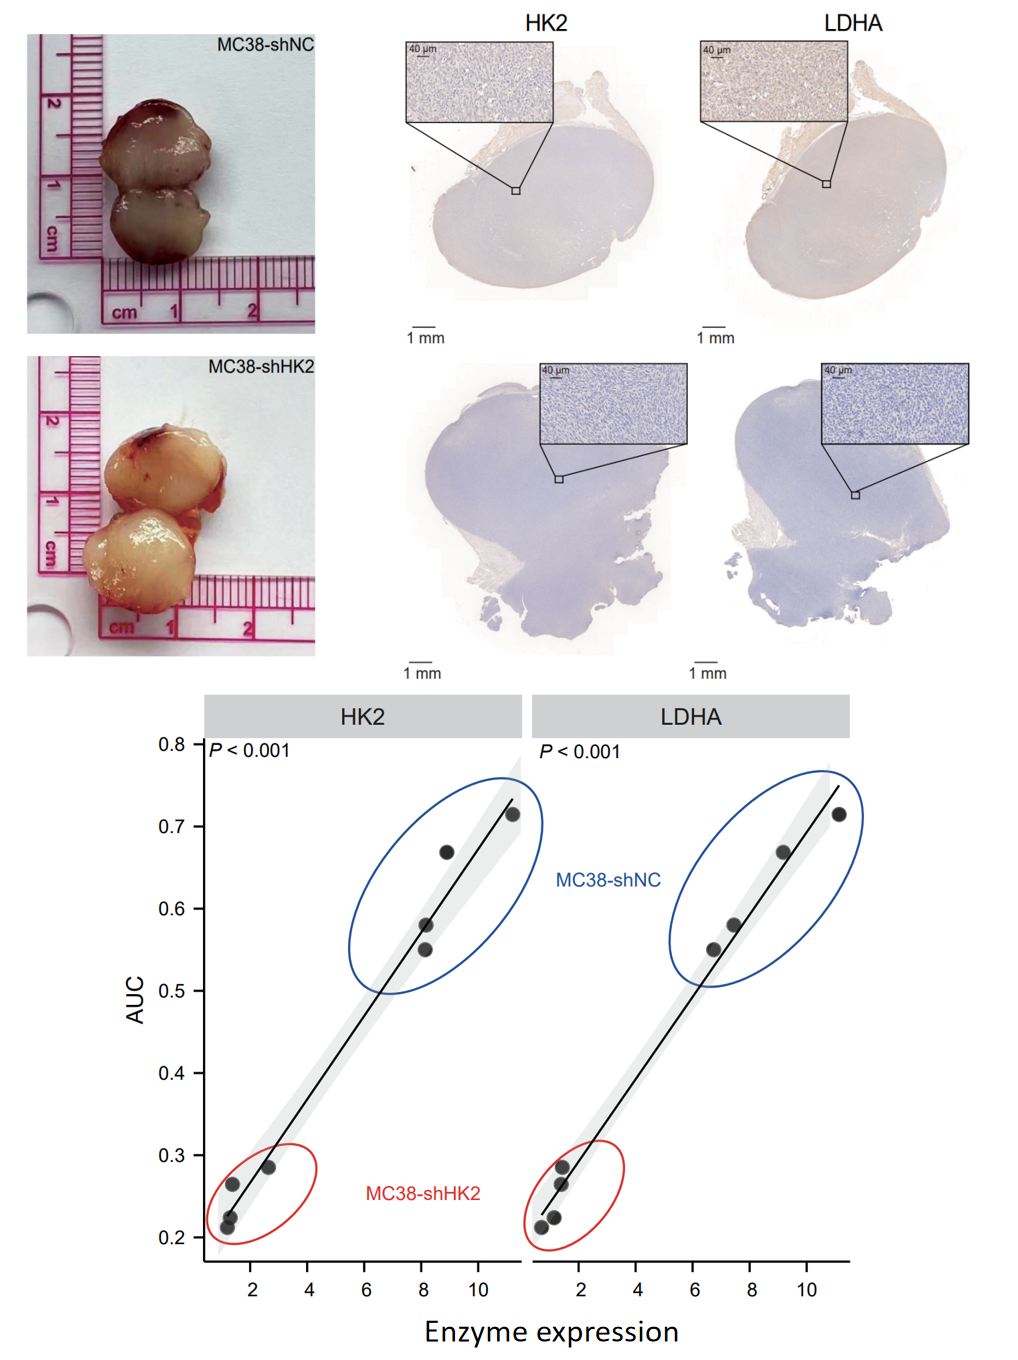
Figure 4. The results of HE staining and immunohistochemical for MC38-shNC tumor tissue and MC38-shHK2 tumor tissue. After the MR scan, the tumor tissue slices were stained with hematoxylin and eosin and immunohistochemistry. The first row was the results of HK2 immunohistochemistry staining and LDHA immunohistochemistry staining for MC38-shNC tumor tissue, and the second row was the results for MC38-shHK2 tumor tissue. The third row was the correlation analysis between the AUC values of lactate/glucose for DMI and the IOD values for the HK2 and LDHA expression.