0707
A deuterium MRS study of the effect of the ketogenic diet on β-hydroxybutyrate metabolism in a mouse model of Dravet syndrome1Washington University in St. Louis, Saint Louis, MO, United States
Synopsis
Keywords: Epilepsy, Deuterium
Motivation: Children with Dravet syndrome, a drug-resistant epilepsy, often show a positive response to the ketogenic diet (KD) where the TCA cycle is driven mainly by ketones.
Goal(s): To monitor TCA cycle metabolism of ketone body β-hydroxybutyrate in wild-type and Dravet mouse models comparing normal diet (ND) vs. KD.
Approach: Deuterium (2H) single-voxel brain MRS is applied to wild-type and Dravet mouse models following subcutaneous administration of [3,4,4,4-2H4]β-hydroxybutyrate.
Results: Mice on KD vs. ND show enhanced brain uptake of β-hydroxybutyrate (p < 0.001) with subsequent increase in glutamine+glutamate (“Glx”) production (p < 0.002), evidence that the KD upregulates brain monocarboxylate transporters.
Impact: Deuterium metabolic imaging quantification of TCA cycle flux in individual Dravet patients may (i) assess metabolic dysfunction, (ii) assist in selecting the best treatment option, and (iii) allow optimization of the diet. Hence development of a personalized treatment plan.
Introduction
Children with Dravet syndrome have drug-resistant epilepsy and intellectual impairment. It is typically caused by a voltage-gated sodium channel mutation (Scn1a). We have employed a mouse model of Dravet syndrome in which animals are heterozygous for an Scn1a mutation, causing haploinsufficiency, and have epilepsy closely mimicking the human disorder1. The ketogenic diet (KD), which is a high fat, adequate protein, low carbohydrate diet, has long been used as a therapy for epilepsy and is particularly effective in Dravet syndrome patients2. Among its effects, the KD alters energy metabolism. On a normal diet (ND), the TCA cycle is driven mainly by the formation of pyruvate via glycolysis. On a KD, glucose availability is reduced, and the TCA cycle is driven mainly by ketones (acetoacetic acid and β-hydroxybutyrate) entering the TCA cycle via conversion to acetyl-CoA. To quantify this metabolic derangement, we employed deuterium (2H) single-voxel brain MRS following [3,4,4,4-2H4] β-hydroxybutyrate (βHB) subcutaneous (sc) infusion.Methods
All procedures involving mice were approved by the Washington University Institutional Animal Care and Use Committee (IACUC). Experiments employed young, hybrid mice that were the progeny of mating C57BL/6J females with asymptomatic 129S6/SvEvTac males heterozygous for a targeted deletion of the first exon in the 𝛼1 subunit of the neuronal, voltage-gated sodium channel3. Four cohorts of mice were studied, n = 6 each: (i) no deletion “wild-type” mice on ND, (ii) wild-type mice on KD, (iii) single deletion “Dravet” mice on ND, (iv) Dravet mice on KD. The KD was a ~6:1 AIN-76A-Modified, high fat, paste (F3666; Bio-Serv, Flemington, NJ).An Agilent/Varian 11.74T DirectDriveTM system was used. Mice were anesthetized with isoflurane and monitored for maintenance of normal body temperature and respiration. A sc catheter was placed in the midline of the upper back. Single-voxel, localized magnetic field shimming used a 1H volume coil and typically achieved a water 1H linewidth of 40 – 60 Hz. Single-voxel 2H MRS data were collected using a two-turn, ~2-cm diameter surface coil and the SPECIAL pulse sequence4 with outer-volume suppression5. Nominal voxel dimensions were 3 × 6 × 5 mm3, and the voxel was completely contained within the brain. 2H MRS data were acquired in 5-minute time blocks, two time-blocks prior to substrate administration and 14 time-blocks following substrate administration. Other data acquisition and analysis details are as described previously6. βHB (CDN Isotopes, Pointe-Claire, QC, Canada) was administered sc at a 1-molar concentration in 0.9% saline solution at a dose of 25 μL/g-body-weight7. The natural-abundance semi-heavy water (1HO2H = HOD) signal amplitude provides deuterium concentration reference6. With knowledge of substrate and metabolite relaxation time constants and labeling stoichiometry8,9, 2H resonance amplitudes were converted to aqueous molar concentrations.
Results
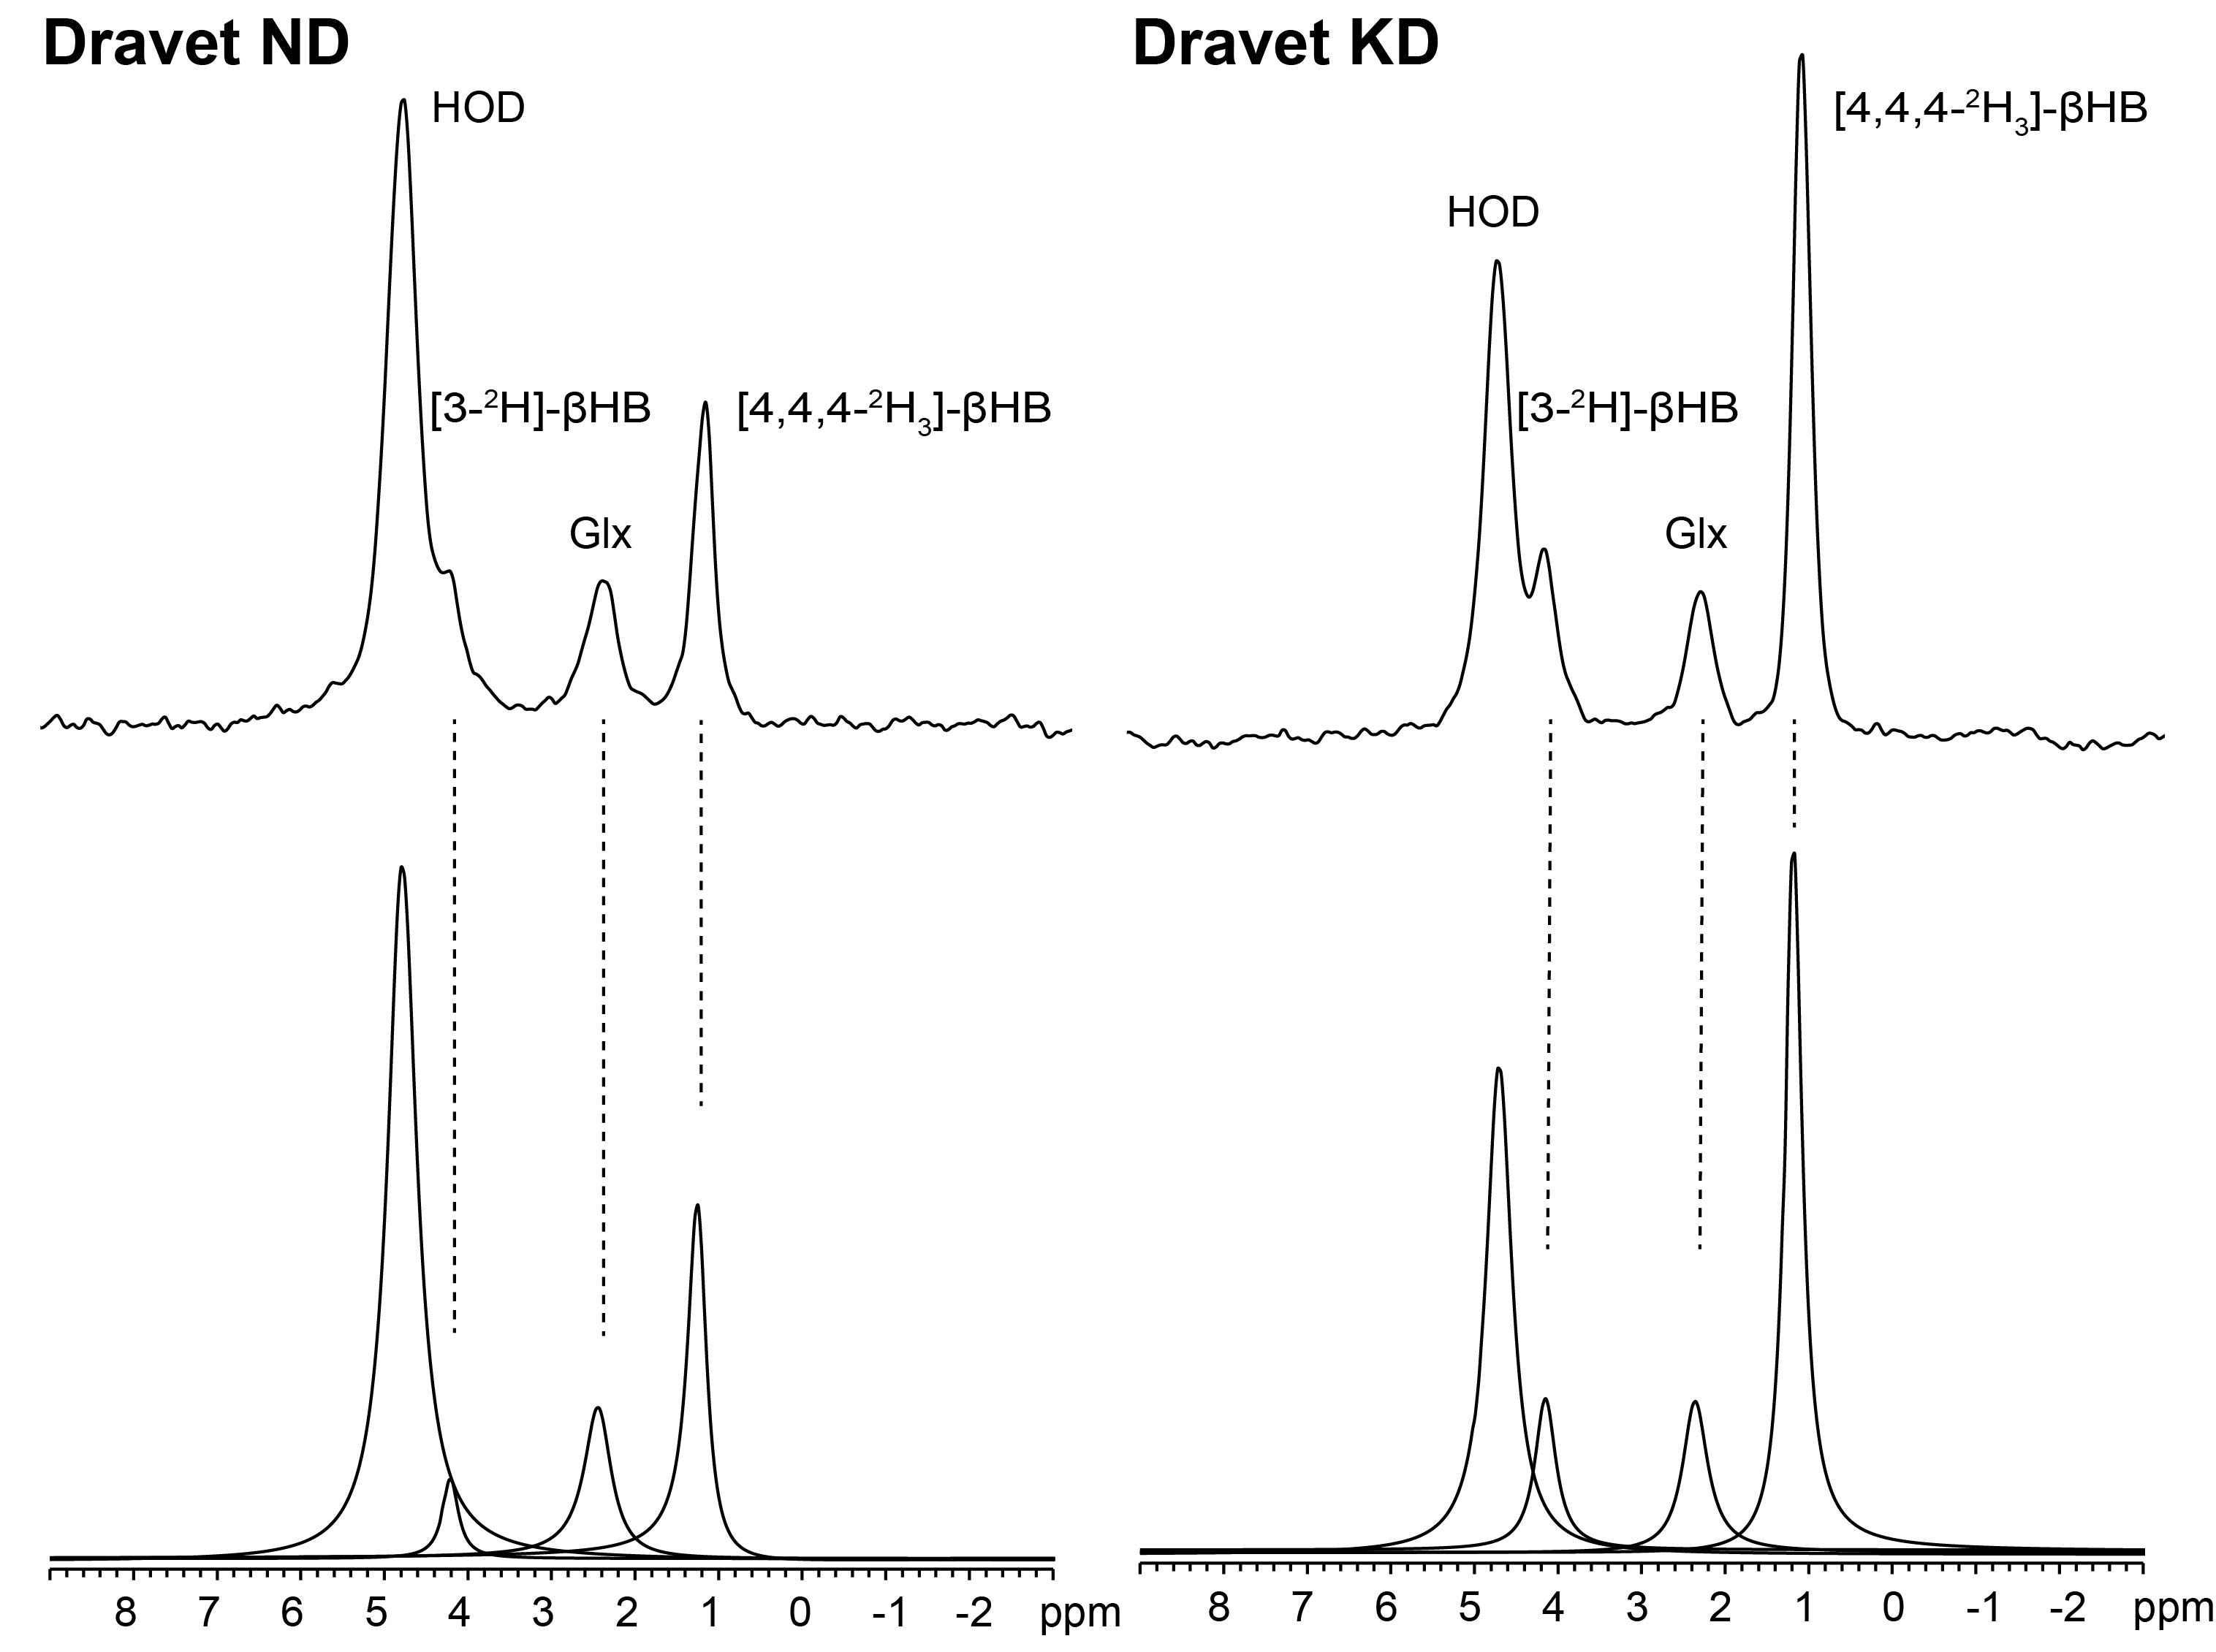
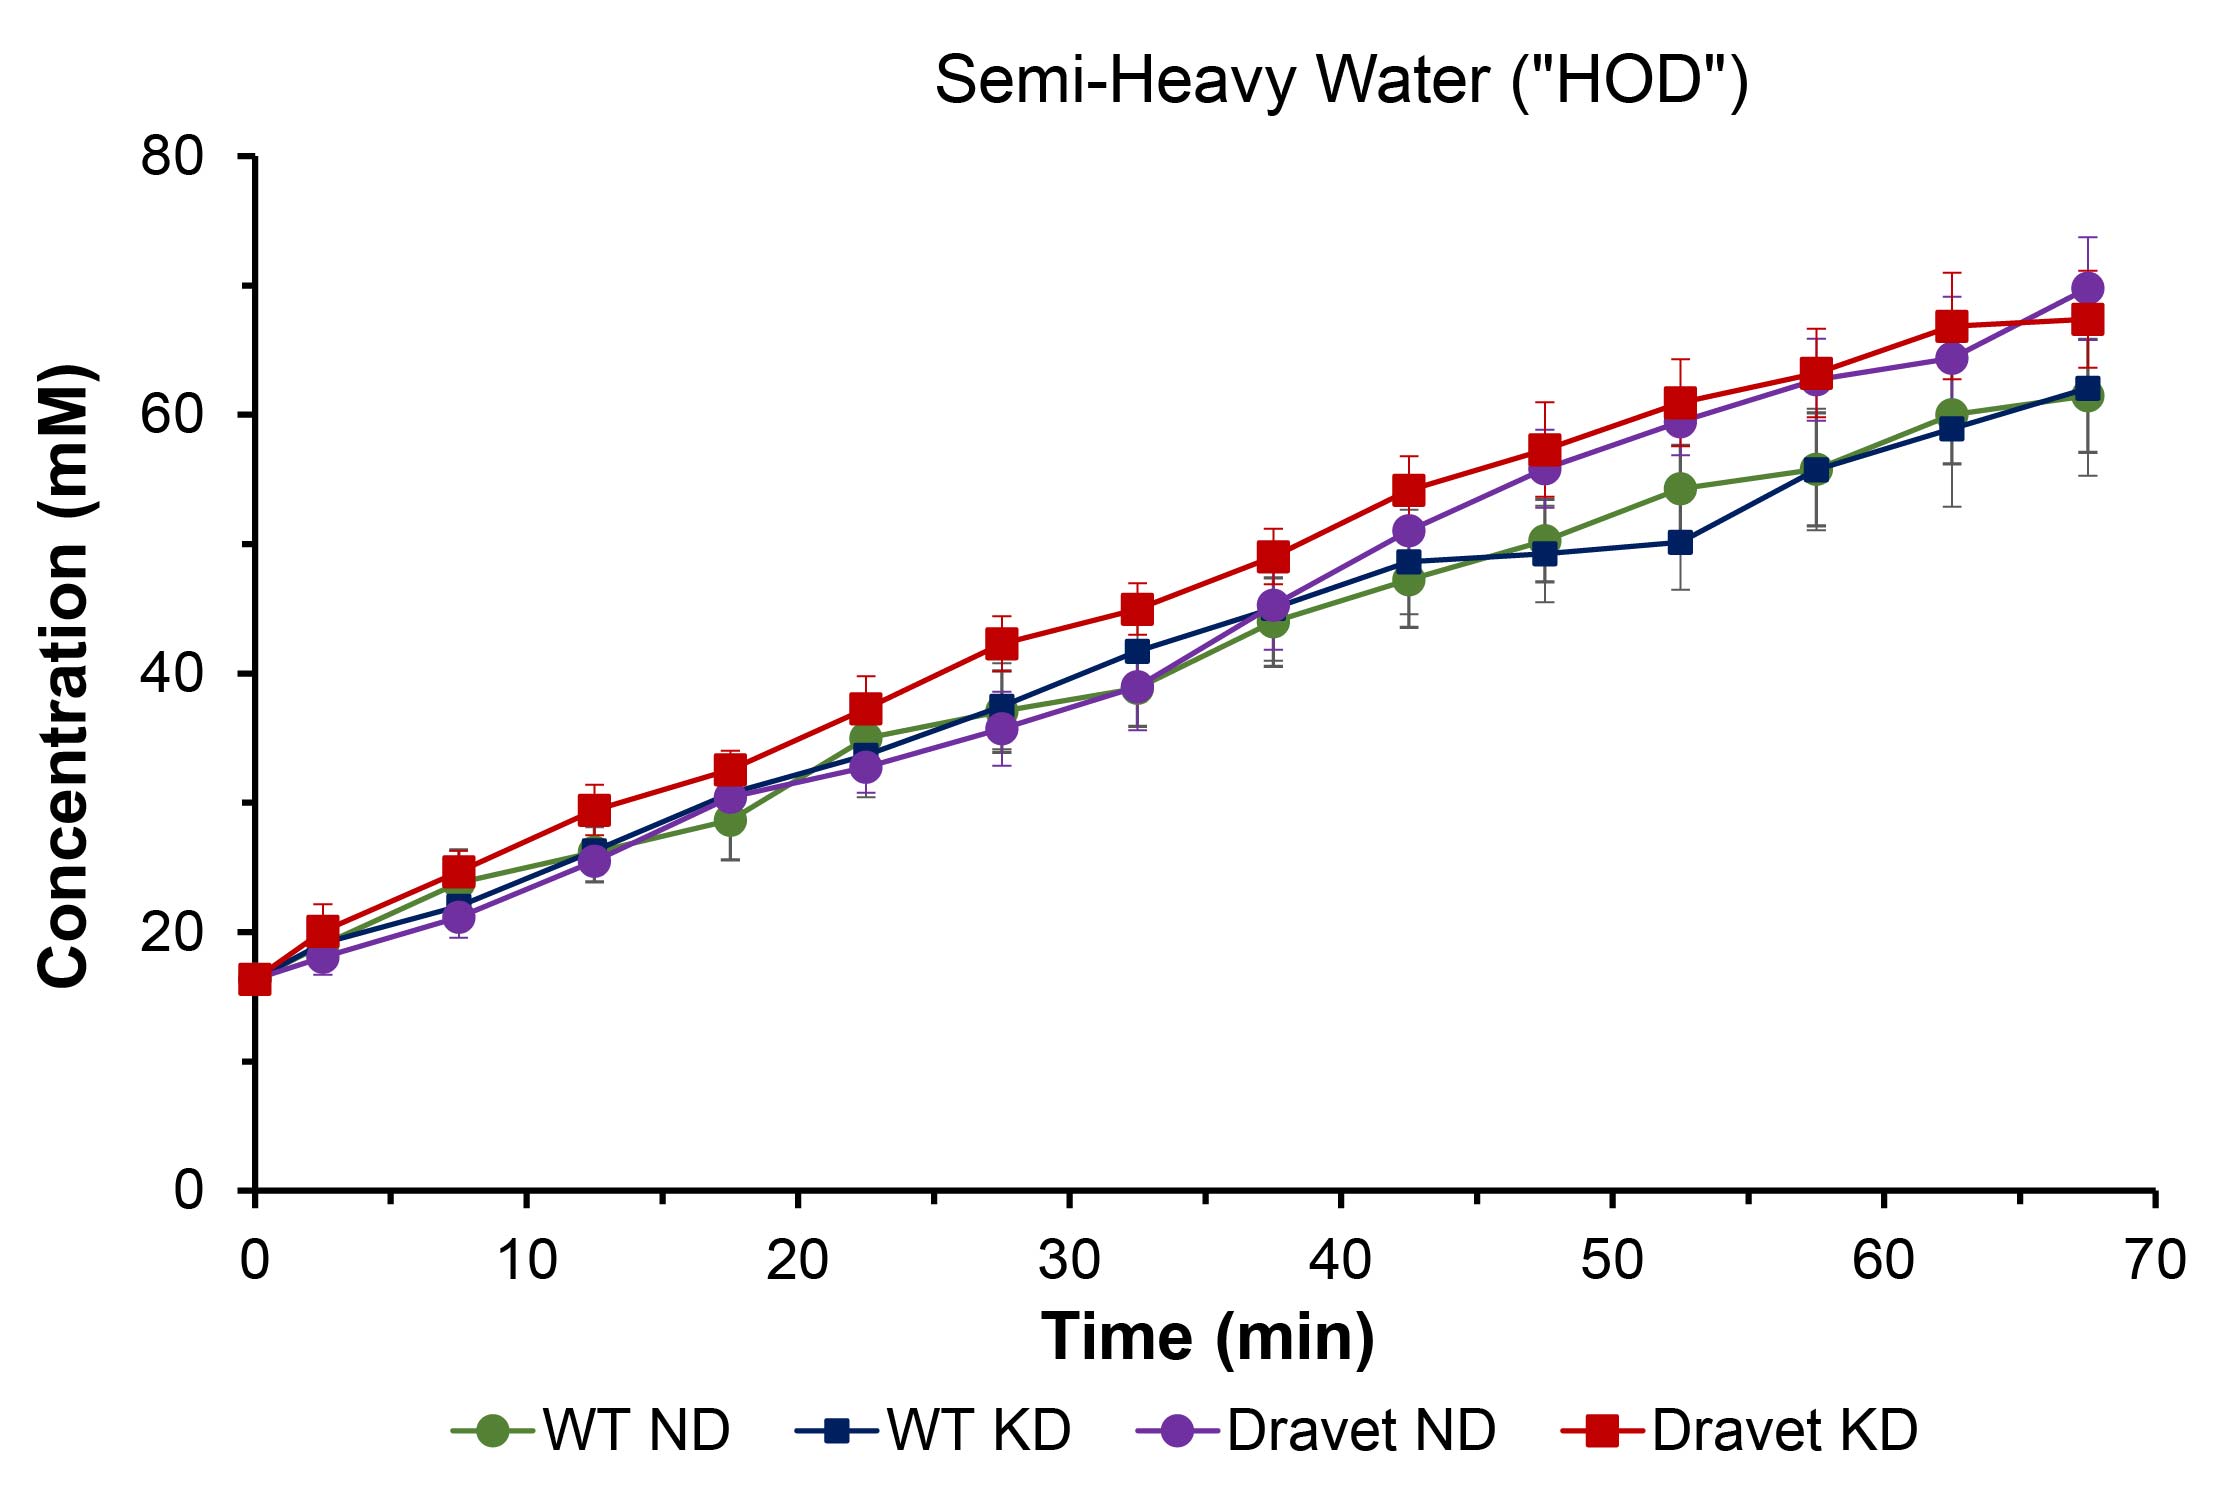
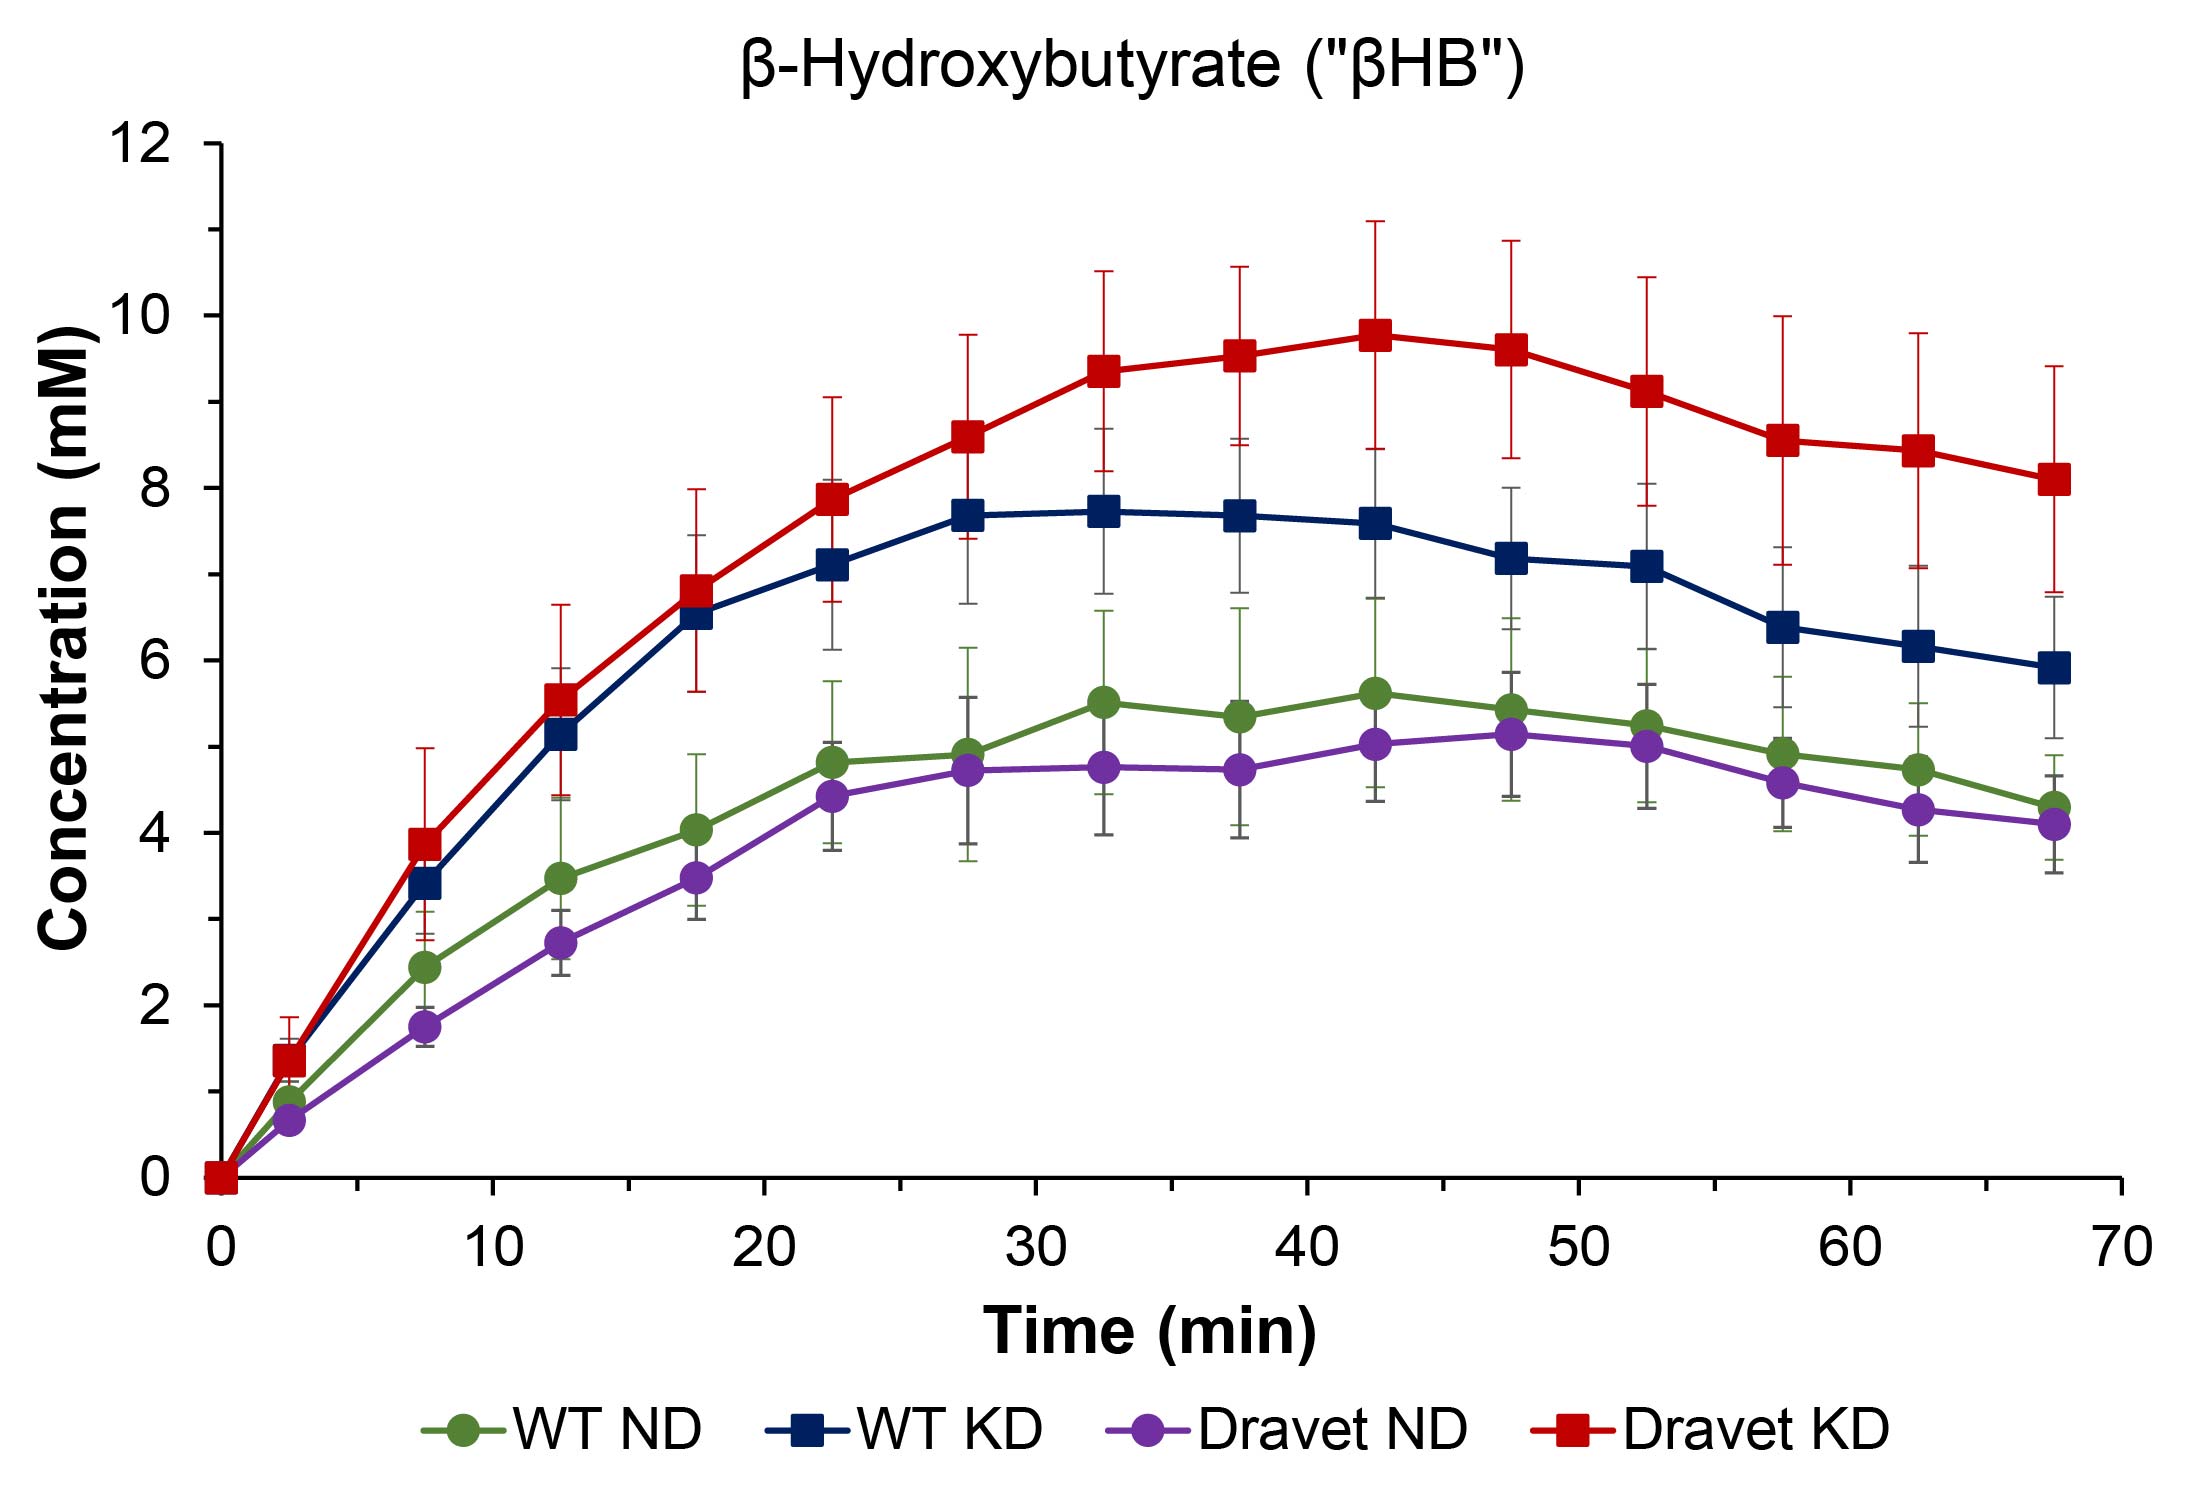
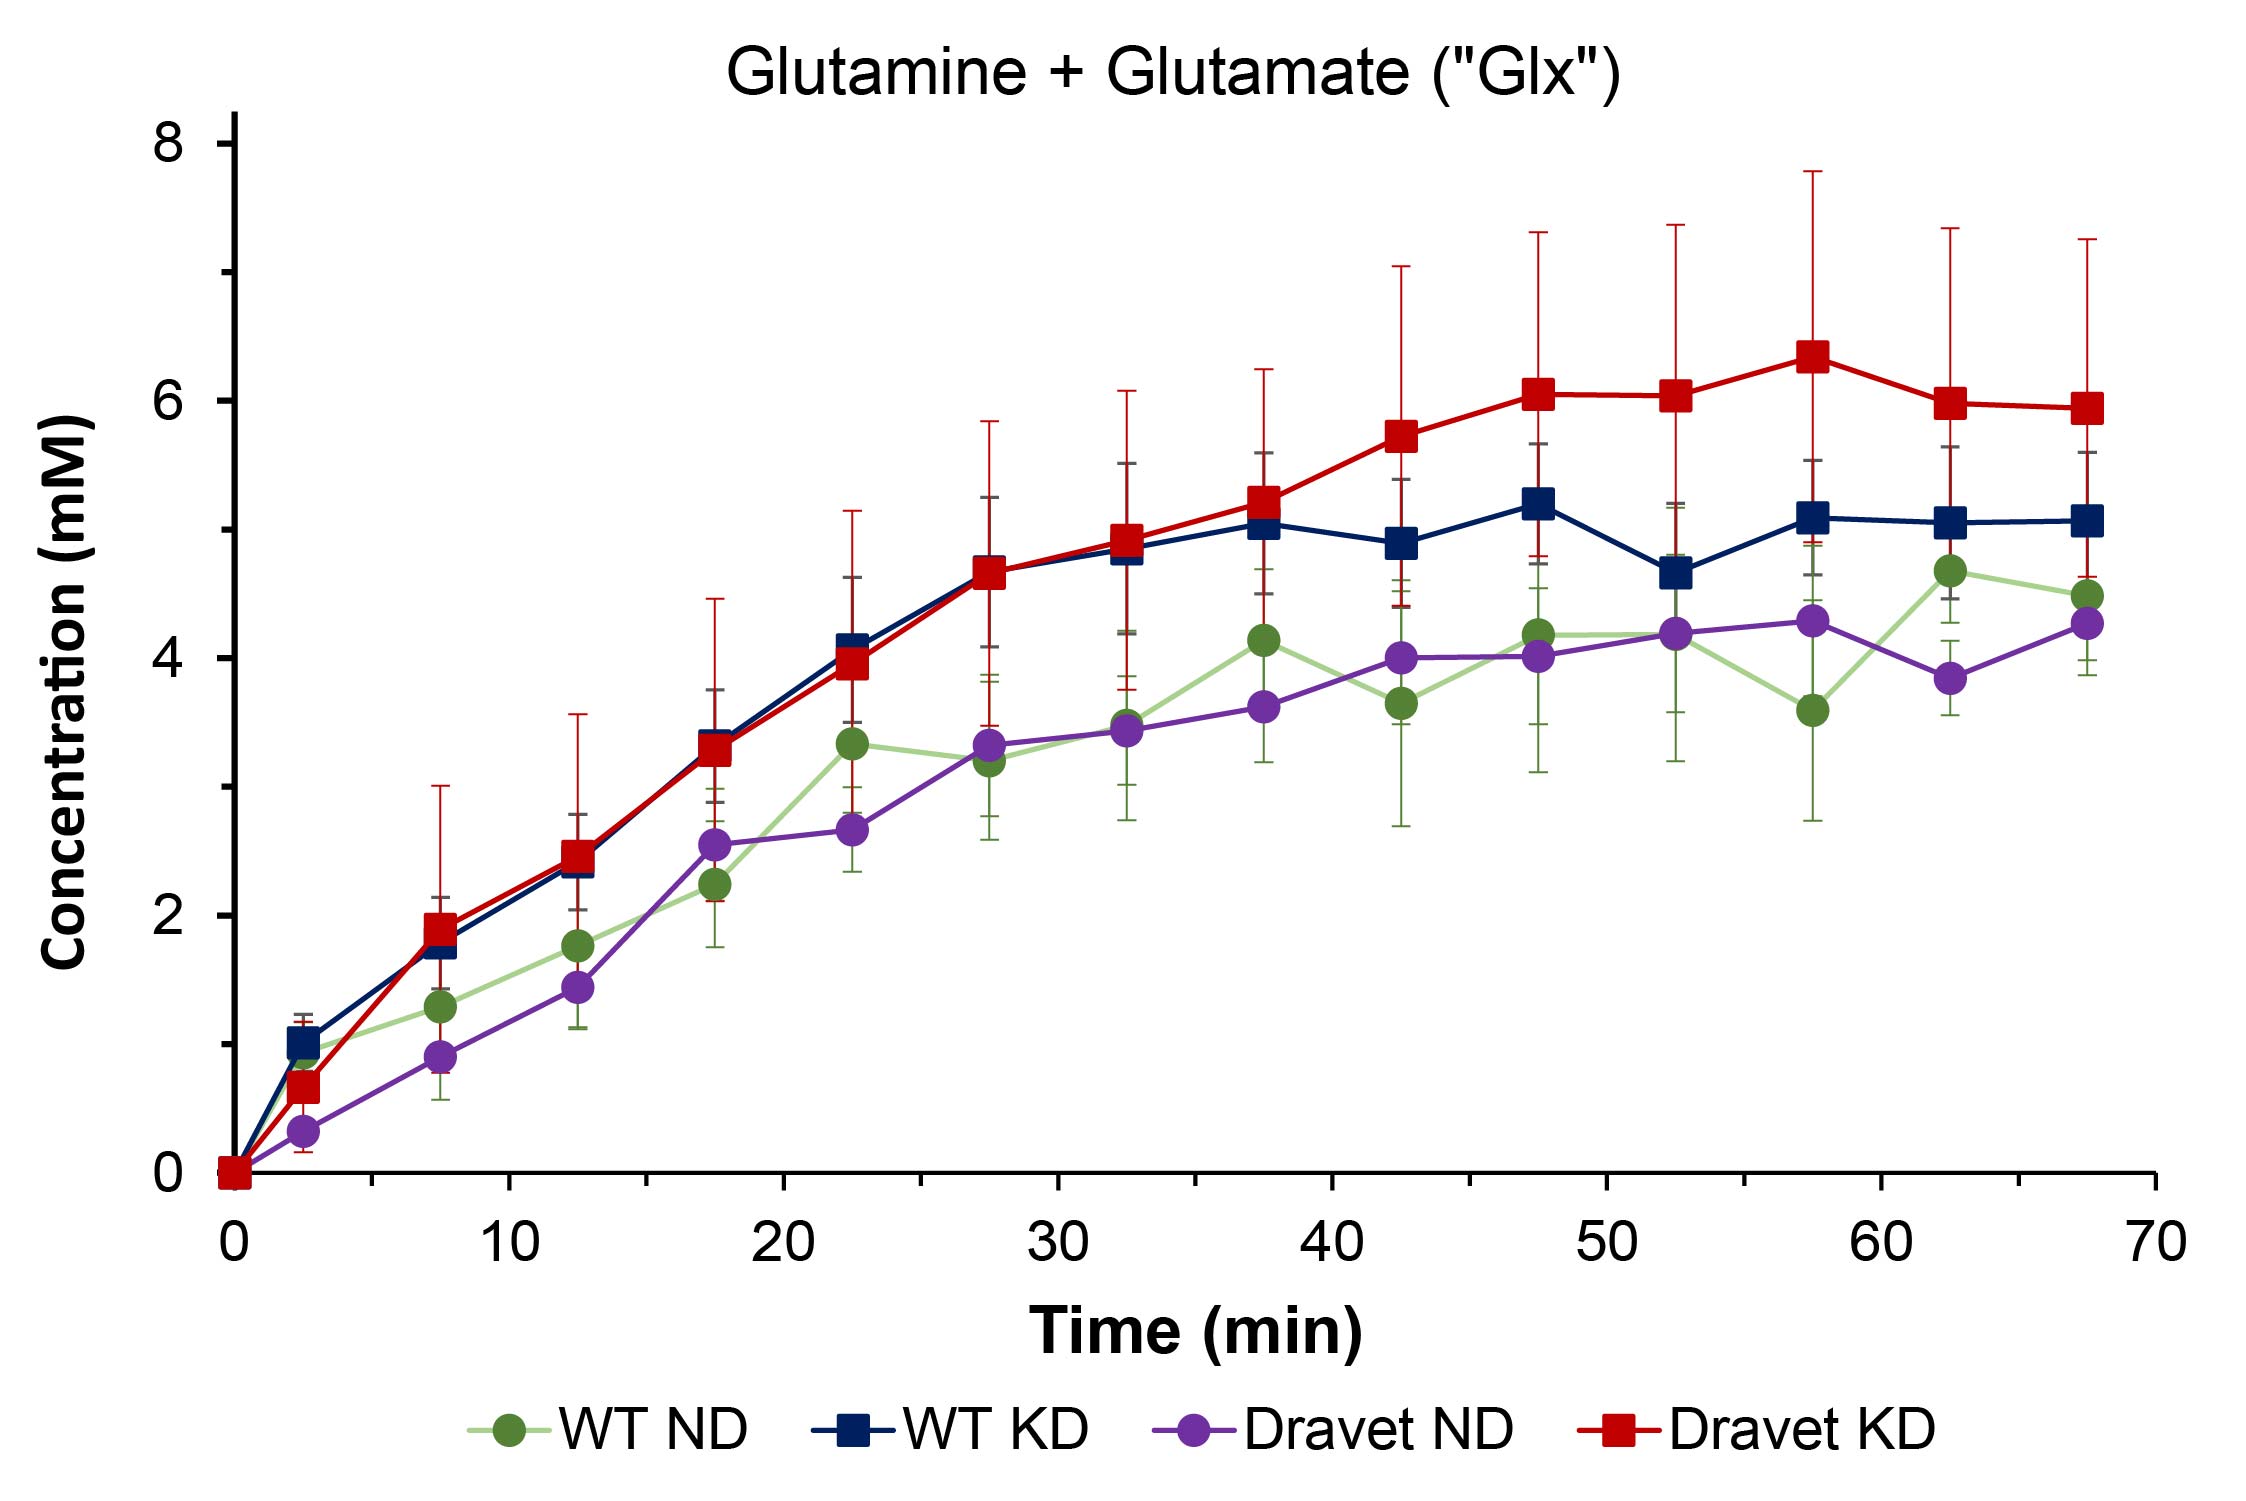
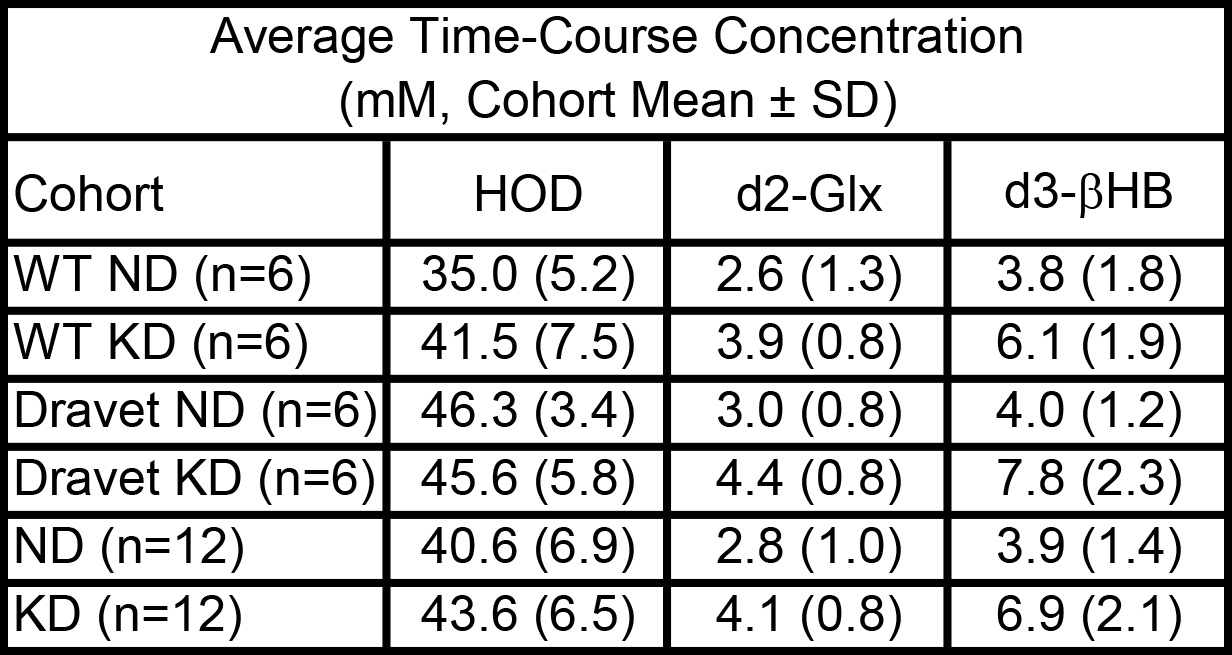
Figure 1 shows representative 2H single-voxel spectra summed over 70 minutes following sc administration of βHB for a Dravet mouse on ND (left panel) and a Dravet mouse on KD (right panel). Figures 2 – 4 are time-course plots of the brain aqueous concentrations (mM, mean ± SD) of HOD, βHB, and Glx, respectively, for the four cohorts. Figure 5 is a summary table for each of the four cohorts giving the HOD, βHB, and Glx concentrations (mM, mean ± SD) averaged over the 70-minute time course.Comparing all mouse cohorts on KD (n = 12) vs. ND (n = 12) reveals enhanced brain uptake of βHB (p < 0.001) with subsequent increase in Glx production (p < 0.002). Comparing Dravet mouse cohorts on KD (n = 6) vs. ND (n = 6) also shows enhanced brain uptake of βHB (p < 0.01) with subsequent increase in Glx production (p < 0.02). Average time-course concentrations of HOD are significantly lower in WT ND animals than in the three other groups.
Discussion
The time-course concentration of HOD following βHB administration reflects utilization of βHB and its metabolism to HOD, which takes place primarily in brain. The finding that the HOD concentration is lower in WT than Dravet mice on the ND suggests a fundamental difference in energy metabolism between the two groups, with the Dravet mice being better adapted to use βHB. Once WT animals are on the KD, their HOD concentration matches that of Dravet animals on or off the KD, indicating a switch from glucose towards βHB metabolism. Enhanced uptake of βHB with concomitant increase in Glx production is observed in all mice on the KD, evidence that the diet upregulates brain monocarboxylate transporters10,11.Conclusions
Deuterium MRS experiments following administration of βHB have demonstrated differences in metabolism between WT and Dravet mice, and changes in metabolism induced by the KD diet.Acknowledgements
The authors are pleased to acknowledge support from the Dravet Syndrome Foundation and JAM for Dravet, the Washington University Intellectual and Developmental Disabilities Center (P50 HD103525), the Alvin J Siteman Cancer Center (P30 CA091842) Small-Animal Cancer Imaging Shared Resource, and the Mallinckrodt Institute of Radiology and its Small-Animal MR Facility. We thank Professor Jennifer Kearney, Northwestern University, for supplying heterozygous mutant 129S6/SvEvTac male breeder mice.References
1. Miller AR, Hawkins NA, McCollom CE, Kearney, JA. Mapping genetic modifiers of survival in a mouse model of Dravet syndrome. Genes, Brain, and Behavior 2014;163-172.
2. Cardenal-Munoz E, Auvin S, Villanueva V, Cross JH, Zuberi SM, Lagae L, Aibar JA. Guidance on Dravet syndrome from infant to adult care: Road map for treatment planning in Europe. Epilepsia Open 2022;7:11-26.
3. Hawkins NA, Calhoun JD, Huffman AM, Kearney JA. Gene expression profiling in a mouse model of Dravet syndrome. Exp Neurol 2019;311:247-256.
4. Mlynarik V, Gambarota G, Frenkel H, Gruetter R. Localized short-echo-time proton MR spectroscopy with full signal-intensity acquisition. Magn Reson Med 2006;56(5):965-970.
5. Felmlee JP, Ehman RL. Spatial presaturation: a method for suppressing flow artifacts and improving depiction of vascular anatomy in MR imaging. Radiology 1987;164(2):559-564.
6. Ge X, Song K-H, Engelbach JA, Yuan L, Gao F, Dahiya S, Rich KM, Ackerman JJ, Garbow JR. Distinguishing Tumor Admixed in a Radiation Necrosis (RN) Background: 1H and 2H MR With a Novel Mouse Brain-Tumor/RN Model. Front Oncol 2022;12:885480.
7. Song K-H, Ge X, Engelbach JA, Thio LL, Neil JJ, Ackerman, JJH, Garbow JR. Subcutaneous deuterated substrate administration in mice: An alternative to tail vein infusion. Magn Reson Med 2023;Epub 2023/10/18, DOI 10.1002/mrm.29888.
8. De Feyter HM, Behar KL, Corbin ZA, Fulbright RK, Brown PB, McIntyre S, Nixon TW, Rothman DL, de Graaf RA. Deuterium metabolic imaging (DMI) for MRI-based 3D mapping of metabolism in vivo. Sci Adv 2018;4(8):eaat7314.
9. Soni ND, Swain A, Jacobs P, Juul H, Armbruster R, Nanga RPR, Nath K, Wiers C, Detre J, Reddy R. In vivo assessment of beta-hydroxybutyrate metabolism in mouse brain using deuterium (2H) MRS. Magn Reson Med 2023;90(1):259-269.
10. Miljanovic N, van Dijk RM, Buchecker V, Potschka H. Metabolomic signature of Dravet syndrome: A genetic mouse model study. Epilepsia. 2021; 62:2000-2014.
11. Duking T, Spieth L, Berghoff SA, Piepkorn L, Schmidke AM, Mitkovski M, et al. Ketogenic diet uncovers differential metabolic plasticity in brain cells. Sci Adv 2022;8:eabo7639.
12. Quirk JD, Bretthorst GL, Garbow JR, Ackerman JJH. Magnetic Resonance Data Modeling: The Bayesian Analysis Toolbox. Concepts Magn Reson Part A 2019;47A:e21467.
13. Hawkins RA, Williamson DE, Krebs HA. Ketone-body utilization by adult and suckling rat brain in vivo. Biochem. J 1971;122:13-18.
14. Robinson AM, Williamson DH. Physiological roles of ketone bodies as substrates and signals in mammalian tissues. Physiol. Rev. 1980; 60:143-187.
15. Kraus H, Sehlenker S, Schwedesky D. Developmental changes of cerebral ketone body utilization in human infants. Hoppe-Seykers Z. Physiol. Chem. 1974;355:164-170.
Figures