0700
Noninvasive assessment of liver fibrosis using multiple MRI parameters: an experimental study in rats1Department of Radiology, Union Hospital, Tongji Medical College, Huazhong University of Science and Technology, Wuhan, China, 2Philips Healthcare, No. 1628, Zhongshan Road, Wuhan, China
Synopsis
Keywords: Preclinical Image Analysis, Diffusion/other diffusion imaging techniques, liver fibrosis, multiparametric MRI, T1rho
Motivation: Early detection and noninvasive assessment of liver fibrosis are significant in clinical practice.
Goal(s): Liver biopsy have some drawbacks for staging liver fibrosis. We aimed to investigated the value of T1ρ, DKI, and IVIM in assessment of liver fibrosis and established an optimal diagnostic model.
Approach: Twenty four thioacetamide (TAA)-treated rats and six control rats were included in this experimental study. All rats were scanned with 3.0T MRI machine. Corresponding imaging parameters were measured and compared among different fibrosis stages.
Results: T1ρ and MD derived from DKI had better diagnostic performance than other parameters. Their combination model further improved the diagnostic efficiency.
Impact: T1ρ and DKI could easily incorporated into routine liver MR imaging. The model combining T1ρ and MD derived from DKI was promising to be a noninvasive biomarker to detect and accurately stage liver fibrosis in the clinical practice.
Introduction
Liver fibrosis is a common feature of various etiologies, such as viral hepatitis, autoimmune hepatitis and biliary disease, and may eventually progress to cirrhosis or hepatocellular carcinoma1,2. T1 relaxation times in the rotating frame (T1ρ), diffusion kurtosis imaging (DKI), and intravoxel incoherent motion (IVIM) imaging have the benefit of easy incorporation into routine liver MR imaging. However, conflicting conclusions were obtained when diagnosing liver fibrosis with one of the above mentioned MRI techniques in some clinical and animal studies3,4. Therefore, we designed this experimental study to investigate the efficacy of imaging parameters derived from T1ρ, DKI and IVIM for staging liver fibrosis in rats which were scanned with the same 3.0T MRI machine. In addition, we intended to establish an optimal diagnostic model based on multiparametric MRI for staging liver fibrosis.Methods
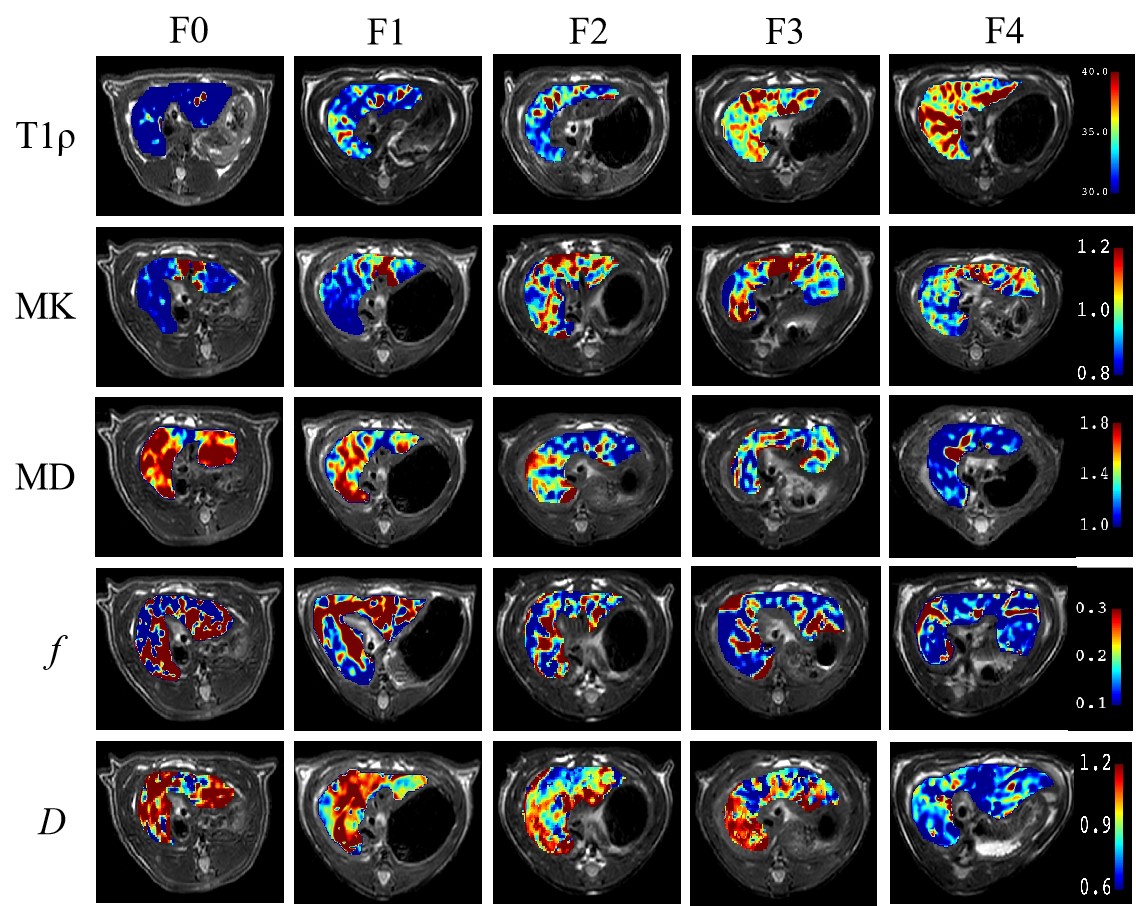
Thirty male Sprague-Dawley rats (age 8 weeks, 200 ± 20 g) were were randomly divided into four experimental group and one control group (n = 6 for each group). To induce liver fibrosis, the rats in the experimental group were administered thioacetamide (TAA; Sigma-Aldrich, Spain) dissolved in normal saline by intraperitoneal injection three times a week at a dose of 250 mg/kg for 2, 4, 6, and 8 weeks, respectively5,6. The rats in the control group were intraperitoneal injected normal saline as the same dose and frequency for 8 weeks. A 3.0T MRI machine (Ingenia 3.0T, Philips Healthcare, Best, Netherlands), equipped with a eight-channel phased-array rat coil with a 70-mm diameter (Shanghai Chenguang Medical Technologies, China), was used for scanning. T1ρ, DKI, and IVIM imaging were performed, corresponding parameters were measured using IntelliSpace Portal, version 10 (Philips Healthcare, Netherlands) and compared among different fibrosis stages. An optimal diagnostic model was established and the diagnostic efficiency was evaluated with receiver operating characteristic (ROC) curve analysis.Results
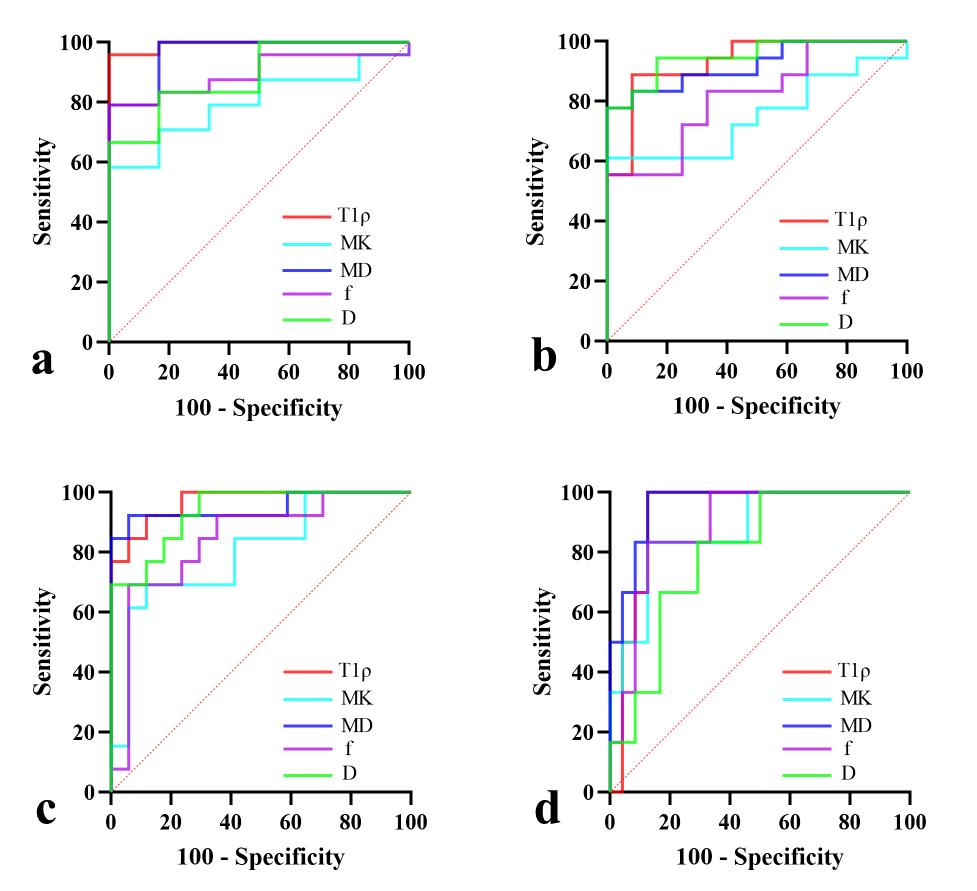
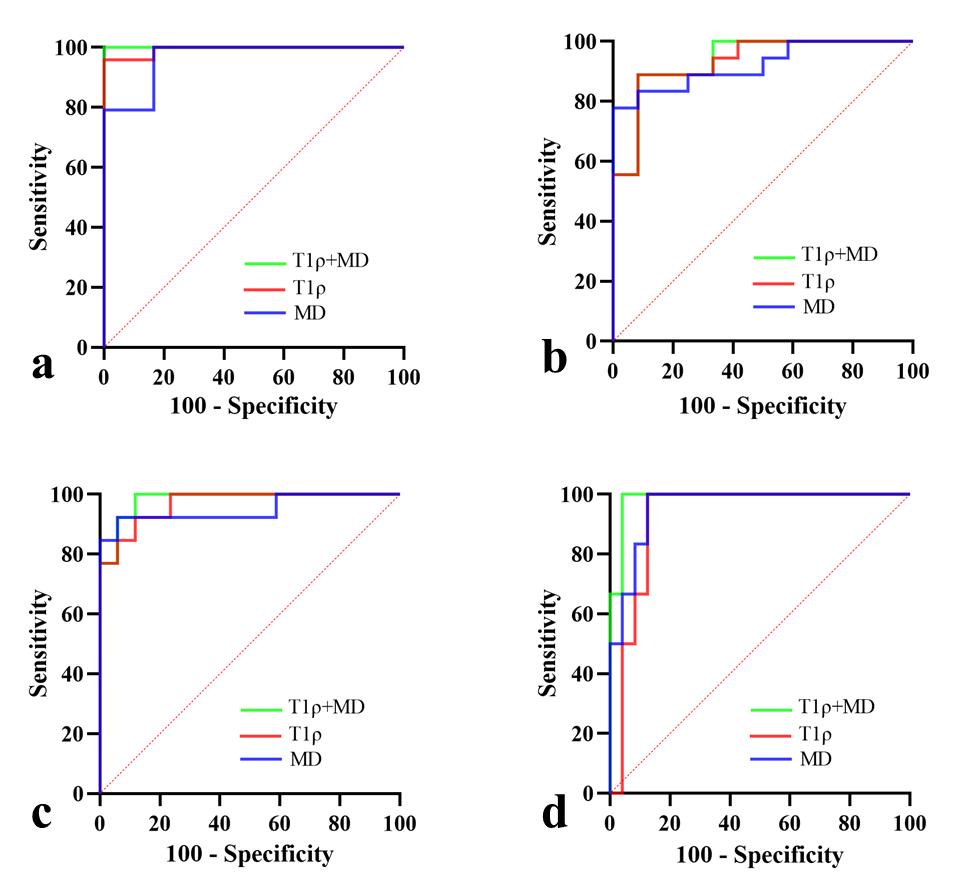
There were 6, 6, 5, 7, 6 rats designated into stage F0, F1, F2, F3, and F4, respectively. T1ρ, MD and D all had strong correlations with histopathological scores (Sirius red and αSMA-positive ratio). The mean AUC values, sensitivity, and specificity of T1ρ and MD across all liver fibrosis stages were comparable but much higher than those of other imaging parameters (0.954, 92.46, 91.85 for T1ρ; 0.949, 92.52, 91.24 for MD). The model combining T1ρ and MD exhibited better diagnostic performance with higher AUC values than any individual method for staging liver fibrosis (≥ F1: 1.000 (0.884-1.000); ≥ F2: 0.935 (0.782-0.992); ≥ F3: 0.982 (0.852-1.000); F4: 0.986 (0.859-1.000)).Discussion
In our study, we found that T1ρ, MD and D all had strong correlations with histopathological scores (Sirius red and αSMA-positive ratio). When comparing the diagnostic efficiency of parameters derived from T1ρ, DKI and IVIM for staging liver fibrosis, our study suggested that T1ρ and MD had higher mean AUC values, sensitivity and specificity than others across all fibrosis stages. It is known that T1ρ reflects the macromolecular composition and proton exchange in tissues7; while MD not only potentially better reflects water diffusivity in tissues at high b values, but also contains specific information on the non-Gaussian diffusion behavior8. Therefore, MD derived from DKI may provide T1ρ with added information. Based on this conception, we established a predictive model combining T1ρ and MD to stage liver fibrosis and compared the diagnostic efficiency with T1ρ or MD alone. The results revealed that the combination model performed better with larger AUC values than any individual parameter across all fibrosis stages (AUC = 0.935-1.000). Our study suggested that the combination model might be a credible diagnostic biomarker to detect and accurately stage liver fibrosis.Conclusion
Among the evaluated parameters, T1ρ and MD derived from DKI both strongly correlated with histopathological scores and were superior for staging liver fibrosis. The model combining T1ρ and MD was promising to be a noninvasive biomarker to detect and accurately stage liver fibrosis in the clinical practice.Acknowledgements
This study was supported by the National Natural Science Foundation of China (Grant No. 82001788) and Natural Science Foundation of Hubei Province (Grant No. 2020CFB410).References
1. Parola M, Pinzani M. Liver fibrosis: Pathophysiology, pathogenetic targets and clinical issues. Mol Aspects Med. 2019;65:37-55.
2. Ginès P, Krag A, Abraldes JG, et al. Liver cirrhosis. Lancet. 2021;398(10308):1359-1376.
3. Lai M, Afdhal NH. Liver Fibrosis Determination. Gastroenterol Clin North Am. 2019;48(2):281-289.
4. Petitclerc L, Sebastiani G, Gilbert G, et al. Liver fibrosis: Review of current imaging and MRI quantification techniques. J Magn Reson Imaging. 2017;45(5):1276-1295.
5. Vilaseca M, García-Calderó H, Lafoz E, et al. The anticoagulant rivaroxaban lowers portal hypertension in cirrhotic rats mainly by deactivating hepatic stellate cells. Hepatology. 2017;65(6):2031-2044.
6. Zhang X, Guo Q, Shi Y, et al. 99mTc-3PRGD2 scintigraphy to stage liver fibrosis and evaluate reversal after fibrotic stimulus withdrawn. Nucl Med Biol. 2017;49:44-49.
7. Gilani IA, Sepponen R. Quantitative rotating frame relaxometry methods in MRI. NMR Biomed. 2016;29(6):841-861.
8. Bataller R, Brenner DA. Liver fibrosis. J Clin Invest. 2005;115(2):209-218.
Figures
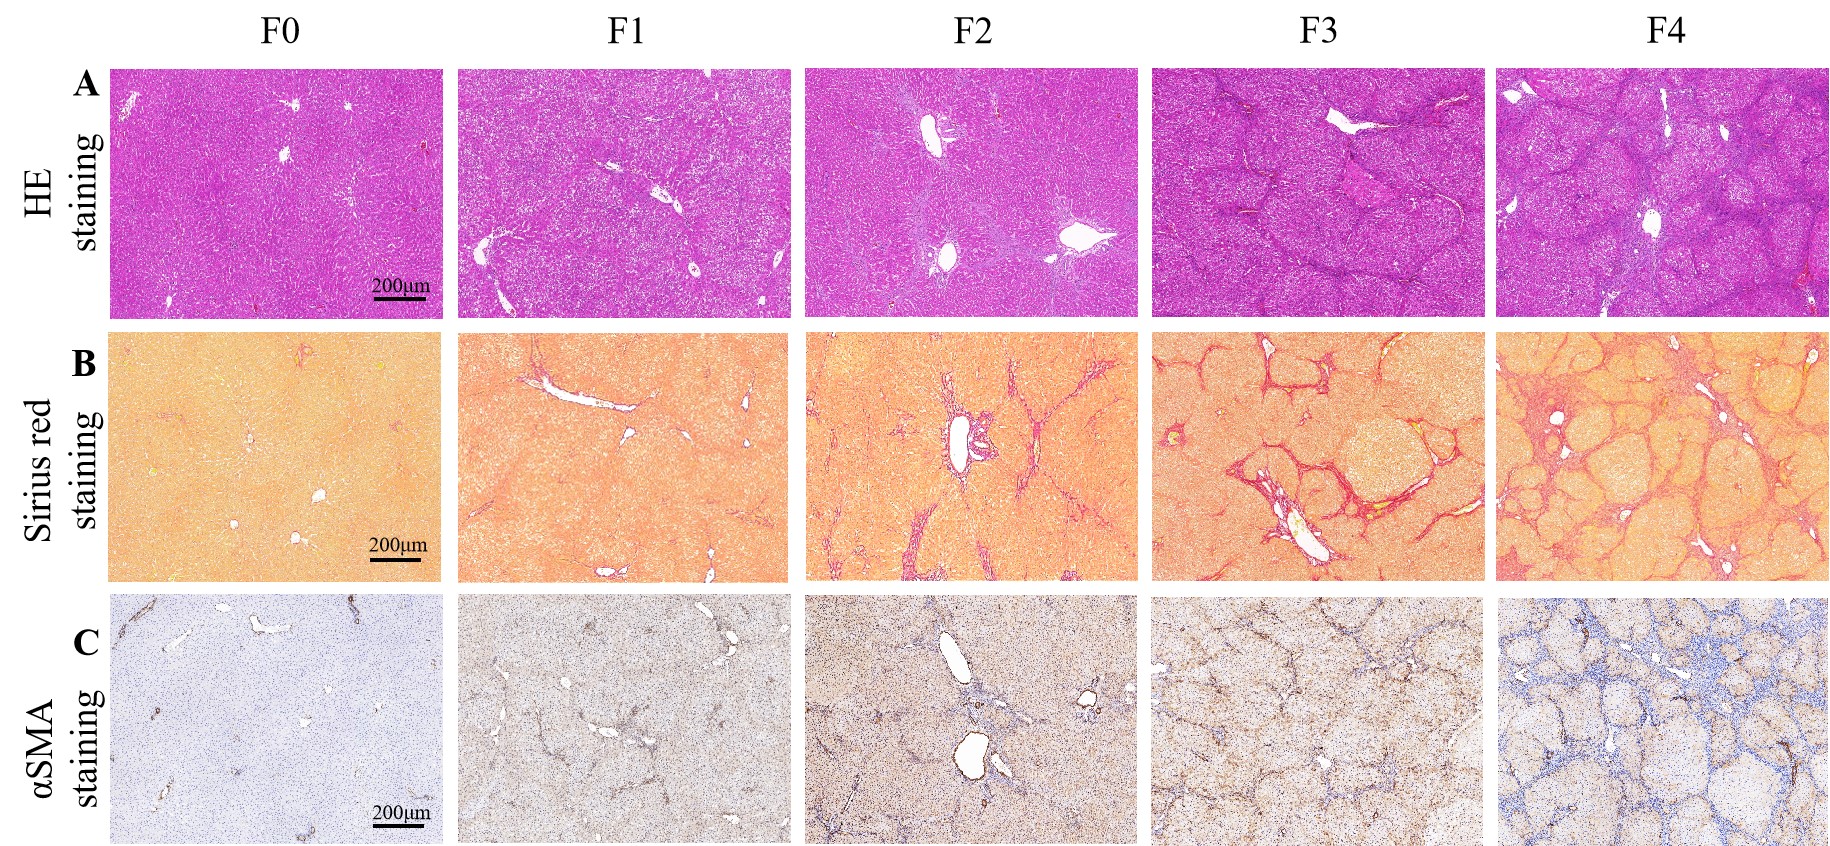
Figure 1. Representative histopathological examples of different liver fibrosis stages. A, hematoxylin-eosin (HE) staining; B, Sirius red staining; C, αSMA staining.