0692
3D Dynamic Contrast-Enhanced MR Fingerprinting for Quantitative CSF Transport Mapping in Mouse Brain at 9.4T1Department of Biomedical Engineering, Case Western Reserve University, Cleveland, OH, United States, 2Department of Biomedical Engineering, University of Michigan, Ann Arbor, MI, United States, 3Department of Radiology, Case Western Reserve University, Cleveland, OH, United States, 4Department of Pediatrics, Case Western Reserve University, Cleveland, OH, United States, 5Department of Physiology and Biophysics, Case Western Reserve University, Cleveland, OH, United States
Synopsis
Keywords: Neurofluids, Neurofluids, Contrast Agent, Quantitative MR, Glymphatic System
Motivation: Quantitative MR provides the opportunity of quantifying concentration of contrast agent and its transport in cerebrospinal fluid (CSF) in the whole brain.
Goal(s): To develop a fast multi-parametric mapping method tailored to dynamically and quantitatively assessing Gd-DTPA transport in mouse brain.
Approach: We designed and validated a new 3D MR fingerprinting (MRF) sequence with subspace-based reconstruction to simultaneously track T1 and T2 changes in mouse brain following intrathecal contrast infusion with a temporal resolution of <4.5 min at 9.4T.
Results: Dynamic T1 and T2 changes allowed direct quantification of transport kinetics in different brain regions between multiple subjects without normalization.
Impact: We present the first 3D MR fingerprinting method for dynamic quantification of contrast agent transport in rodent brains. With unprecedented speed, accuracy, and robustness, our method offers unlimited opportunities for multi-parametric quantification in various preclinical imaging applications.
Introduction
Dynamic contrast-enhanced MRI (DCE-MRI) has been widely used to study solute transport in cerebrospinal fluid (CSF) circulation in rodents, contributing significantly to the characterization of the recently recognized glymphatic system1–3. Most of these studies involve tracking of intrathecally administered contrast agents by weighted MRI methods1,4–6. Although weighted MRI images reflect contrast agent dynamics, parametric mapping methods are desired for the quantification of absolute contrast-agent concentrations7. In this study, we developed a novel 3D MR fingerprinting (MRF) method with a temporal resolution of <4.5 min to provide simultaneous, co-registered, and dynamic T1 and T2 mapping of Gd-DTPA transport in CSF in mouse.Methods
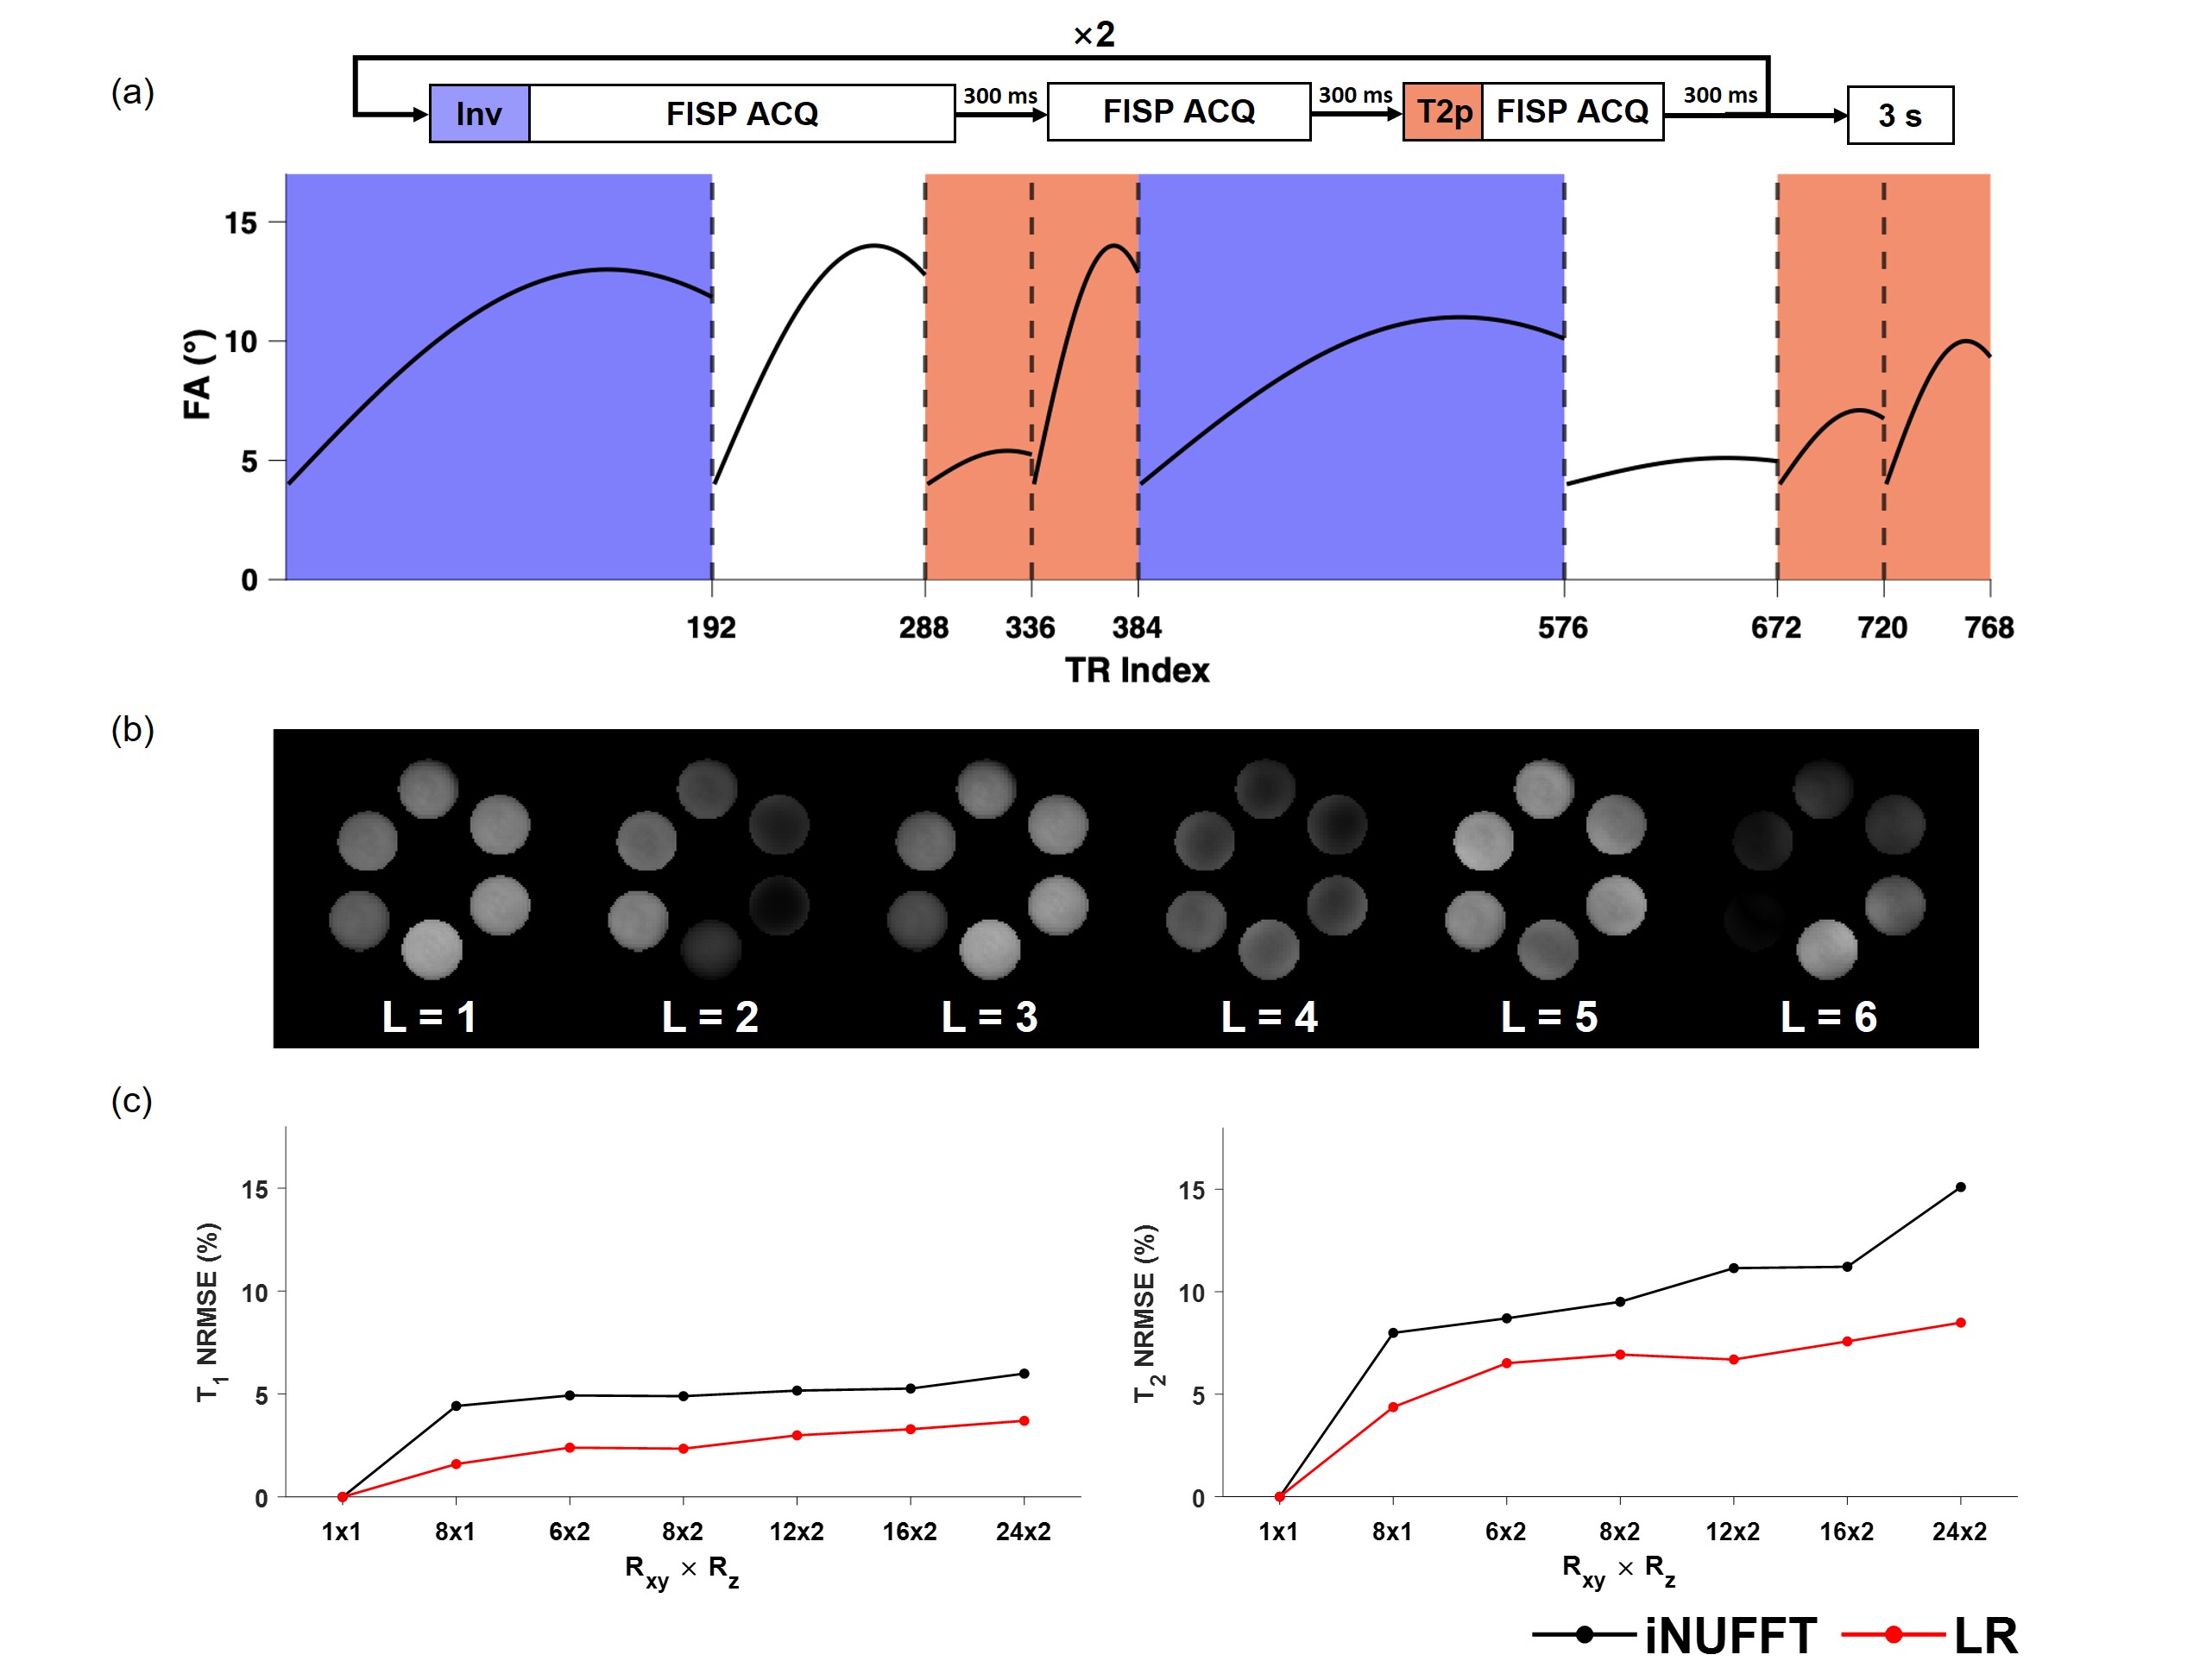
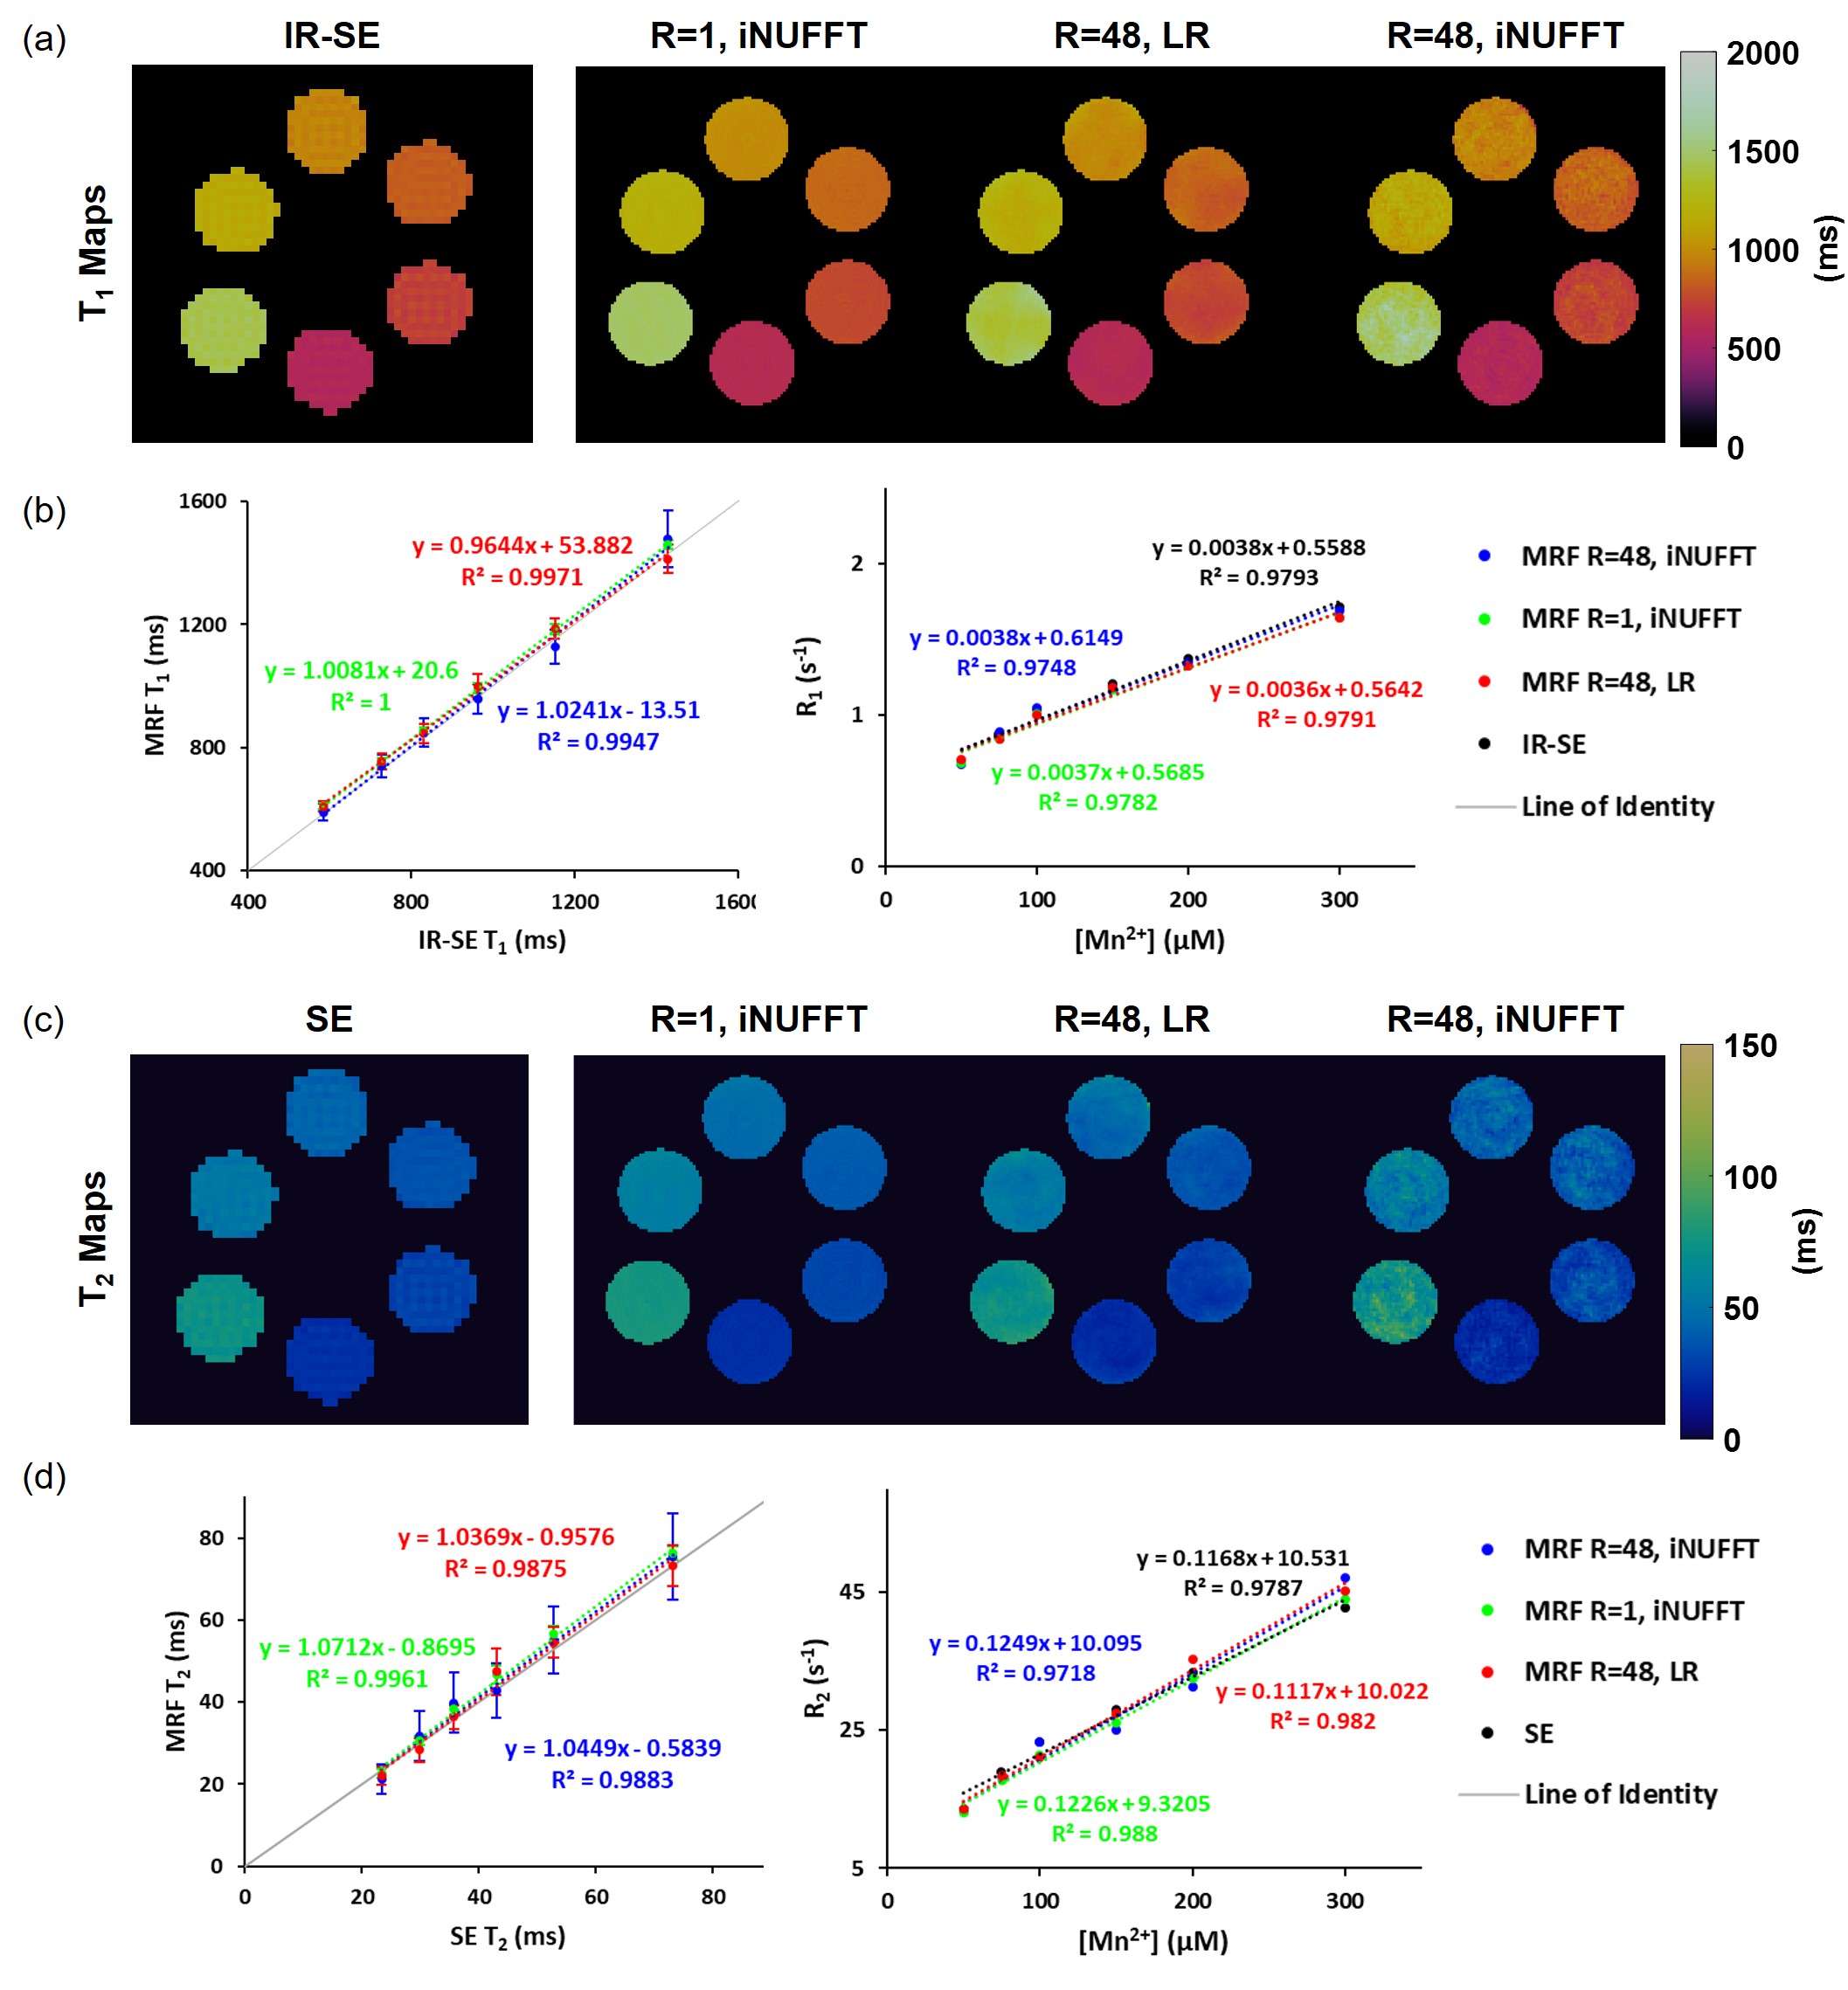
MRF Sequence and Reconstruction: The 3D MRF sequence consisted of 8 segments of FISP acquisitions with varying flip angles, with 2 segments preceded by inversion preparation and 4 segments preceded by T2 preparations (Figure 1(a)). A stack-of-spirals (SOS) trajectory was used with undersampling in both in-plane and through-plane directions. The dynamic MRF acquisition parameters were: 768 time frames per fingerprint; TR/TE, 10/2 ms; FOV, 30×30×10 mm3; matrix size, 156×156×20; total undersampling factors (R), 48; yielding a spatial resolution of 0.192×0.192×0.5 mm3 and a temporal resolution of 4 min 20 s. Model-based reconstruction by low-rank (LR) subspace modeling was used to improve the accuracy of MRF8.Experimental Protocol: MRI studies were performed on a Bruker 9.4T scanner, using a volume coil as the transmitter and a 4-channel phase-array coil as the receiver coil. Spin-echo (SE) and inversion-recovery spin-echo (IR-SE) were used to validate MRF results in a multi-compartment phantom with variable Mn2+ concentrations. Male C57BL/6J mice (n=5, 10-12-week-old) were anesthetized with 1-1.5% isoflurane and administered 10 μL of 12.5 mM Gd-DTPA via cisterna magna (0.33 μL/min for 30 min). One MRF acquisition was acquired at baseline before Gd-DTPA infusion, followed by 31 MRF scans, for a total scan time of 135 min.
Data Analysis: All image reconstruction and analyses were performed using in-house developed or open-source Python or MATLAB software9–11. Motion-corrected maps were co-registered onto one representative mouse by affine transformation. Regions of interest (ROIs) were generated by placing spherical volumes in various anatomical locations. ΔR1 and ΔR2 time curves were calculated from the dynamic T1 and T2 maps.
Results
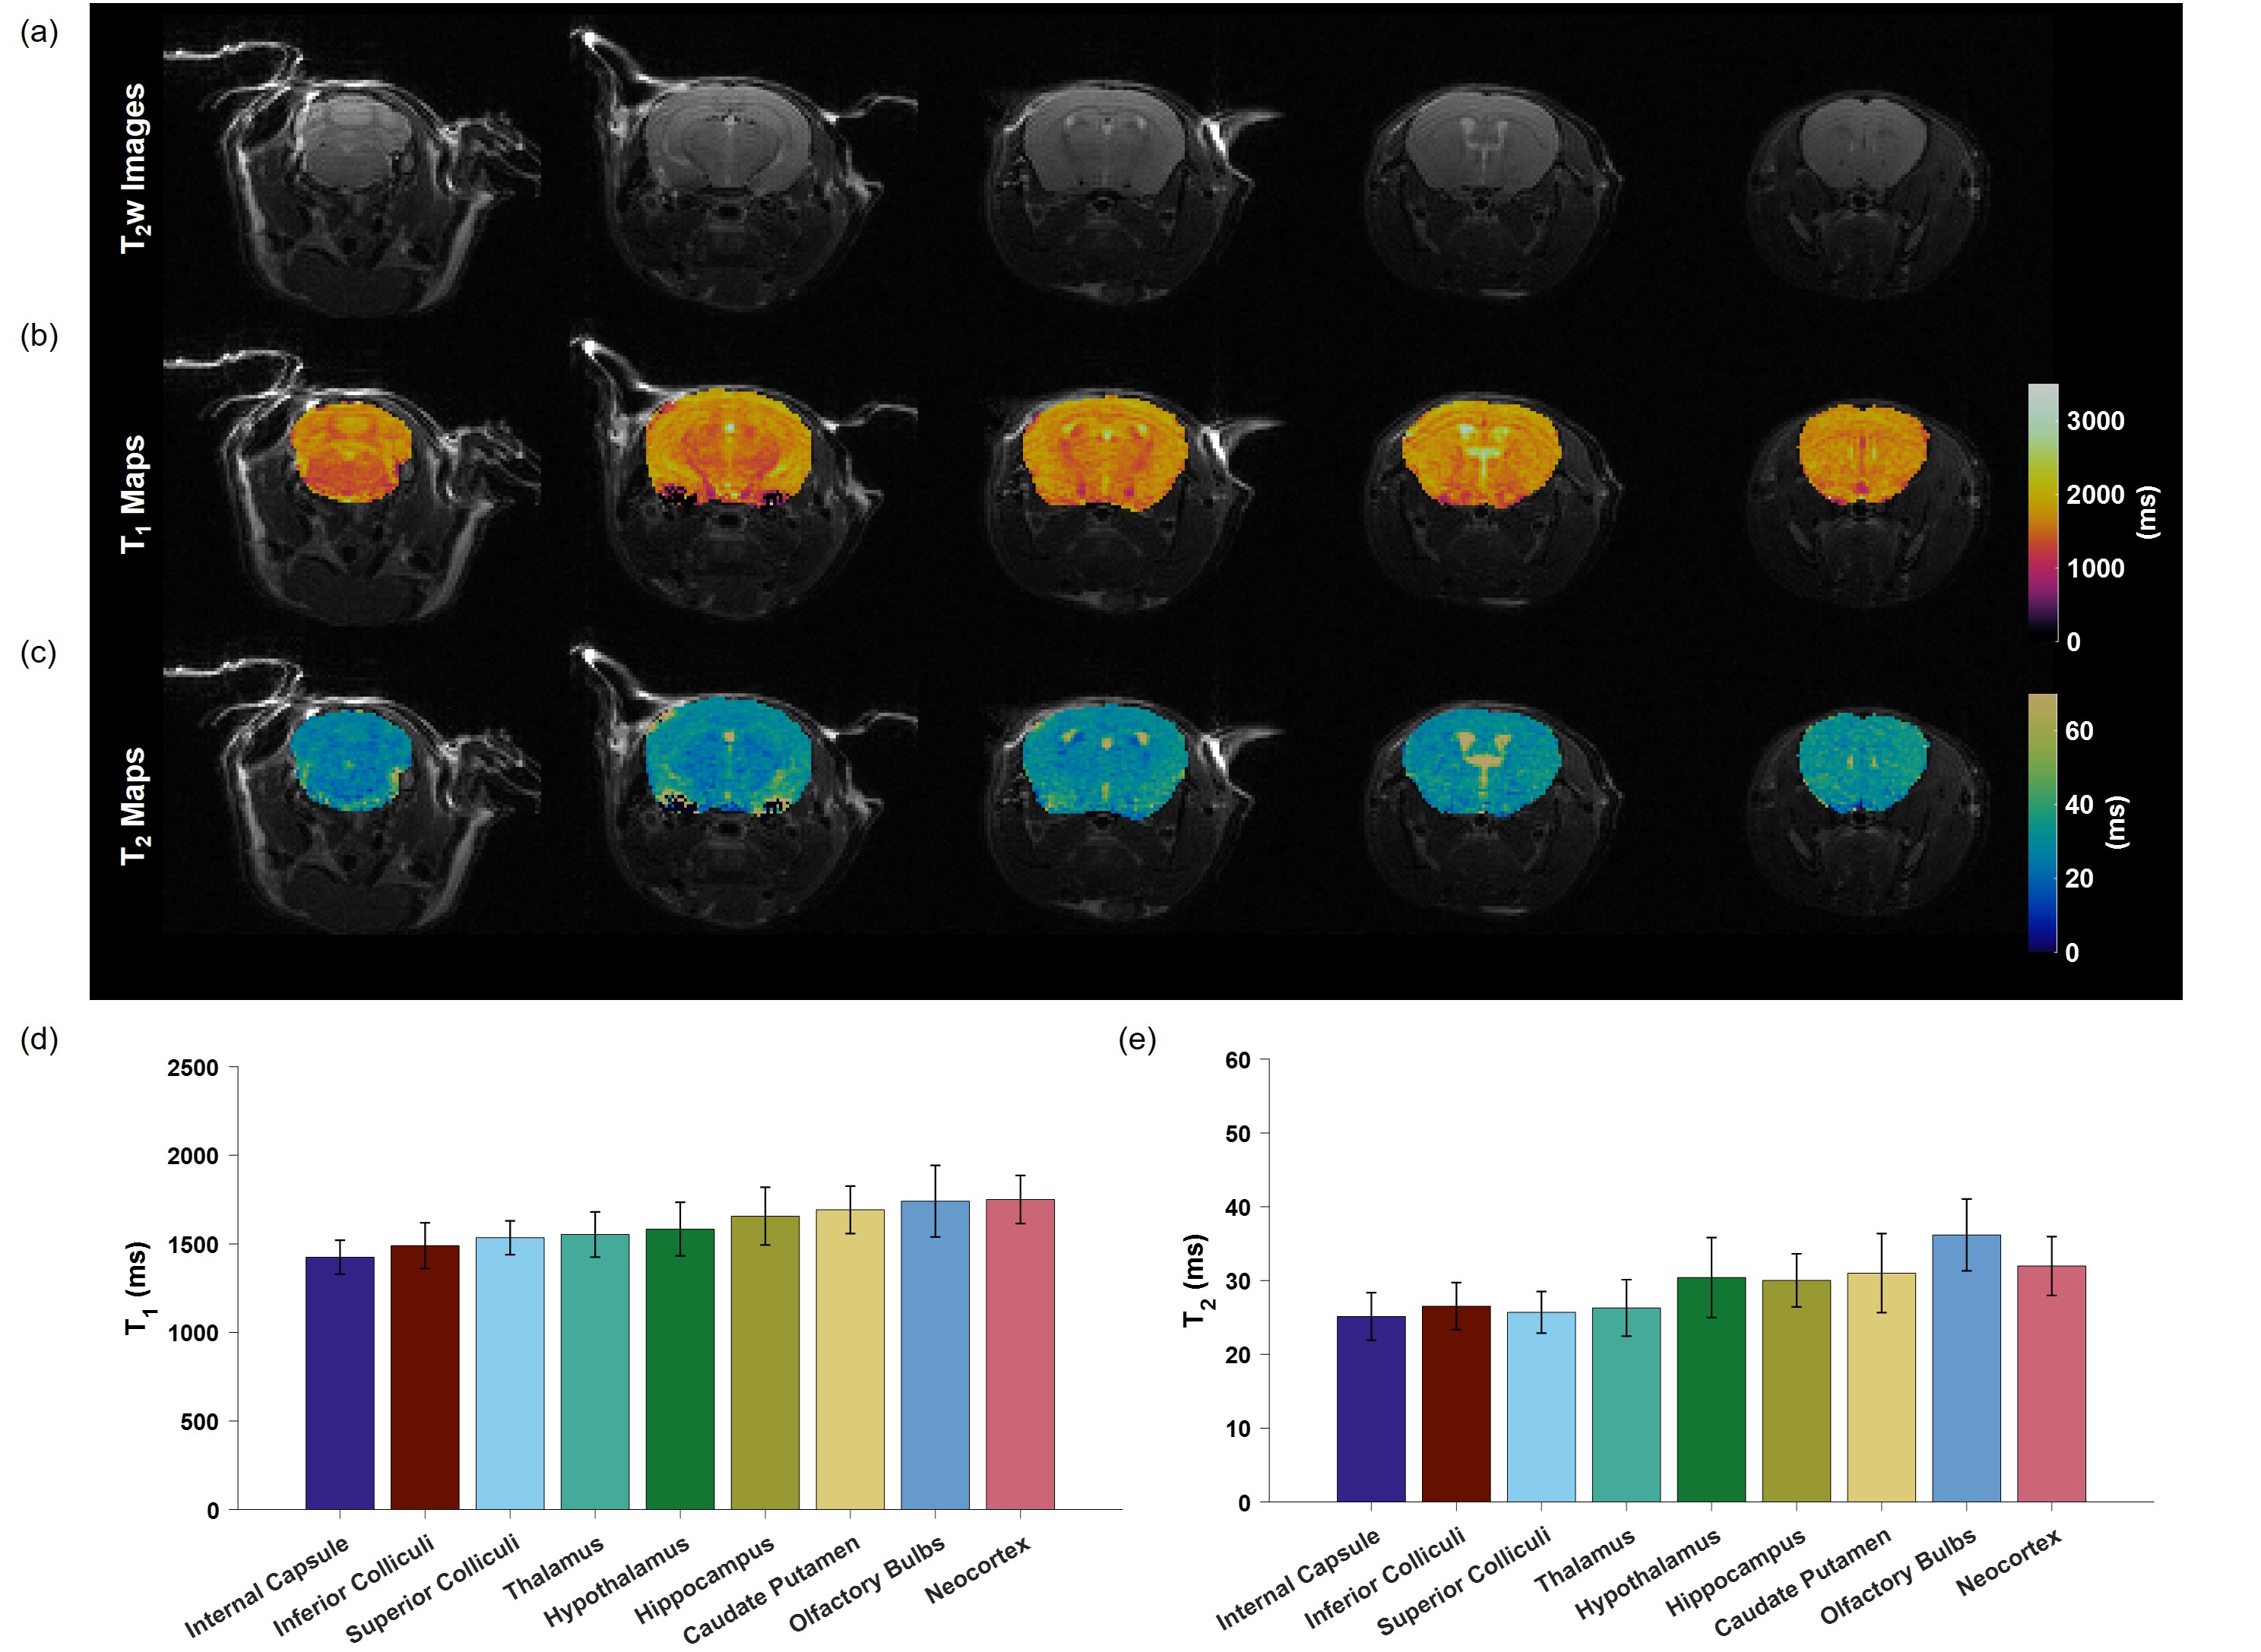
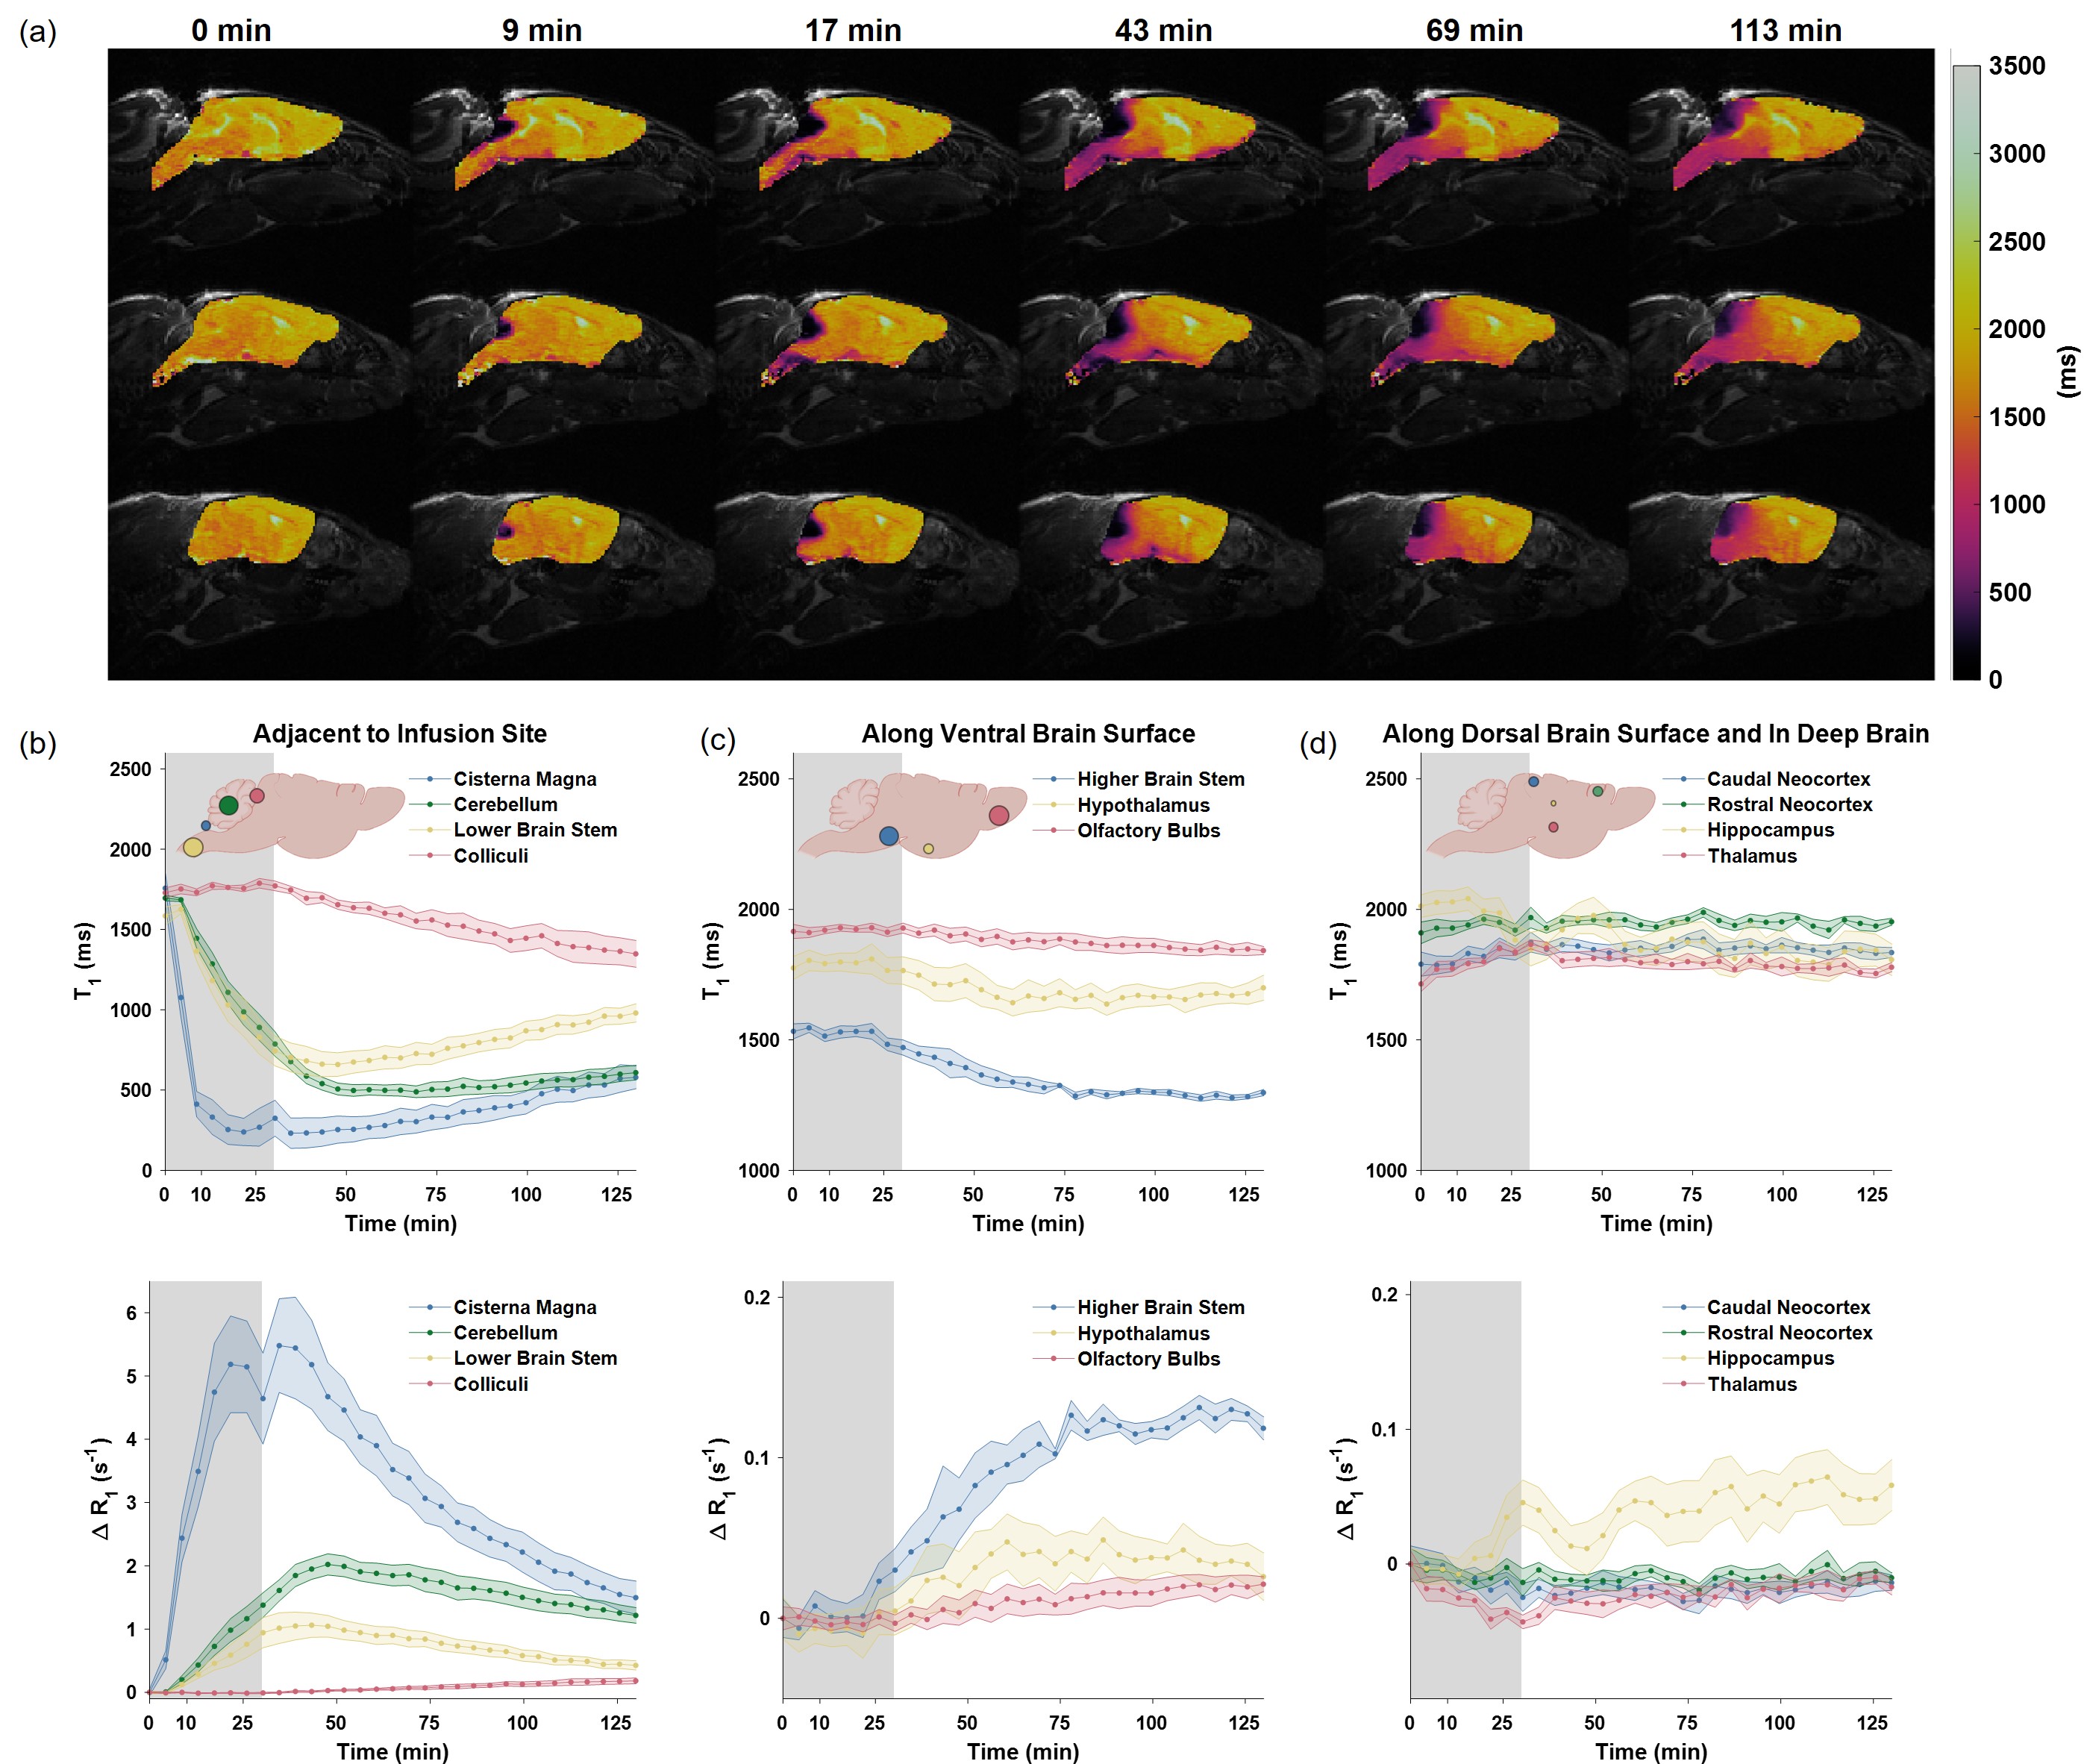
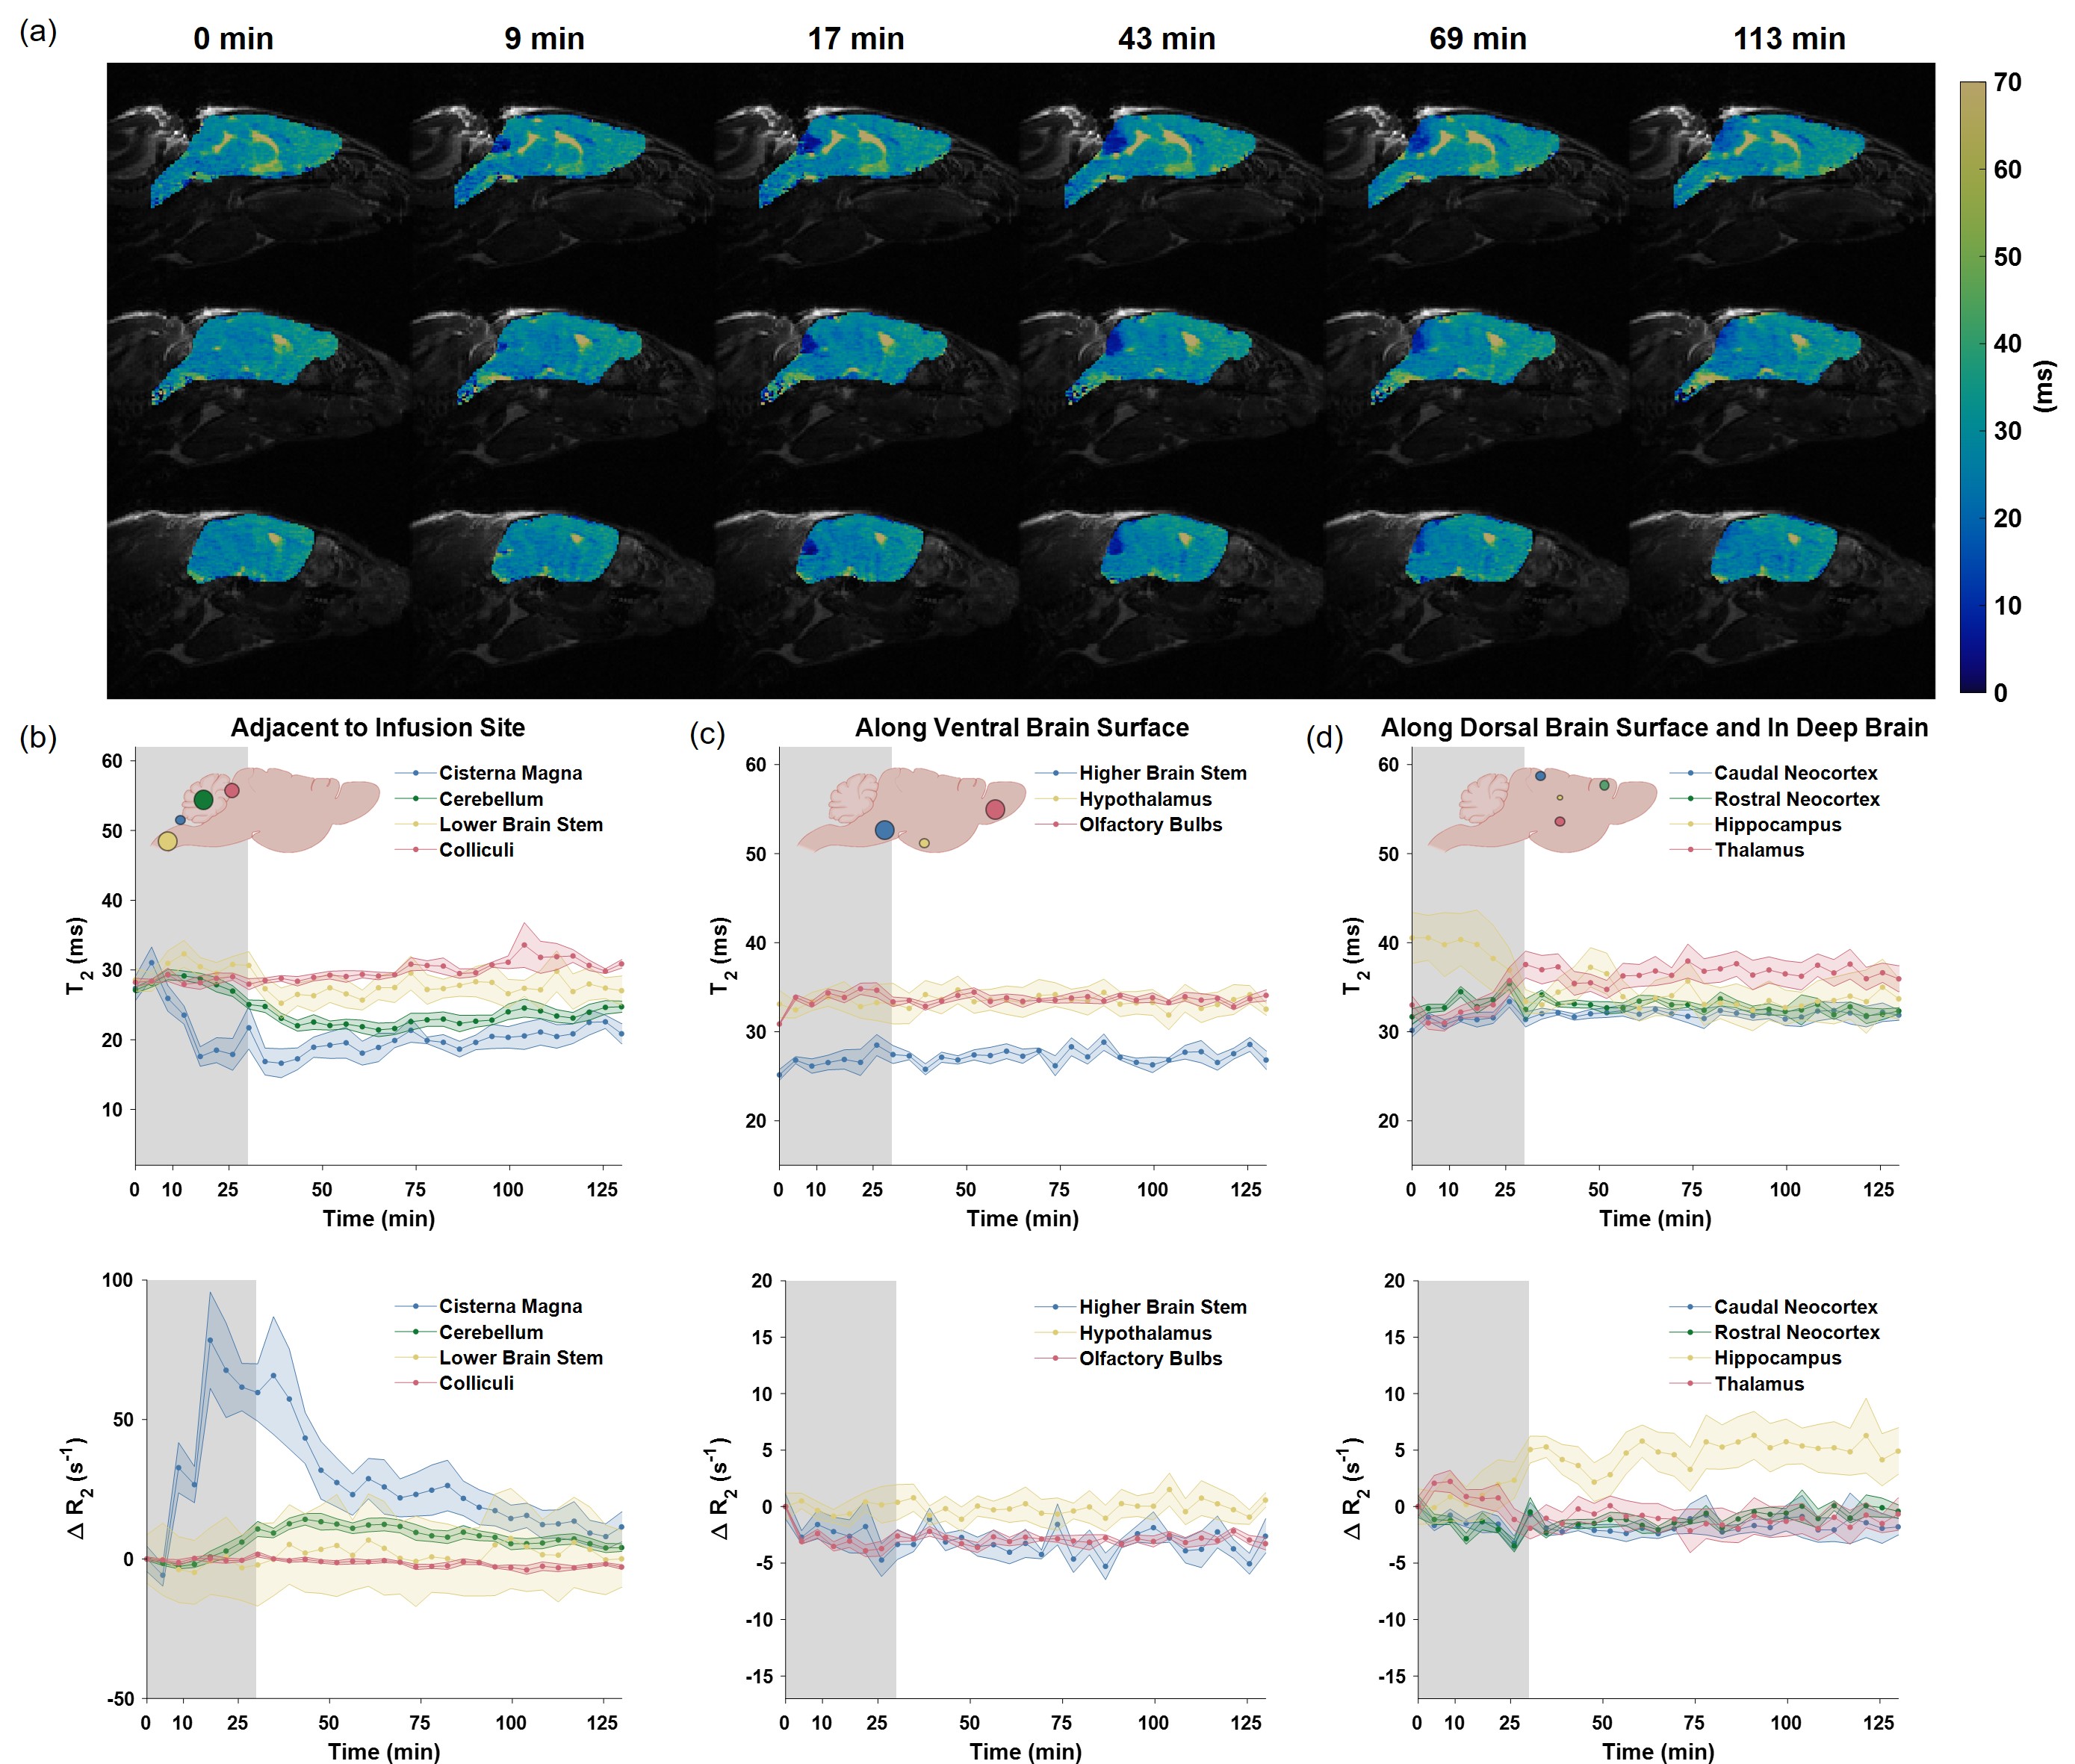
Figure 1(c) shows the normalized root-mean-squared error (NRMSE) of MRF T1 and T2 maps in phantom at different undersampling factors. Both T1 and T2 NMRSEs were under 10% at 48-fold undersampling (R = 48) when reconstructed with LR as compared to no undersampling. The T1 and T2 measured at R = 48 were also in excellent agreement with the SE and IR-SE measurements respectively (Figure 2). T1 and T2 maps acquired with a slice thickness of 0.25 mm (R=24) demonstrated great delineation of brain structures and tissue contrasts as compared to T2-weighted images (Figure 3(a)-(c)). The T1 and T2 values among different cortical brain regions were compared to each other and a clean separation between ROIs can be observed (Figure 3(d)&(e)).Figure 4(a) and Figure 5(a) show dynamic T1 and T2 maps from a representative mouse. There was a prominent accumulation of Gd-DTPA in the cerebellum regions. In the meantime, the transport along the ventral brain surface can be appreciated from the T1 maps with a transport blockade between the cerebellum and cortex. These observations were refined by the time course of T1 and ΔR1 changes (Figure 4(b)-(d)). Both the cerebellum and lower brain stem experienced relatively slower Gd-DTPA transport kinetics and much lower ΔR1 peak than cisterna magna (Figure 4(b)). Similar trends could also be found in T2 and ΔR2 (Figure 5(b)). ROIs along the ventral brain surface showed a continuous ΔR1 increase accompanied by a decline in maximal ΔR1 from posterior to anterior direction (Figure 4(c)), whereas the ΔR2 changes were negligible (Figure 5(c)). Both ΔR1 and ΔR2 changes were negligible in dorsal and deep brain regions except for hippocampus, indicating that they are downstream of the Gd-DTPA transport (Figure 4(d), Figure 5(d)).
Discussion and Conclusion
We present the first 3D MRF method to dynamically track Gd-DTPA in the entire mouse brain by simultaneous multi-parametric mapping. This approach enables direct comparison of CSF transport in the whole brain, where ΔR2 could provide additional insights to ΔR1 on Gd-DTPA concentrations. Acquisition and reconstruction efficiencies were both significantly improved compared to previous preclinical MRF studies12–16. The proposed 3D MRF method provides numerous opportunities to extend quantitative MR beyond its current limits in small animal imaging, for studying CSF circulation and beyond.Acknowledgements
This work was supported by R01 NS124206 from the U.S. National Institute of Health and 23PRE1017924 from the American Heart Association.References
1. Iliff JJ, Lee H, Yu M, et al. Brain-wide pathway for waste clearance captured by contrast-enhanced MRI. J Clin Invest 2013; 123: 1299–1309.
2. Benveniste H, Lee H, Ozturk B, et al. Glymphatic Cerebrospinal Fluid and Solute Transport Quantified by MRI and PET Imaging. Neuroscience 2021; 474: 63–79.
3. Taoka T, Naganawa S. Glymphatic imaging using MRI. J Magn Reson Imaging 2020; 51: 11–24.
4. Stanton EH, Persson NDÅ, Gomolka RS, et al. Mapping of CSF transport using high spatiotemporal resolution dynamic contrast‐enhanced MRI in mice: Effect of anesthesia. Magn Reson Med 2021; 85: 3326–3342.
5. Alshuhri MS, Gallagher L, Work LM, et al. Direct imaging of glymphatic transport using H217O MRI. JCI Insight 2021; 6: e141159.
6. Zhu Y, Wang G, Kolluru C, et al. Transport pathways and kinetics of cerebrospinal fluid tracers in mouse brain observed by dynamic contrast-enhanced MRI. Sci Rep 2023; 13: 13882.
7. Lee H, Mortensen K, Sanggaard S, et al. Quantitative Gd-DOTA uptake from cerebrospinal fluid into rat brain using 3D VFA-SPGR at 9.4T: Quantitative Gd-DOTA Uptake from CSF into Rat Brain. Magn Reson Med 2018; 79: 1568–1578.
8. Zhao B, Setsompop K, Adalsteinsson E, et al. Improved magnetic resonance fingerprinting reconstruction with low‐rank and subspace modeling. Magn Reson Med 2018; 79: 933–942.
9. Avants BB, Tustison NJ, Song G, et al. A reproducible evaluation of ANTs similarity metric performance in brain image registration. NeuroImage 2011; 54: 2033–2044.
10. Wang G, Luo T, Nielsen J-F, et al. B-Spline Parameterized Joint Optimization of Reconstruction and K-Space Trajectories (BJORK) for Accelerated 2D MRI. IEEE Trans Med Imaging 2022; 41: 2318–2330.
11. Wang G, Shah N, Zhu K, et al. MIRTorch: A PyTorch-powered Differentiable Toolbox for Fast Image Reconstruction and Scan Protocol Optimization. London, England, UK, p. 4982.
12. Buonincontri G, Sawiak SJ. MR fingerprinting with simultaneous B1 estimation. Magn Reson Med 2016; 76: 1127–1135.
13. Gu Y, Wang CY, Anderson CE, et al. Fast magnetic resonance fingerprinting for dynamic contrast‐enhanced studies in mice. Magn Reson Med 2018; 80: 2681–2690.
14. Anderson CE, Donnola SB, Jiang Y, et al. Dual Contrast - Magnetic Resonance Fingerprinting (DC-MRF): A Platform for Simultaneous Quantification of Multiple MRI Contrast Agents. Sci Rep 2017; 7: 8431.
15. Gu Y, Wang L, Yang H, et al. Three‐dimensional high‐resolution T1 and T2 mapping of whole macaque brain at 9.4 T using magnetic resonance fingerprinting. Magn Reson Med 2022; 87: 2901–2913.
16. Gao Y, Chen Y, Ma D, et al. Preclinical MR fingerprinting (MRF) at 7 T: effective quantitative imaging for rodent disease models: HIGH-FIELD PRECLINICAL MRF. NMR Biomed 2015; 28: 384–394.
Figures