0690
Are we validating enough our MRI markers? Cell-specific challenges to dissect the neurobiology of microstructural MRI1Instituto de Neurociencias, CSIC-UMH, Alicante, Spain, 2CUBRIC, Cardiff, United Kingdom
Synopsis
Keywords: Biology, Models, Methods, Diffusion/other diffusion imaging techniques, inflammation, brain, degeneration, demyelination
Motivation: Validation of MRI-extracted biomarkers is seldom performed, and when available,
Is normally underpowered and based on correlation.
Goal(s): Here we present an innovative framework for validating microstructural MRI biomarkers by eliciting cell-specific responses.
Approach: The framework is based on injection of neurotoxins in rats, followed by MRI exploration and histology.
Results: We successfully isolated conditions associated to neurodegenerative, demyelinating and inflammatory pathologies and demonstrated sensitivity and specificity of MRI- derived biomarkers.
Impact: This framework impulse a much-needed change in paradigm for MRI validation by challenging the biological content of MRI derived biomarkers, refine and test new models for microstructural imaging and bridge the gap between advances in MRI physics and clinical applications.
INTRODUCTION
Microstructural imaging leverages the sensitivity of diffusion-weighted (dw) and other MR sequences to cellular structures, offering the unrivalled access to image non-invasively cellular phenotypes. While new microstructural models are constantly being developed, validation of MRI markers via complementary techniques, a key step for the translation of the framework in clinical context, is either absent, or underpowered (typically n=1-3). Here, we present a new experimental paradigm to challenge sensitivity and specificity of MRI-derived biomarkers with respect to changes in cellular compartments, mimicking those associated to neurodegenerative, demyelinating and inflammatory pathologies.METHODS
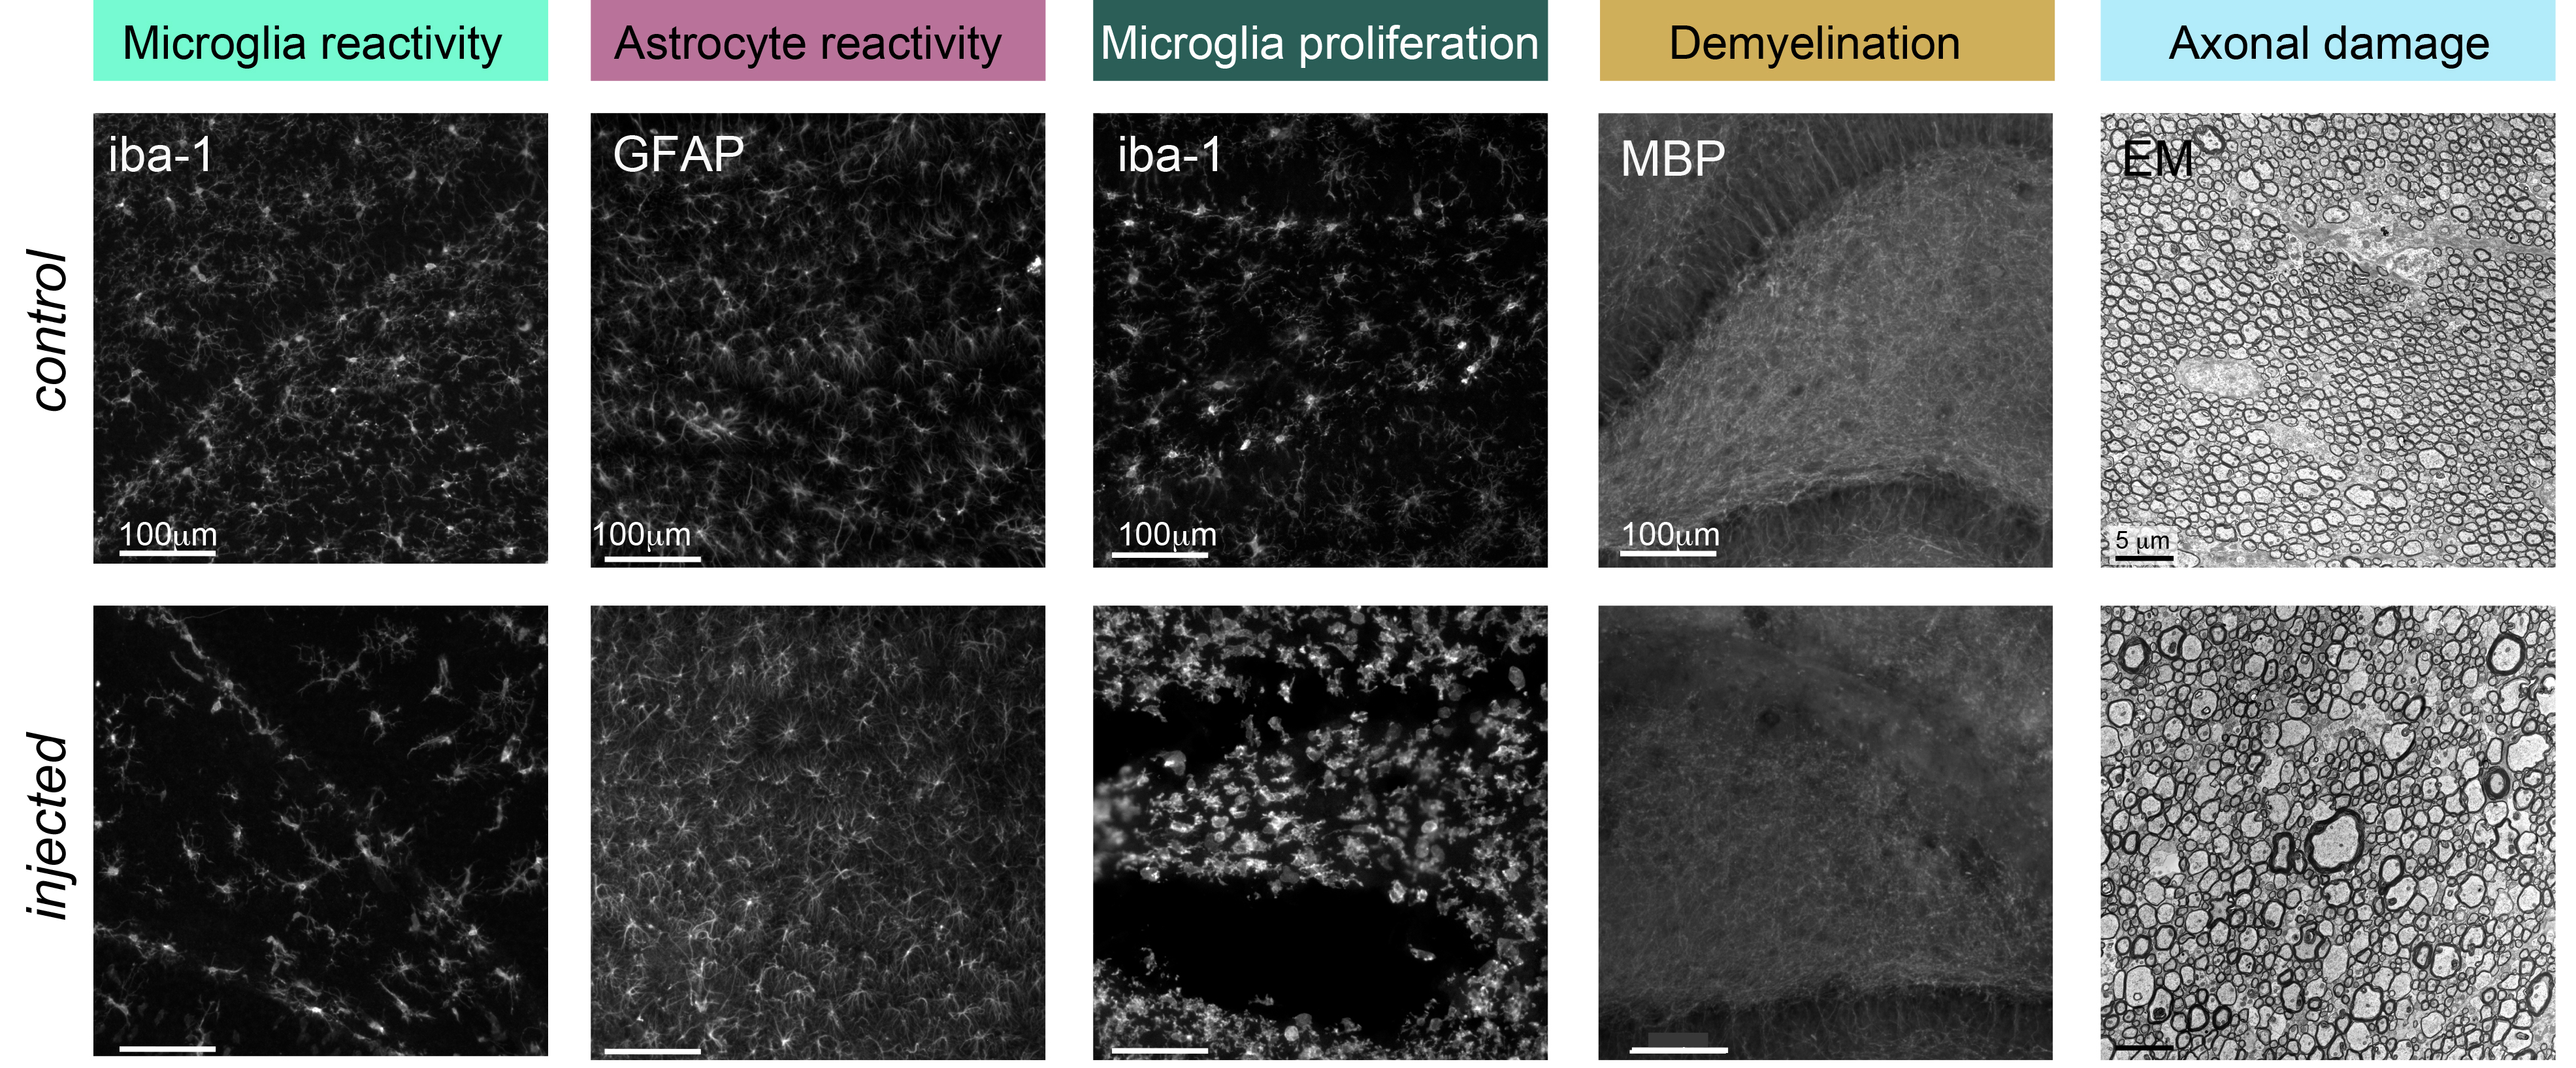
Our framework is based on stereotaxic injections of neurotoxins (saline contralaterally) in the rat hippocampus, followed by MRI acquisition, perfusion and histology. Specifically, we injected: i) lipopolysaccharide (LPS) to induce microglia and astrocyte reactivity (n=29), ii) ibotenic acid to induce microglia reactivity, proliferation and neuronal death in the hippocampus, and axonal damage in the fimbria, i.e., its main projection to the prefrontal cortex (n=19), and iii) lysolecithin to induce demyelination (n=5). A subgroup of LPS animals were pre-treated with PLX5622 to deplete microglia and isolate astrocyte (n=6). Then, the rats underwent an MRI protocol comprising a dw sequence (b=0, 2000 and 4000 s/mm2, diffusion times 15-60 ms); T1/T2 mapping1, a gradient echo sequence (30 TEs in the range 2.7-60 ms) and a quantitative magnetization transfer protocol2. The resolution was 0.225×0.225×0.6 mm. Immediately after, the animals were perfused. A subset of animals (n=12) underwent an ex-vivo MRI protocol. The brains were processed for immunohistochemistry staining Iba1 for microglia, GFAP for astrocytes, NeuN for neuronal death, neurofilaments for axonal integrity. A subset of animals (n=6) was processed for electron microscopy to quantify axonal diameter, myelin and g-ratio. MRI data were processed to extract mean diffusivity (MD), T1/T2 ratio, T2*, restricted fraction (FR), cell density, size and convex hull3 in grey matter, myelin fraction2 and axonal radius4 in white matter. MRI and histological markers were compared across injected and control hemispheres using paired t-tests.RESULTS
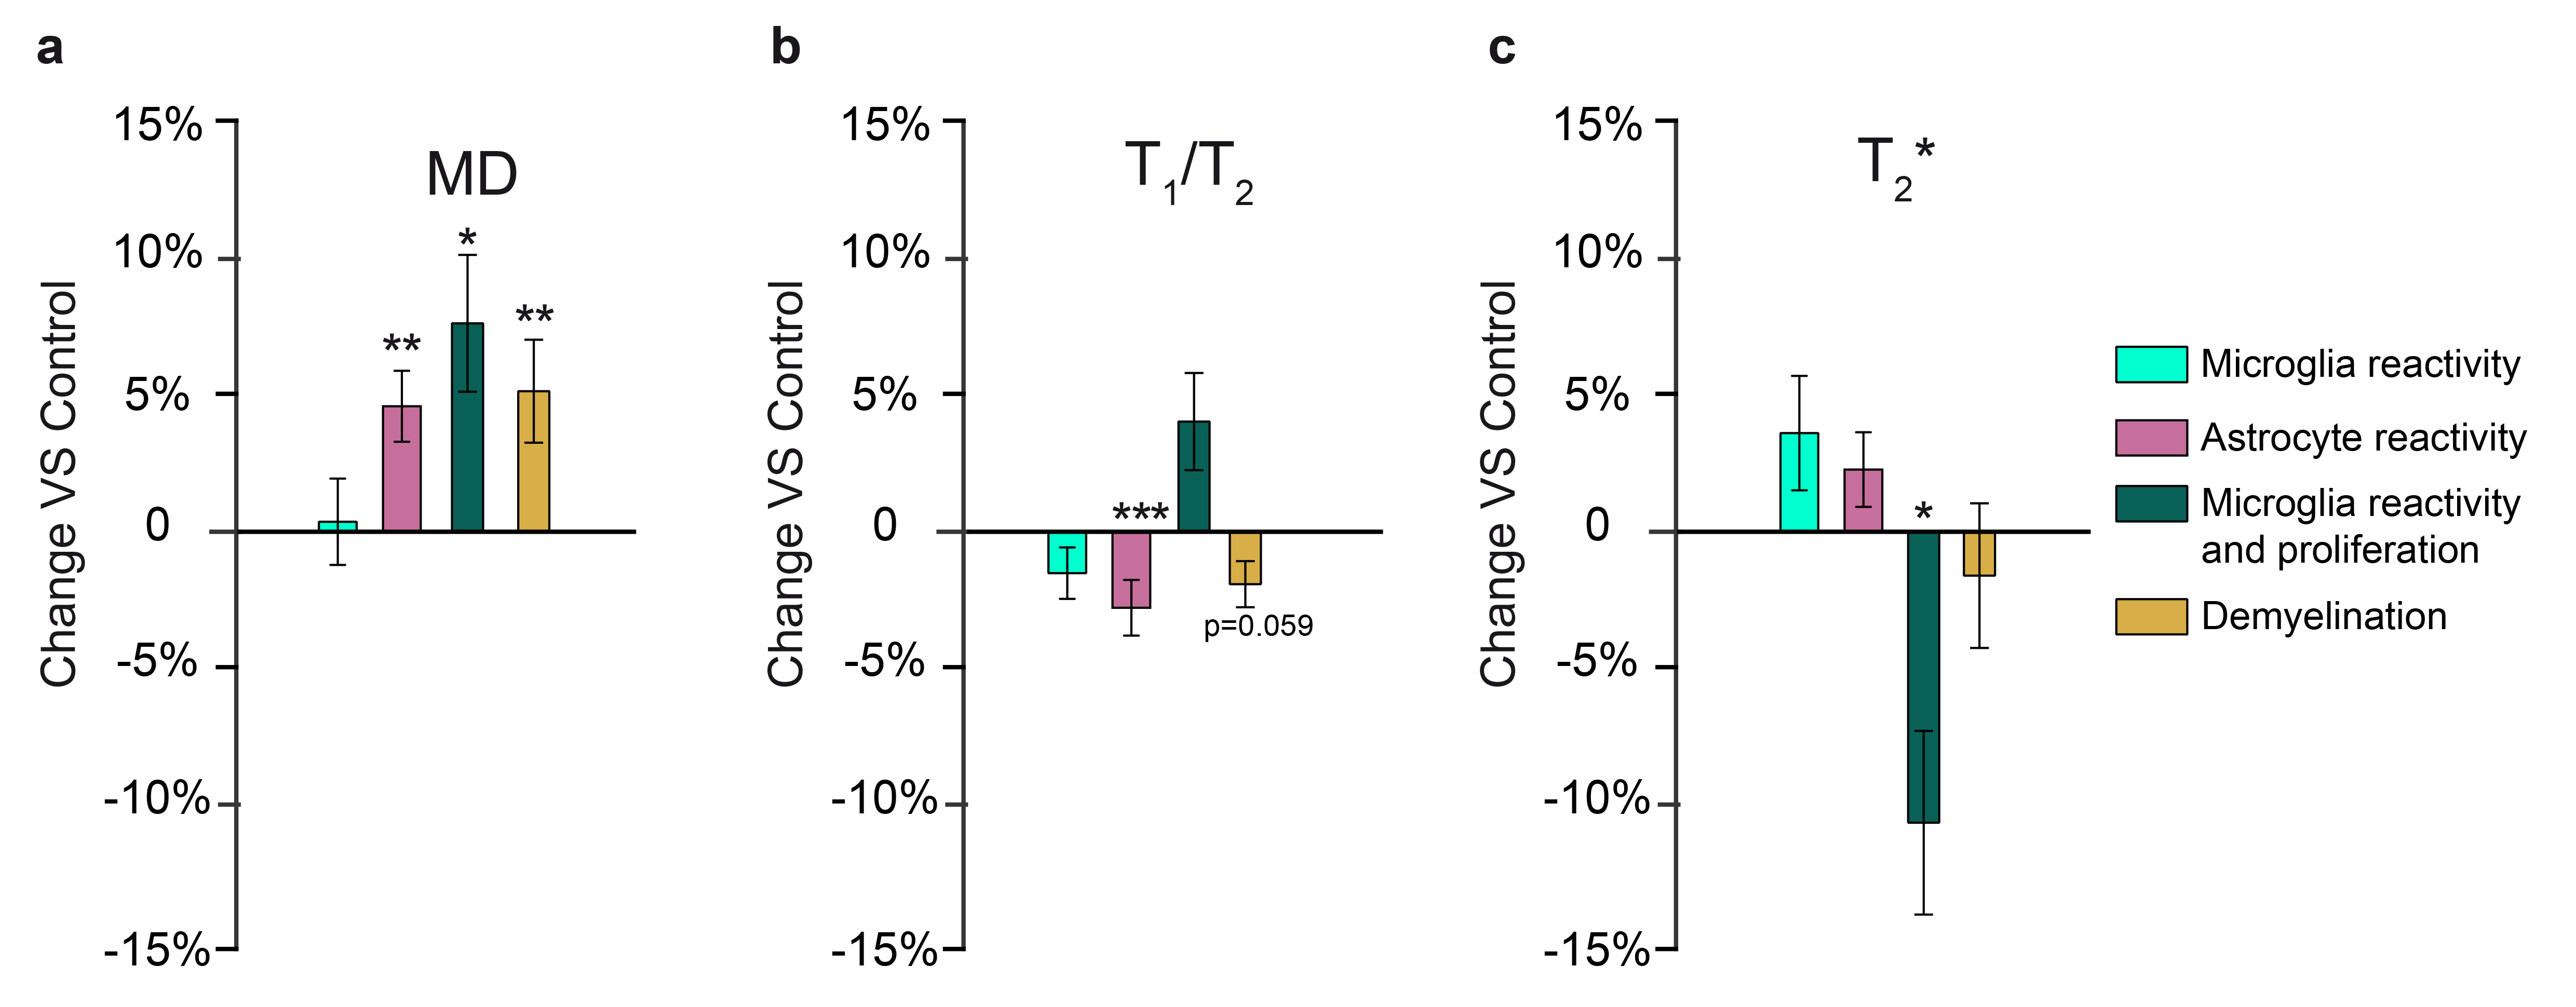
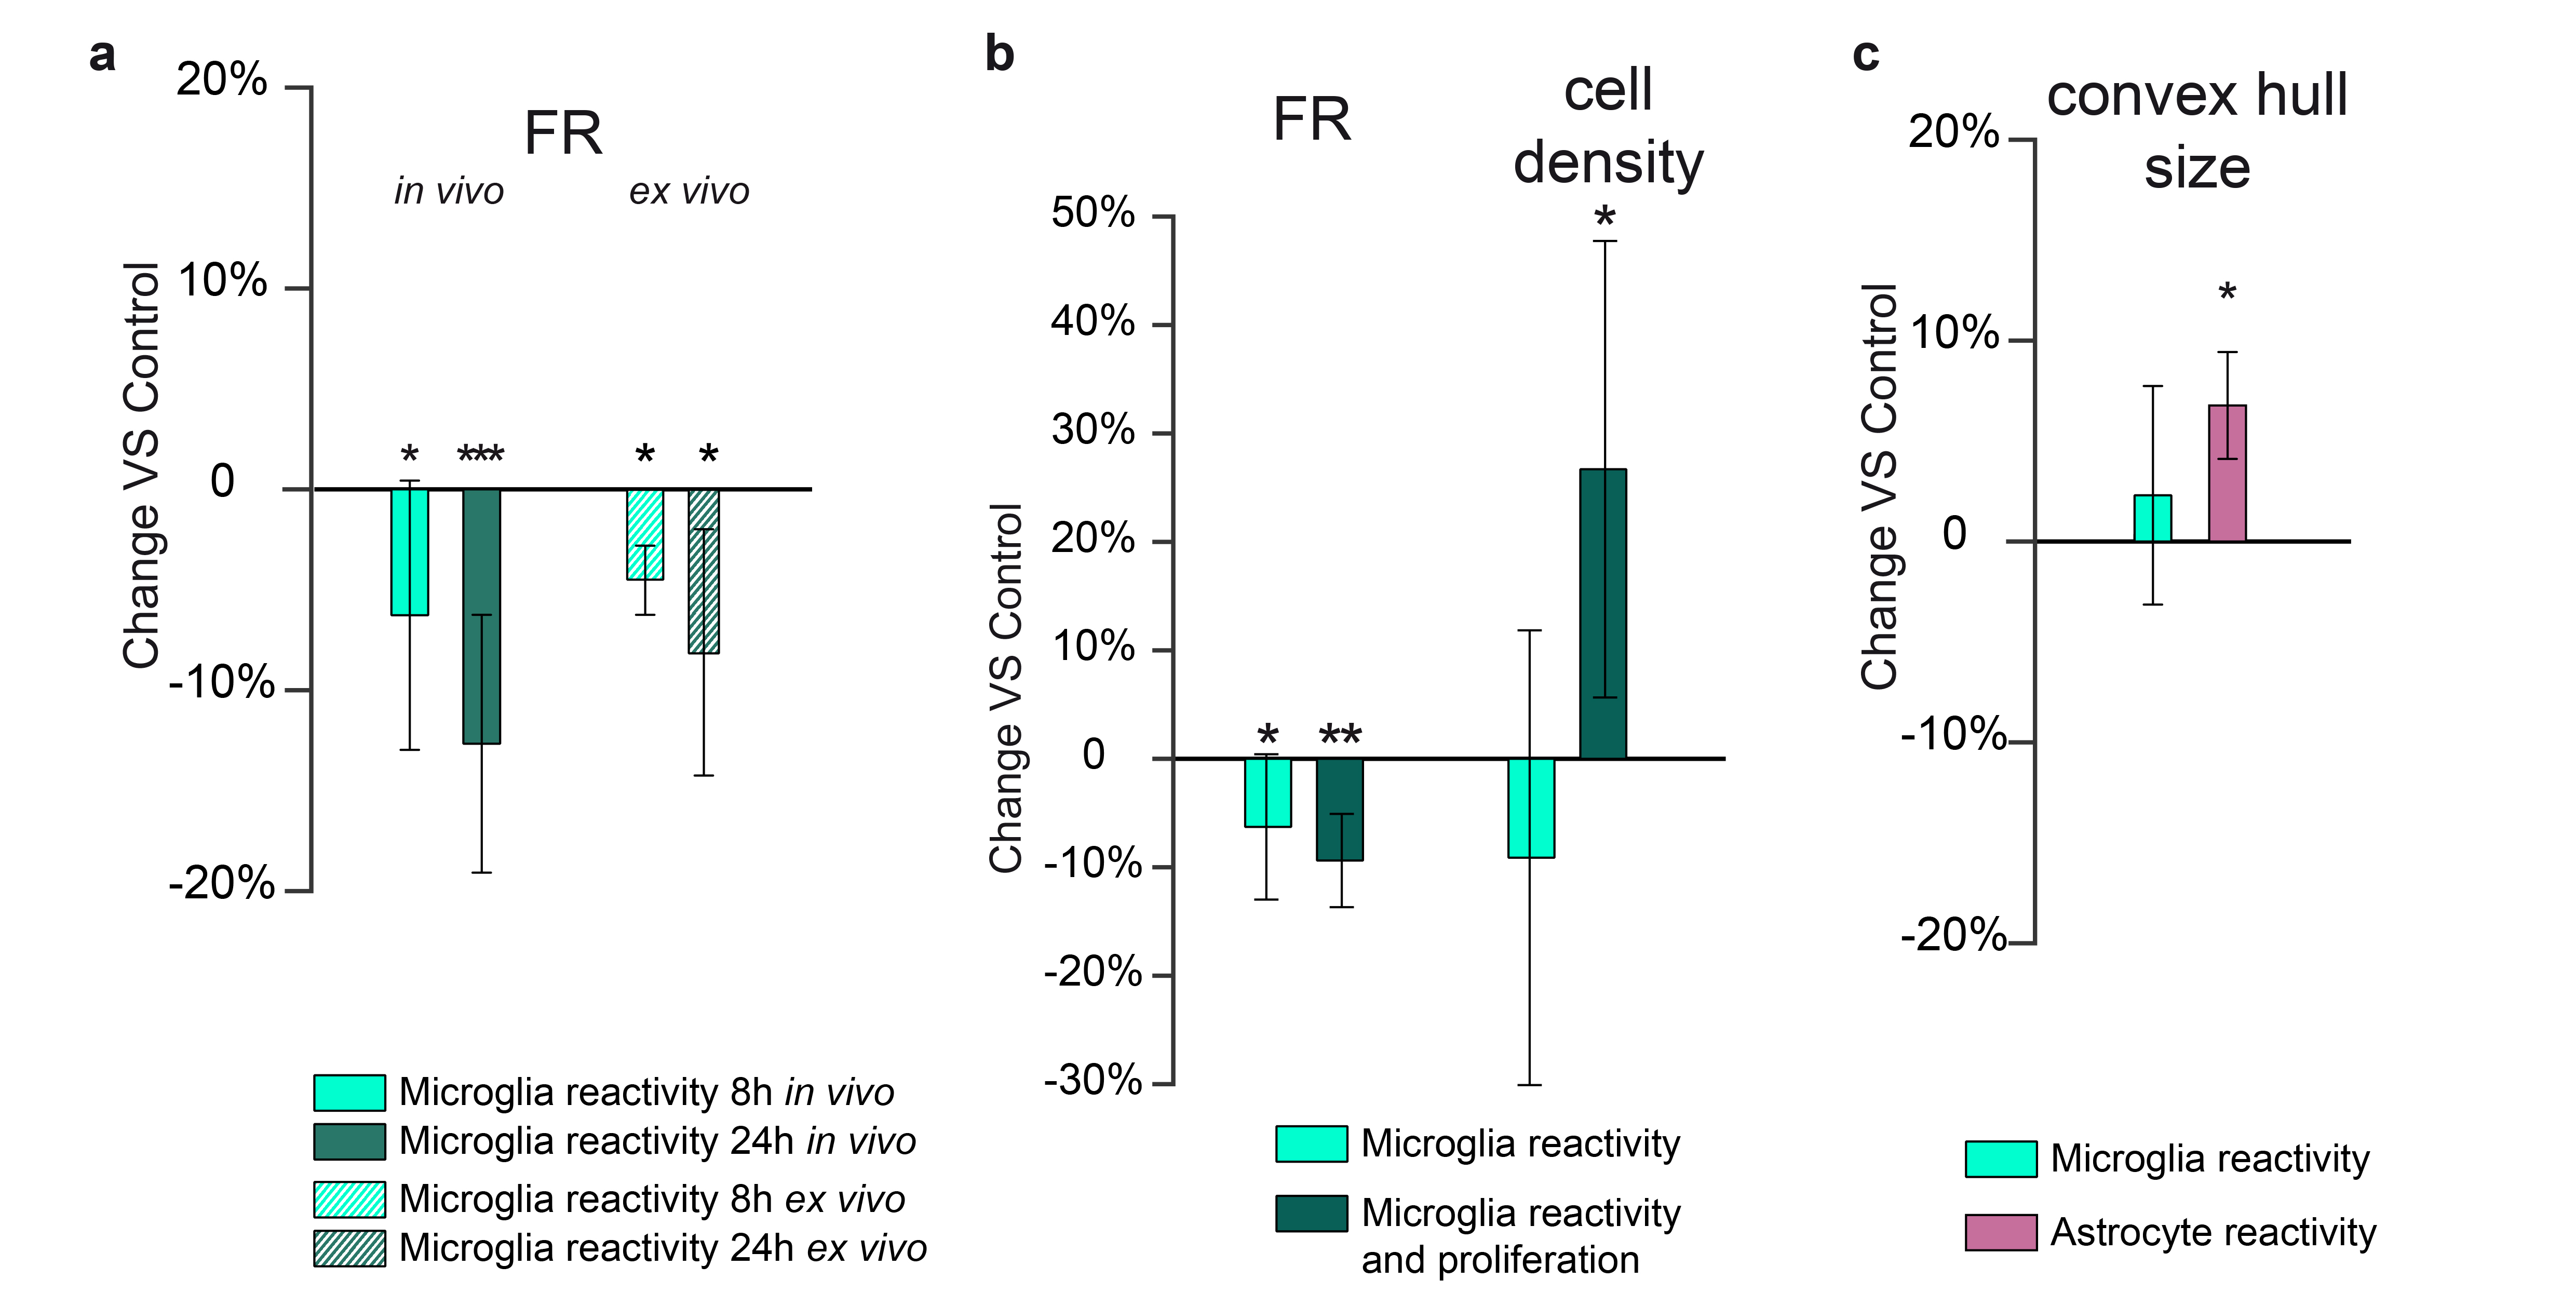
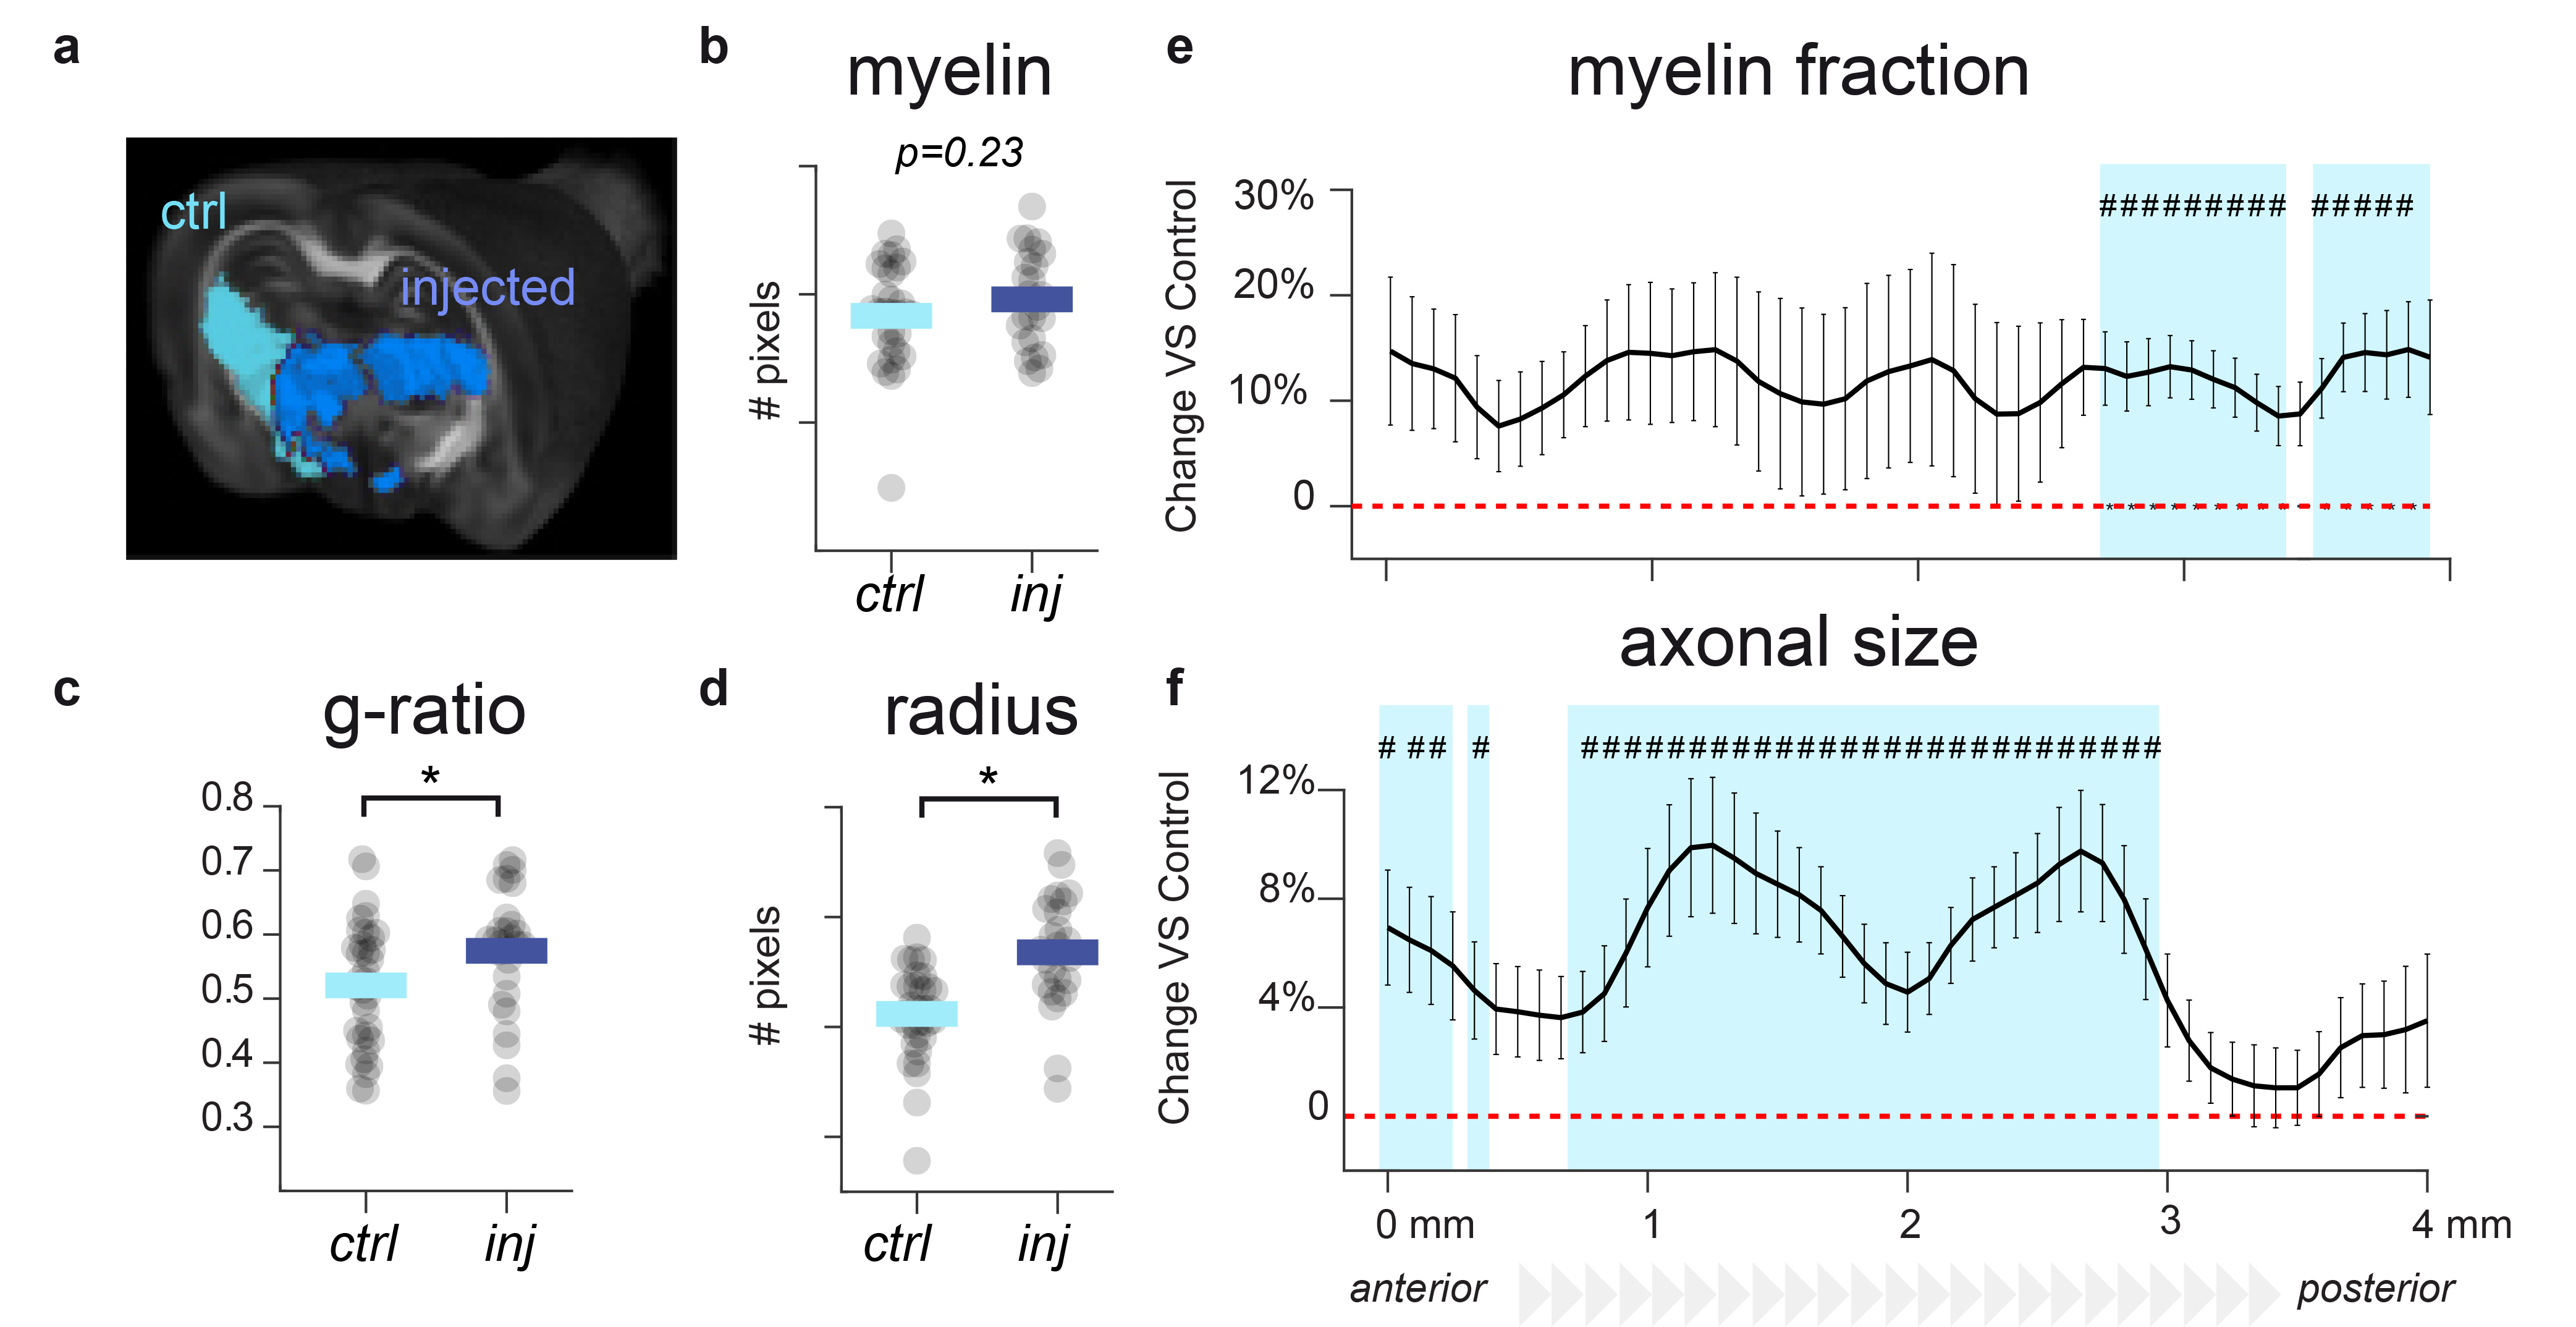
We successfully generated tissue in which i) only microglia show a reactive phenotype (amoeboid morphology); ii) only astrocytes show a reactive phenotype (increase in the occupied volume or convex hull); iii) microglia are reactive and proliferating (amoeboid morphology and increased density); iv) myelin content is decreased without gliosis; and v) axons are damaged (increased neurofilament protein and diameter) without gliosis or myelin alterations (Fig.1).This framework can test sensitivity and specificity of both conventional and microstructural MRI biomarkers. As shown previously, MD is sensitive to microglia reactivity in grey matter5, but not specific (Fig.2a). T1/T2, a proxy for myelin content1, is indeed sensitive to lysolecithin-induced demyelination, but also to astrocyte reactivity (Fig.2b). Interestingly, T2* is sensitive to microglia reactivity only when accompanied by neuronal death, compatible with metal accumulation due to changes in iron metabolism6.The framework can be also used to compare sensitivity of FR, a marker of process density, in vivo and ex vivo. As shown in Fig.3a, ex vivo markers retain sensitivity to microglia reactivity, albeit with smaller effect size. In Fig.3b, microglia morphological changes with and without cell proliferations are compared, showing that dw-MRI can distinguish between the two conditions. In Fig.3c, astrocyte and microglia reactivity are discerned by the increase in convex hull size. In white matter, toxin injection damaging neuronal terminals induced fimbria alterations, providing a model to validate MRI markers via tractometry7. In Figure 4b-d, EM-derived myelin, g-ratio and axonal diameter are compared across control and injected hemisphere, and comparable measures extracted from MRI are shown in panels e-f along the fimbria tract. While MRI and EM quantifications agree, tract-specific MRI highlights location-specific alterations, possibly indicating different stages of axonal damage along the fimbria.DISCUSSION
With this combination of tissue challenges, MRI sensitivity to cellular alterations associated to neurodegenerative, demyelinating and inflammatory pathologies can be tested. The results point to i) sensitivity but not specificity of MD, T1/T2 ratio and T2* to inflammation and demyelination in GM, ii) capability of microstructural MRI to add specificity with respect to different manifestations of glia reactivity, both in vivo and ex vivo; iii) sensitivity of multicompartment MRI to axonal alterations in white matter.CONCLUSION
This framework impulses a much-needed change in paradigm for MRI validation by challenging the biological content of MRI derived biomarkers, refine and test new models for microstructural imaging and bridge the gap between advances in MRI physics and clinical applications.Acknowledgements
No acknowledgement found.References
1. Glasser, M. F. & Van Essen, D. C. Mapping Human Cortical Areas In Vivo Based on Myelin Content as Revealed by T1- and T2-Weighted MRI. Journal of Neuroscience 31, 11597–11616 (2011).
2. Cercignani, M., Symms, M. R., Schmierer, K., Boulby, P. A., Tozer, D. J., Ron, M., Tofts, P. S. & Barker, G. J. Three-dimensional quantitative magnetisation transfer imaging of the human brain. NeuroImage 27, 436–441 (2005).
3. Garcia-Hernandez, R., Cerdán Cerdá, A., Trouve Carpena, A., Drakesmith, M., Koller, K., Jones, D. K., Canals, S. & De Santis, S. Mapping microglia and astrocyte activation in vivo using diffusion MRI. Sci. Adv. 8,eabq2923 (2022).
4. Barazany, D., Basser, P. J. & Assaf, Y. In vivo measurement of axon diameter distribution in the corpus callosum of rat brain. Brain 132, 1210–1220 (2009).
5. De Santis, S., Cosa-Linan, A., Garcia-Hernandez, R., Dmytrenko, L., Vargova, L., Vorisek, I., Stopponi, S., Bach, P., Kirsch, P., Kiefer, F., Ciccocioppo, R., Sykova, E., Moratal, D., Sommer, W. H. & Canals, S. Chronic alcohol consumption alters extracellular space geometry and transmitter diffusion in the brain. Sci. Adv. 6, eaba0154 (2020).
6. Thomsen, M. S., Andersen, M. V., Christoffersen, P. R., Jensen, M. D., Lichota, J. & Moos, T. Neurodegeneration with inflammation is accompanied by accumulation of iron and ferritin in microglia and neurons. Neurobiology of Disease 81, 108–118 (2015).
7. Chamberland, M., Genc, S., Tax, C. M. W., Shastin, D., Koller, K., Raven, E. P., Cunningham, A., Doherty, J., van den Bree, M. B. M., Parker, G. D., Hamandi, K., Gray, W. P. & Jones, D. K. Detecting microstructural deviations in individuals with deep diffusion MRI tractometry. Nat Comput Sci 1, 598–606 (2021).
Figures