0689
Adiabatic spin-lock preparations for myocardial T2ρ mapping at 3T.1TU Delft, Delft, Netherlands, 2HollandPTC, Delft, Netherlands
Synopsis
Keywords: Myocardium, RF Pulse Design & Fields, T2ρ, adiabatic RF, rotating-frame relaxometry
Motivation: T2ρ may provide complementary information between T1ρ and T2, but high sensitivity to field inhomogeneities has prevented its application in cardiac MRI.
Goal(s): We evaluated adiabatic T2ρ preparations for human myocardium mapping at 3T.
Approach: To obtain T2ρ preparations, adiabatic half-passage pulses were added before and after pairs of hyperbolic secant pulses. T2ρ mapping was tested and compared with adiabatic T1ρ and T2 maps in phantoms and 5 healthy subjects.
Results: T2ρ maps yielded similar values to T2, with improved repeatability and resilience to B0 and B1+ field inhomogeneities in phantom, and better precision and reproducibility in vivo, complementing T1ρ.
Impact: Adiabatic T2ρ preparations enable robust in vivo myocardial T2ρ mapping at 3T, potentially enabling the use of an alternative rotating-frame relaxation contrast mechanism for cardiac tissue characterization at high field strengths.
Introduction
Rotating frame relaxometry is gaining interest for contrast-free myocardial tissue characterization due to its sensitivity to slow and ultra-slow molecular motion [1]. Specifically, T1ρ mapping has shown promise in a range of ischemic and non-ischemic cardiomyopathies [2]. T2ρ may provide complementary information between T1ρ and T2 regimes and has demonstrated improved sensitivity to iron deposition in neuroimaging compared with conventional T2 mapping [3,4]. However, cardiac T2ρ mapping studies are currently limited to animal models [5]. Furthermore, the high SAR levels required by spin-lock preparations and their sensitivity to B0 and B1+ field inhomogeneities remain hindering factors for its in vivo application at high field strengths (≥3T). In this study, we sought to evaluate adiabatic T2ρ preparations for myocardial T2ρ mapping at 3T, in comparison with adiabatic T1p and conventional T2 mapping.Methods
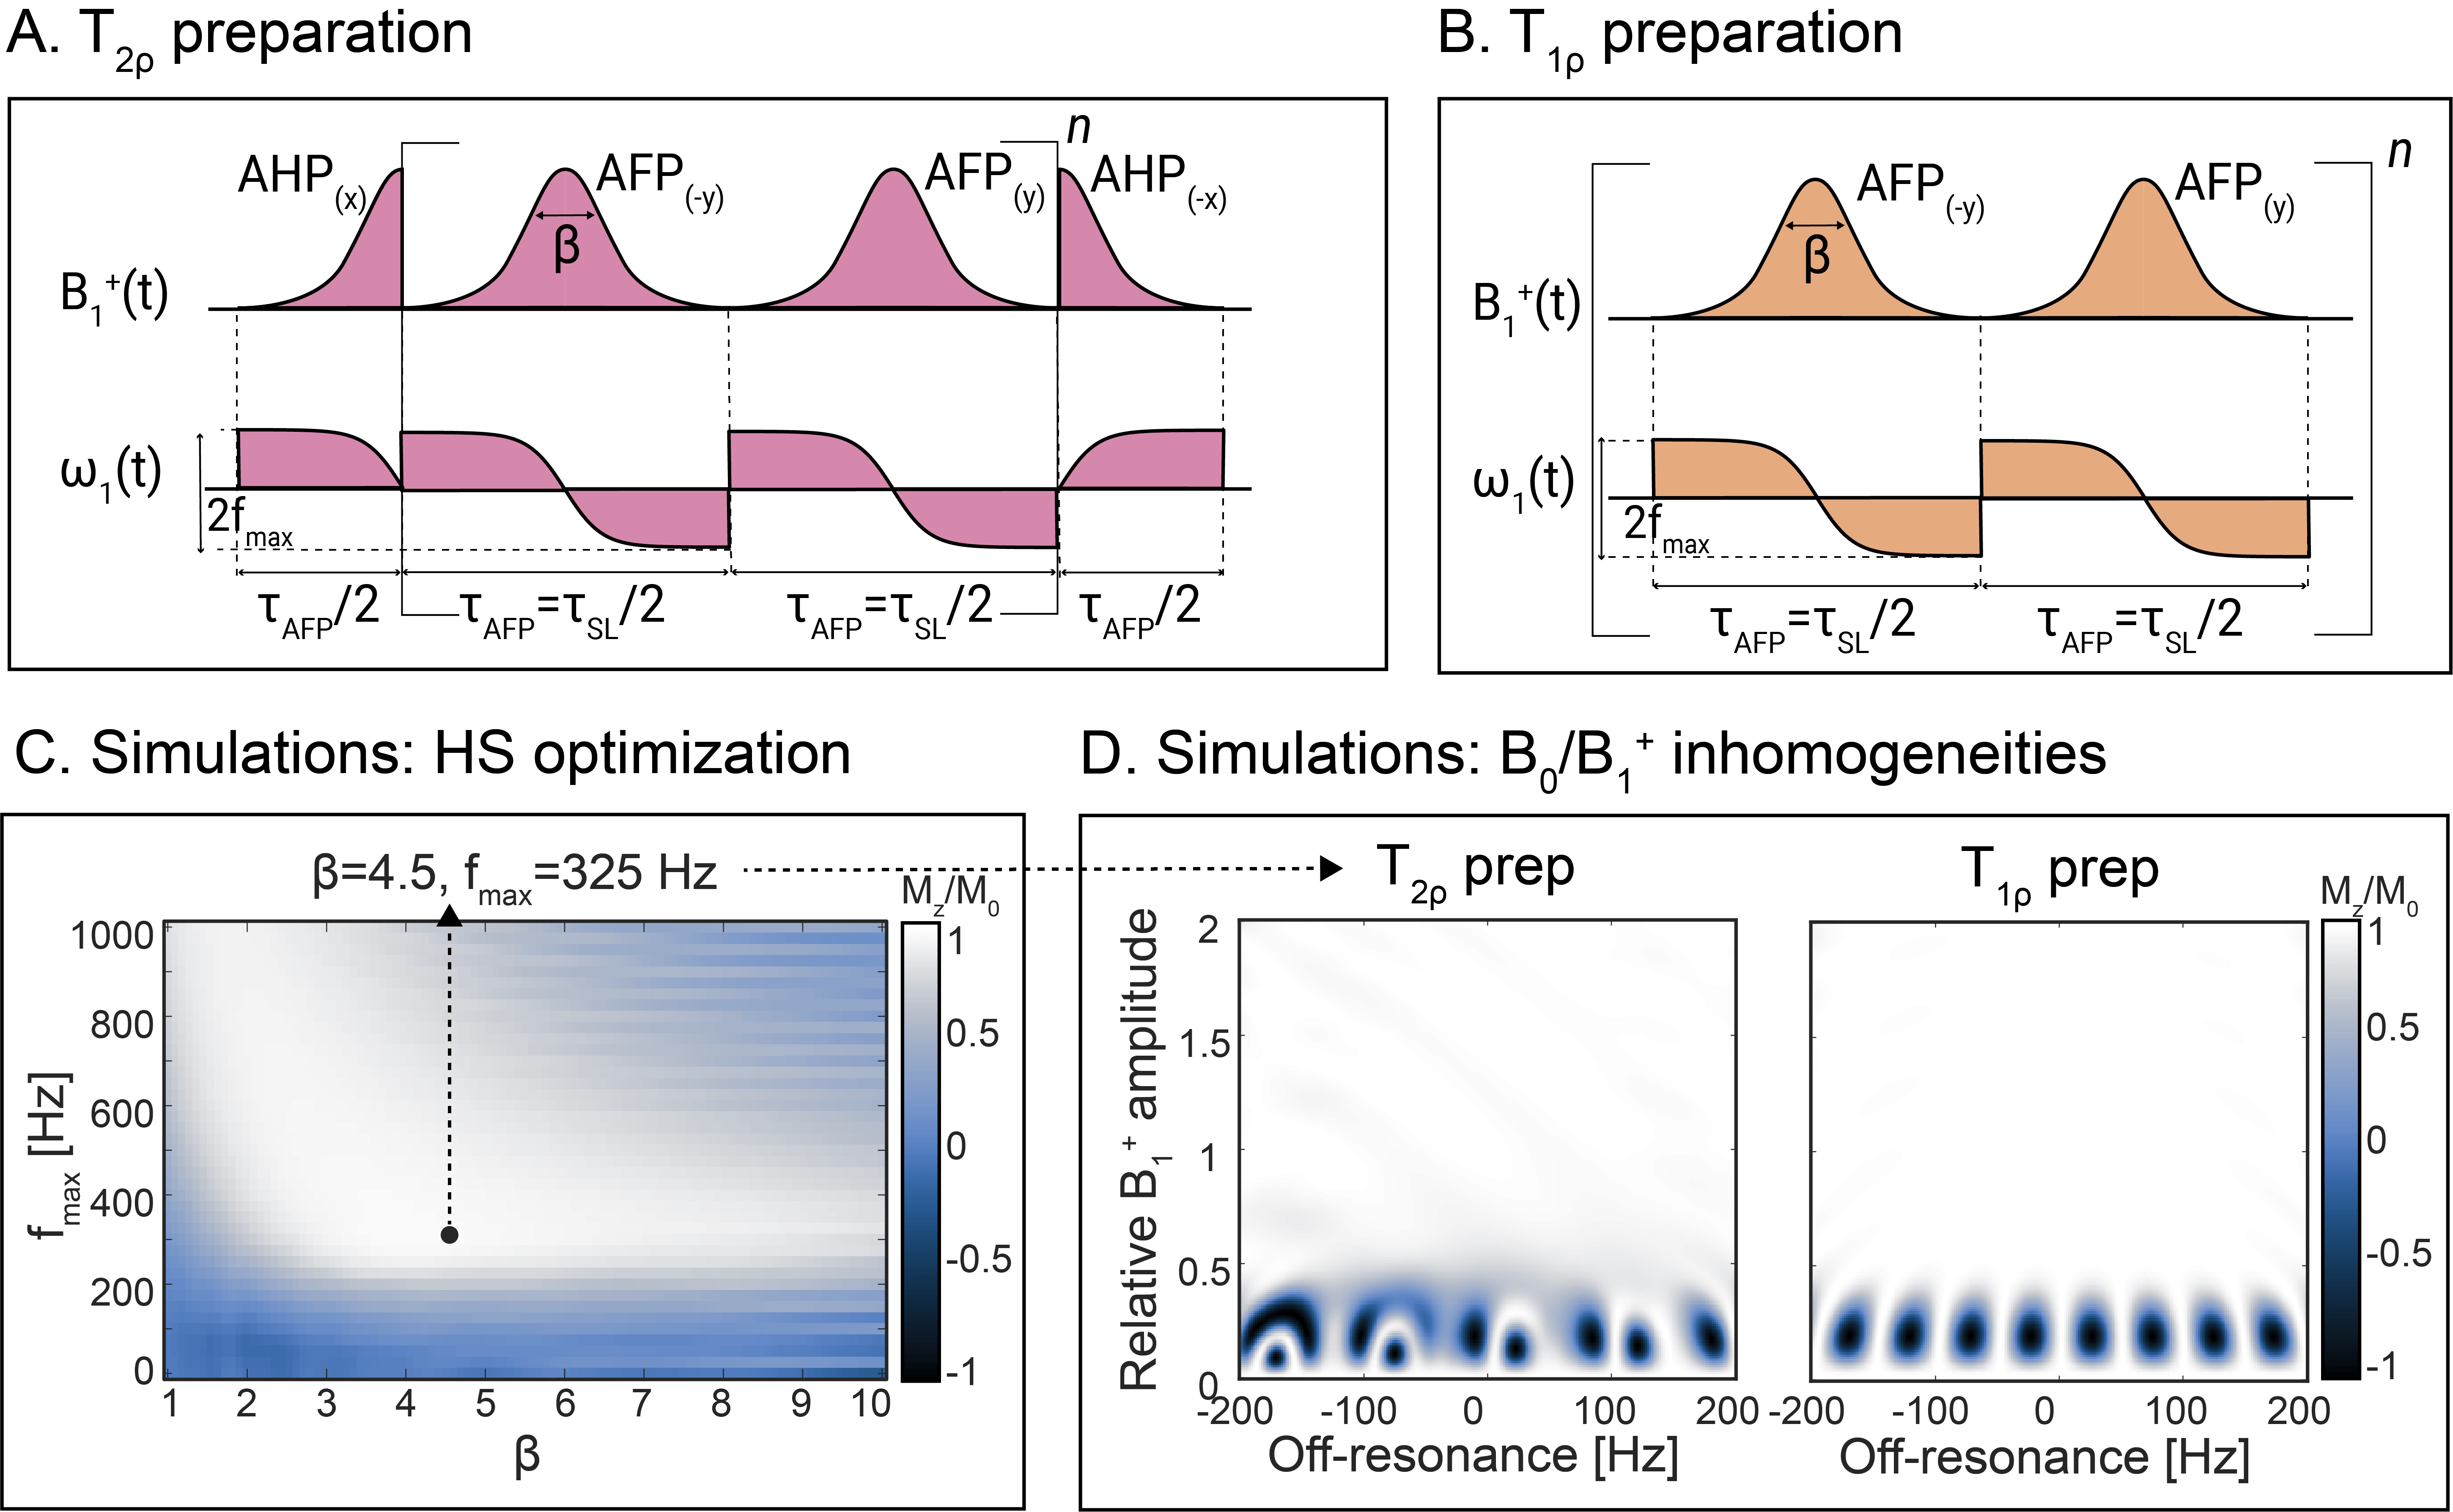
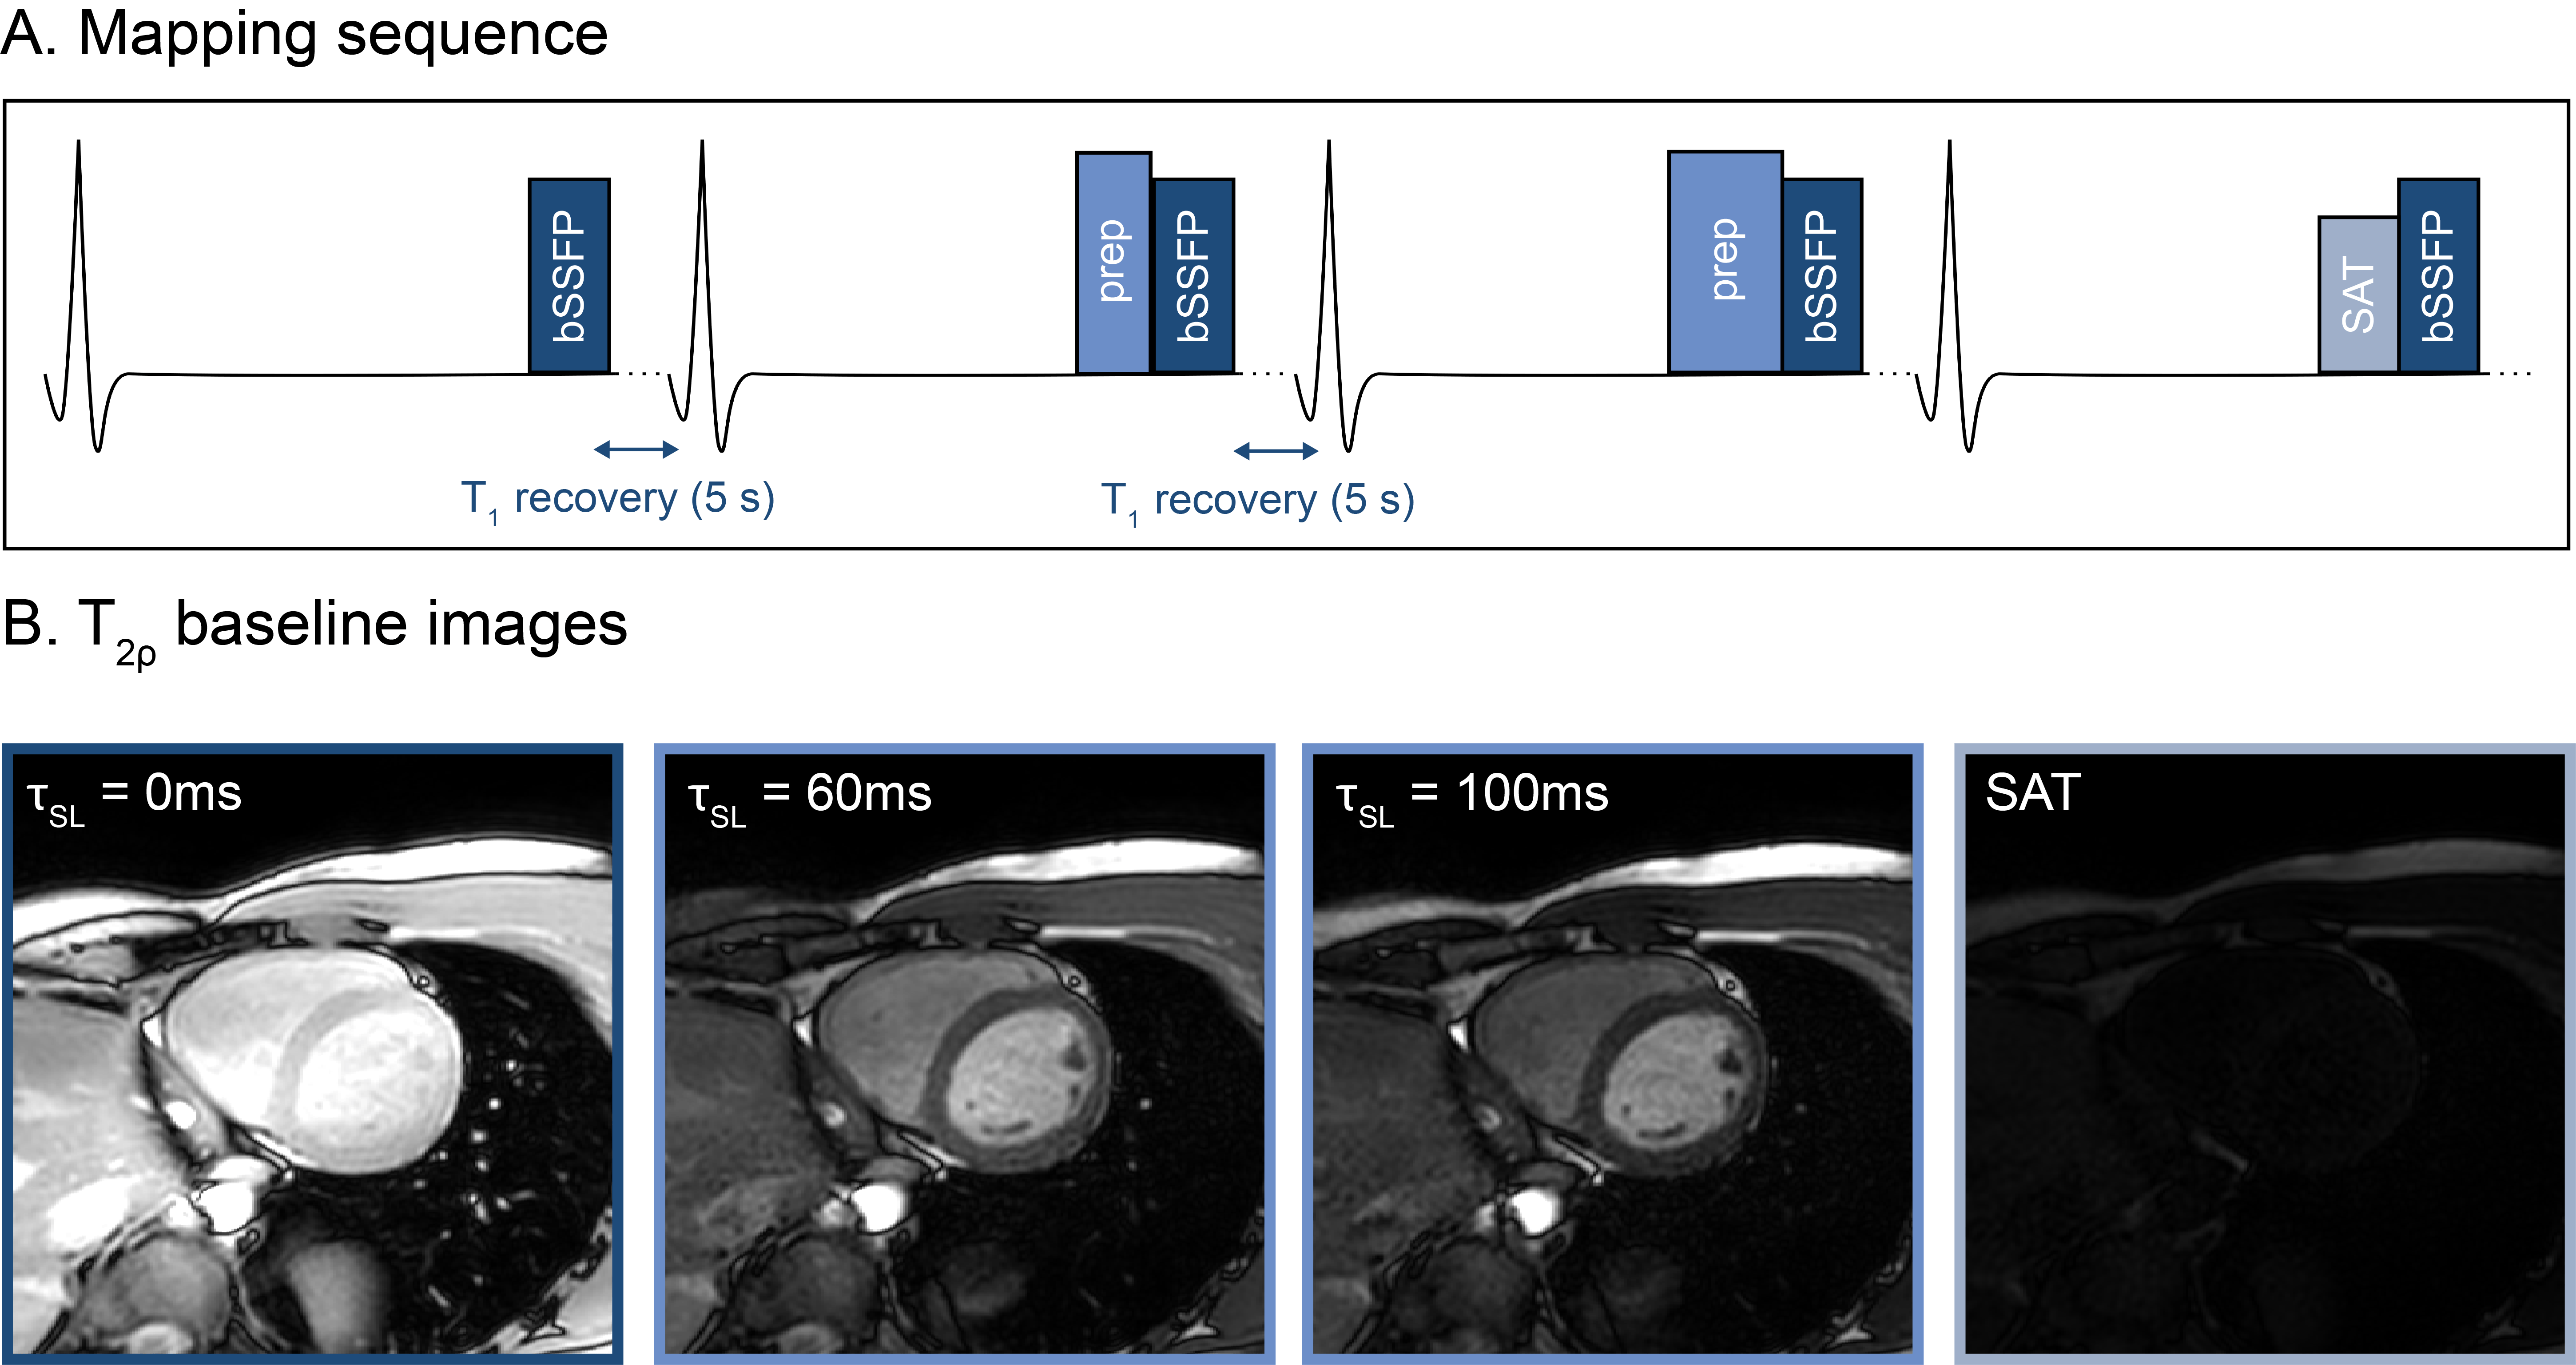
Adiabatic T2ρ preparations were implemented by adding adiabatic half passage (AHP) pulses before (flip-down) and after (flip-up) a T1ρ preparation module, consisting of pairs of hyperbolic secant (HS) adiabatic full passage (AFP) pulses, as previously proposed for cardiac T1ρ mapping (Fig. 1) [6]. The pulse duration was chosen as 𝜏AFP=2⨉𝜏AHP=20ms, to achieve good adiabaticity while allowing sufficiently dense sampling of the T1ρ /T2ρ decay in vivo. Bloch simulations of the preparation efficiency (Mz/M0) were used to determine the optimal HS width ꞵ and frequency sweep amplitude fmax over a design region with off-resonance∈[-200, 200]Hz and relative B1+∈[0.5,1]. Adiabatically-refocused T2 preparations were used for reference T2 maps [7].Imaging was performed at 3T (Ingenia, Philips). An ECG-triggered single-shot bSSFP sequence (resolution=2x2x8mm3, TE/TR=1.2/2.4ms) was used for mapping during a single 14s breath-hold. The sequence consisted of one baseline image with no preparation, two T1ρ, T2ρ, or T2-prepared baseline images (𝜏SL=40,80ms for T1ρ, 𝜏SL=60,100ms for T2ρ, TE=35,55ms for T2), interleaved with 5s rest period, and one saturation-prepared image (Fig. 2). Relaxation time maps were generated using a 3-parameter model [6].
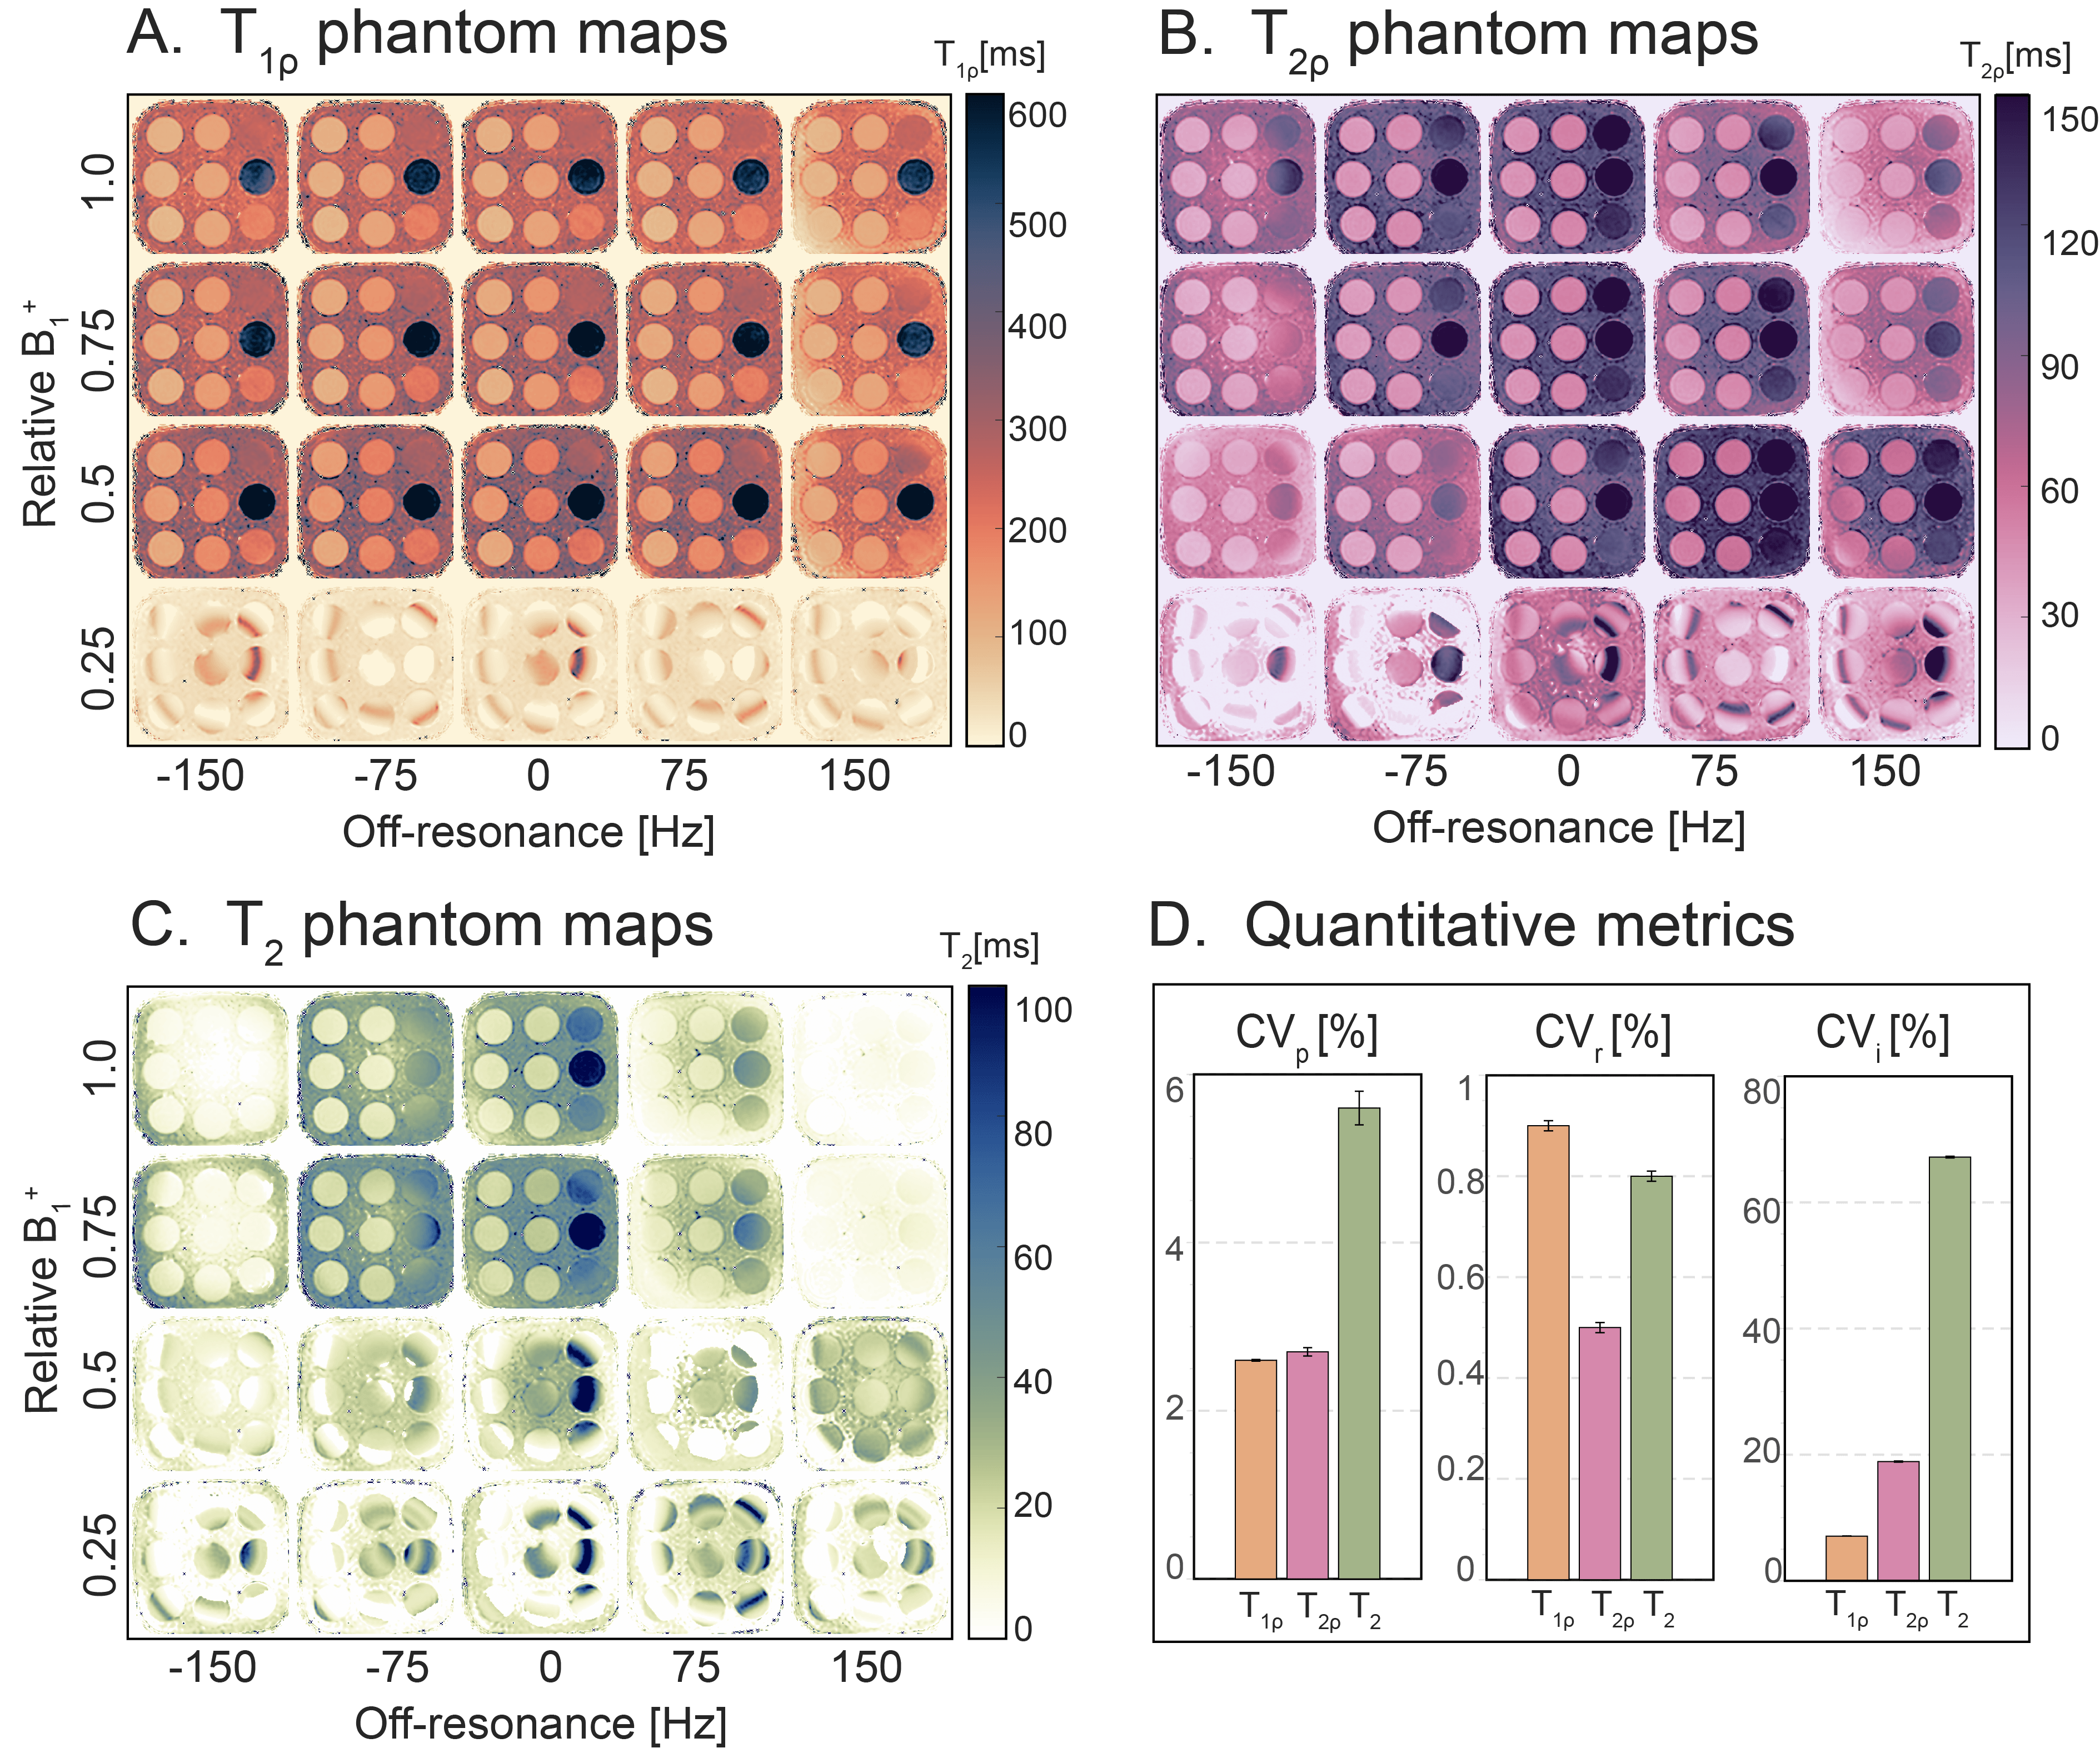
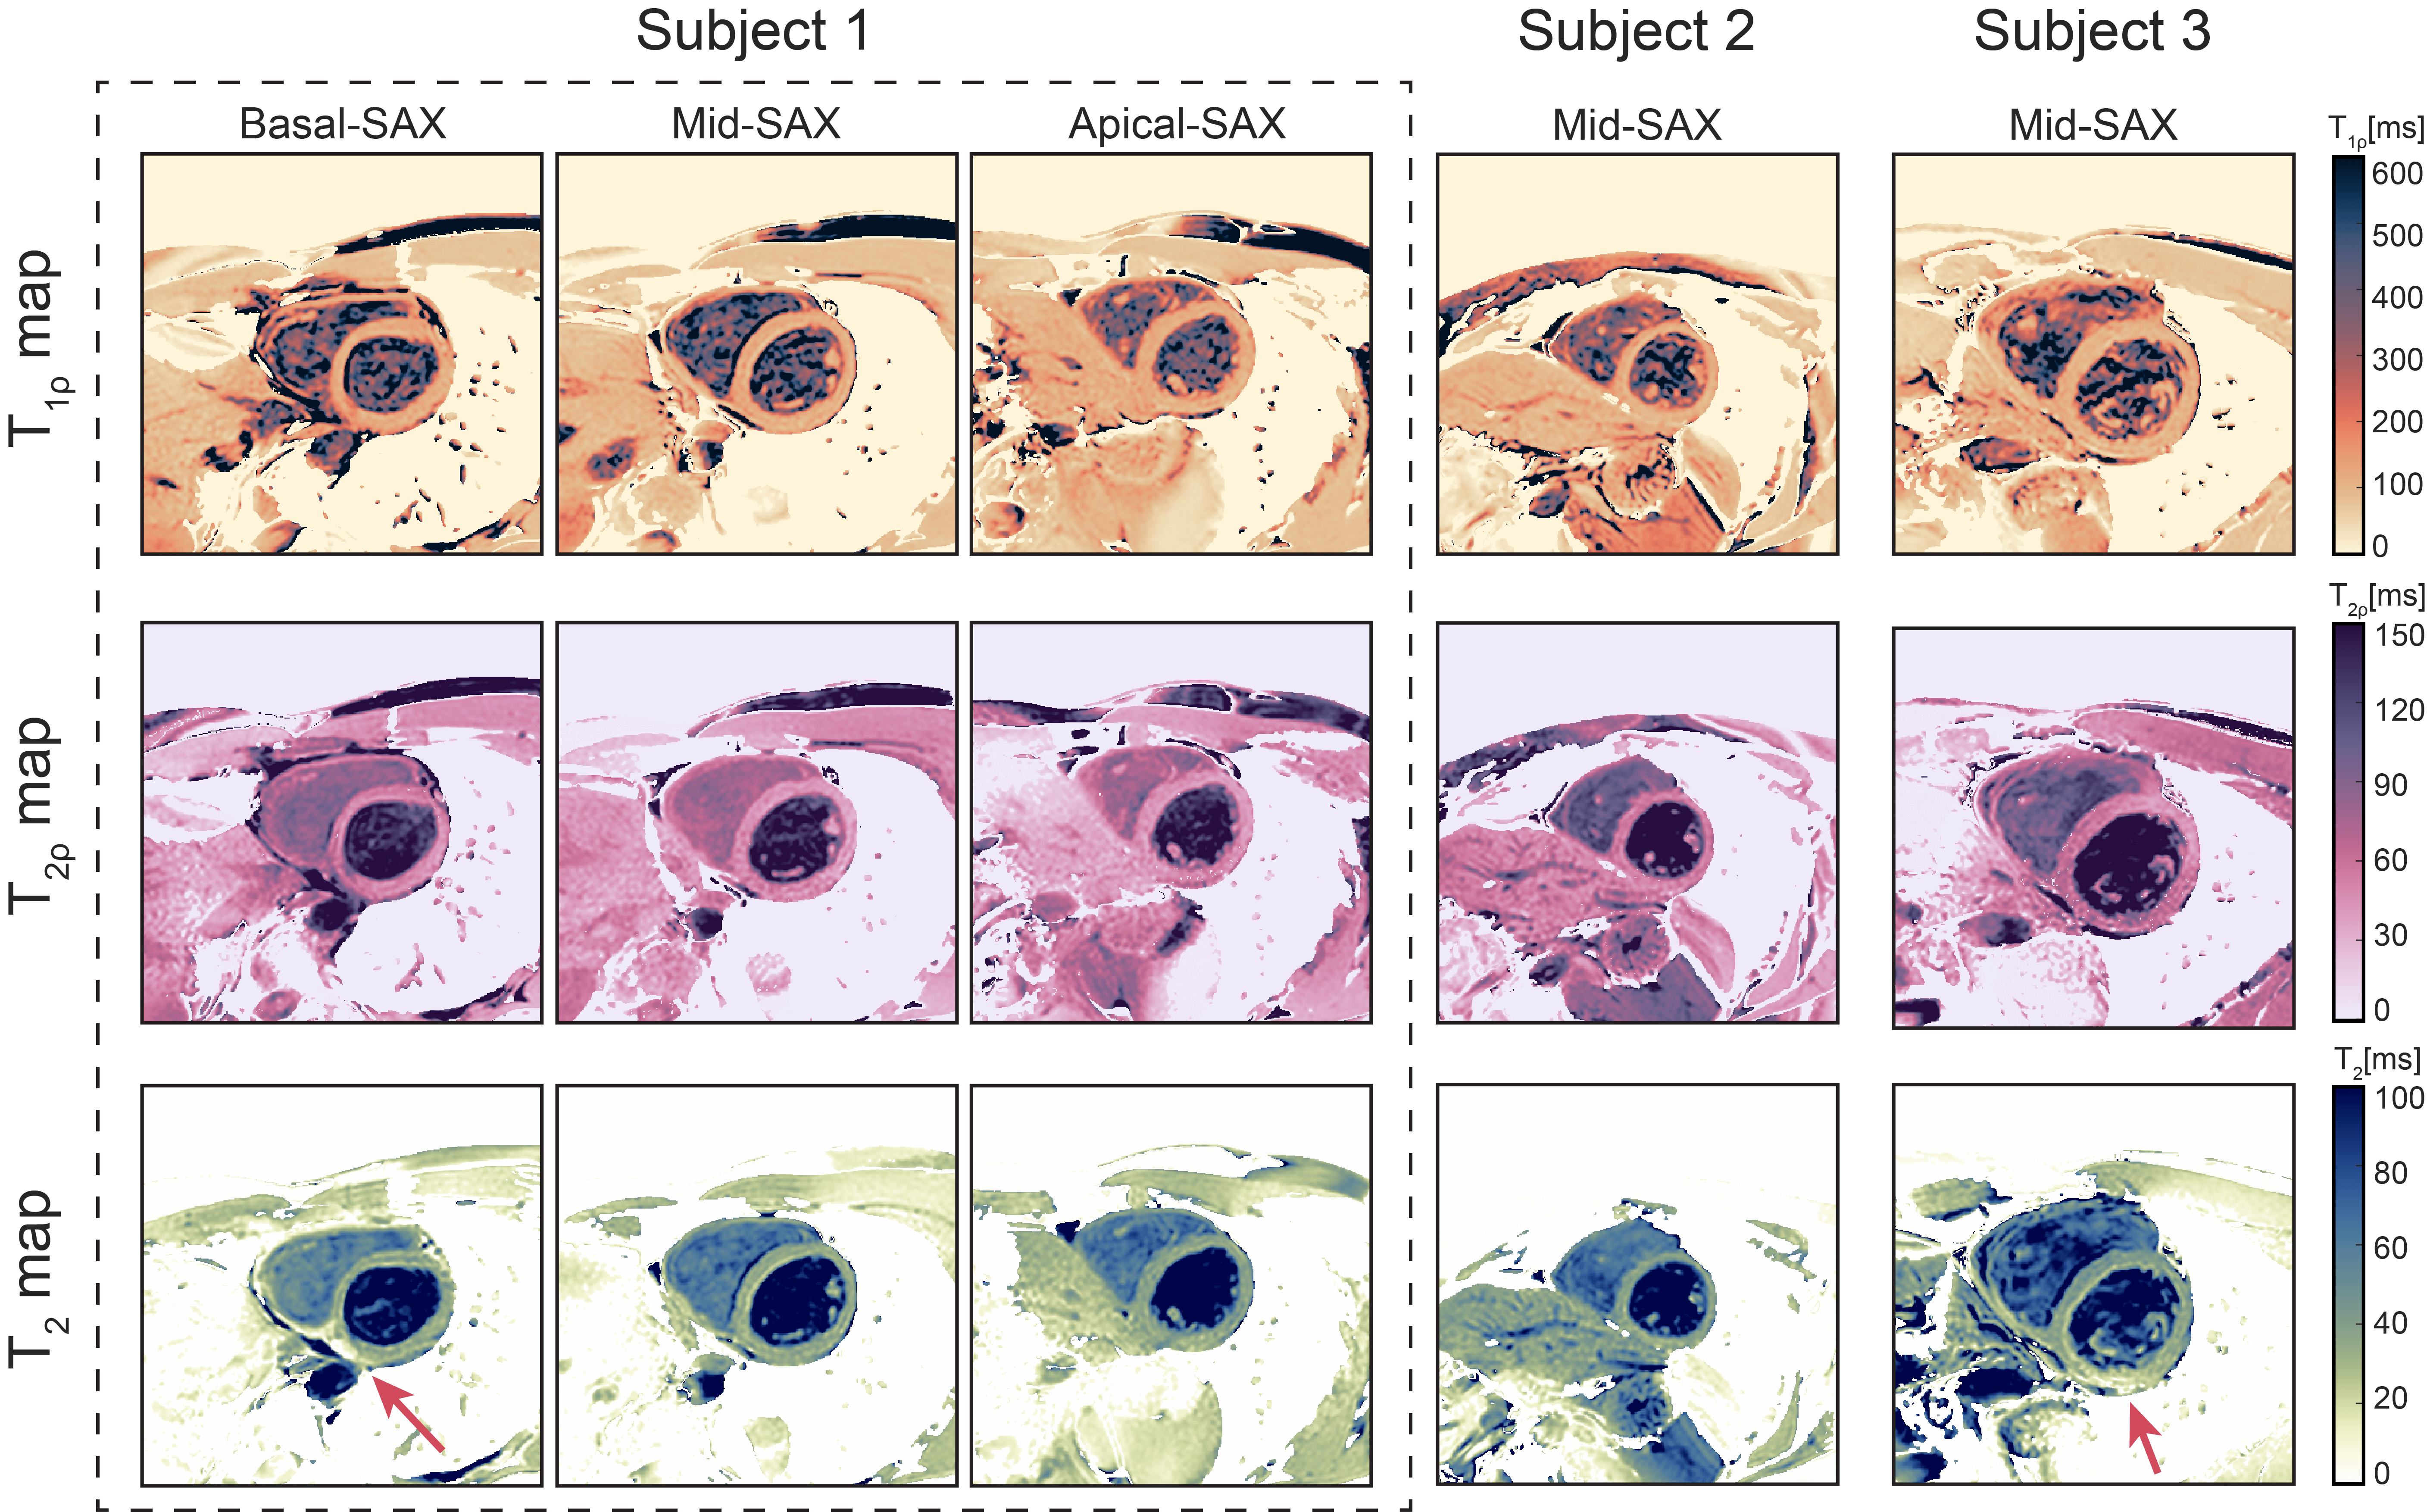
T1ρ, T2ρ, and T2 mapping were performed in the T1MES phantom for artificially-induced off-resonance=-150,-75,...,150Hz and relative B1+=0.25,0.5,...,1 to investigate resilience against field inhomogeneities (CVi) and repeatability (CVr) over 10 repetitions. In vivo T1ρ, T2ρ, and T2 maps were obtained for 3 short-axis (SAX) slices in 5 healthy subjects (2f, 34.2±11.6yrs). Precision (CVp) and reproducibility across subjects (CVs) were measured for the 16-AHA segments. Pair-wise Mann-Whitney U-tests were used to assess the statistical significance of differences between T1ρ, T2ρ, and T2 mapping metrics.
Results
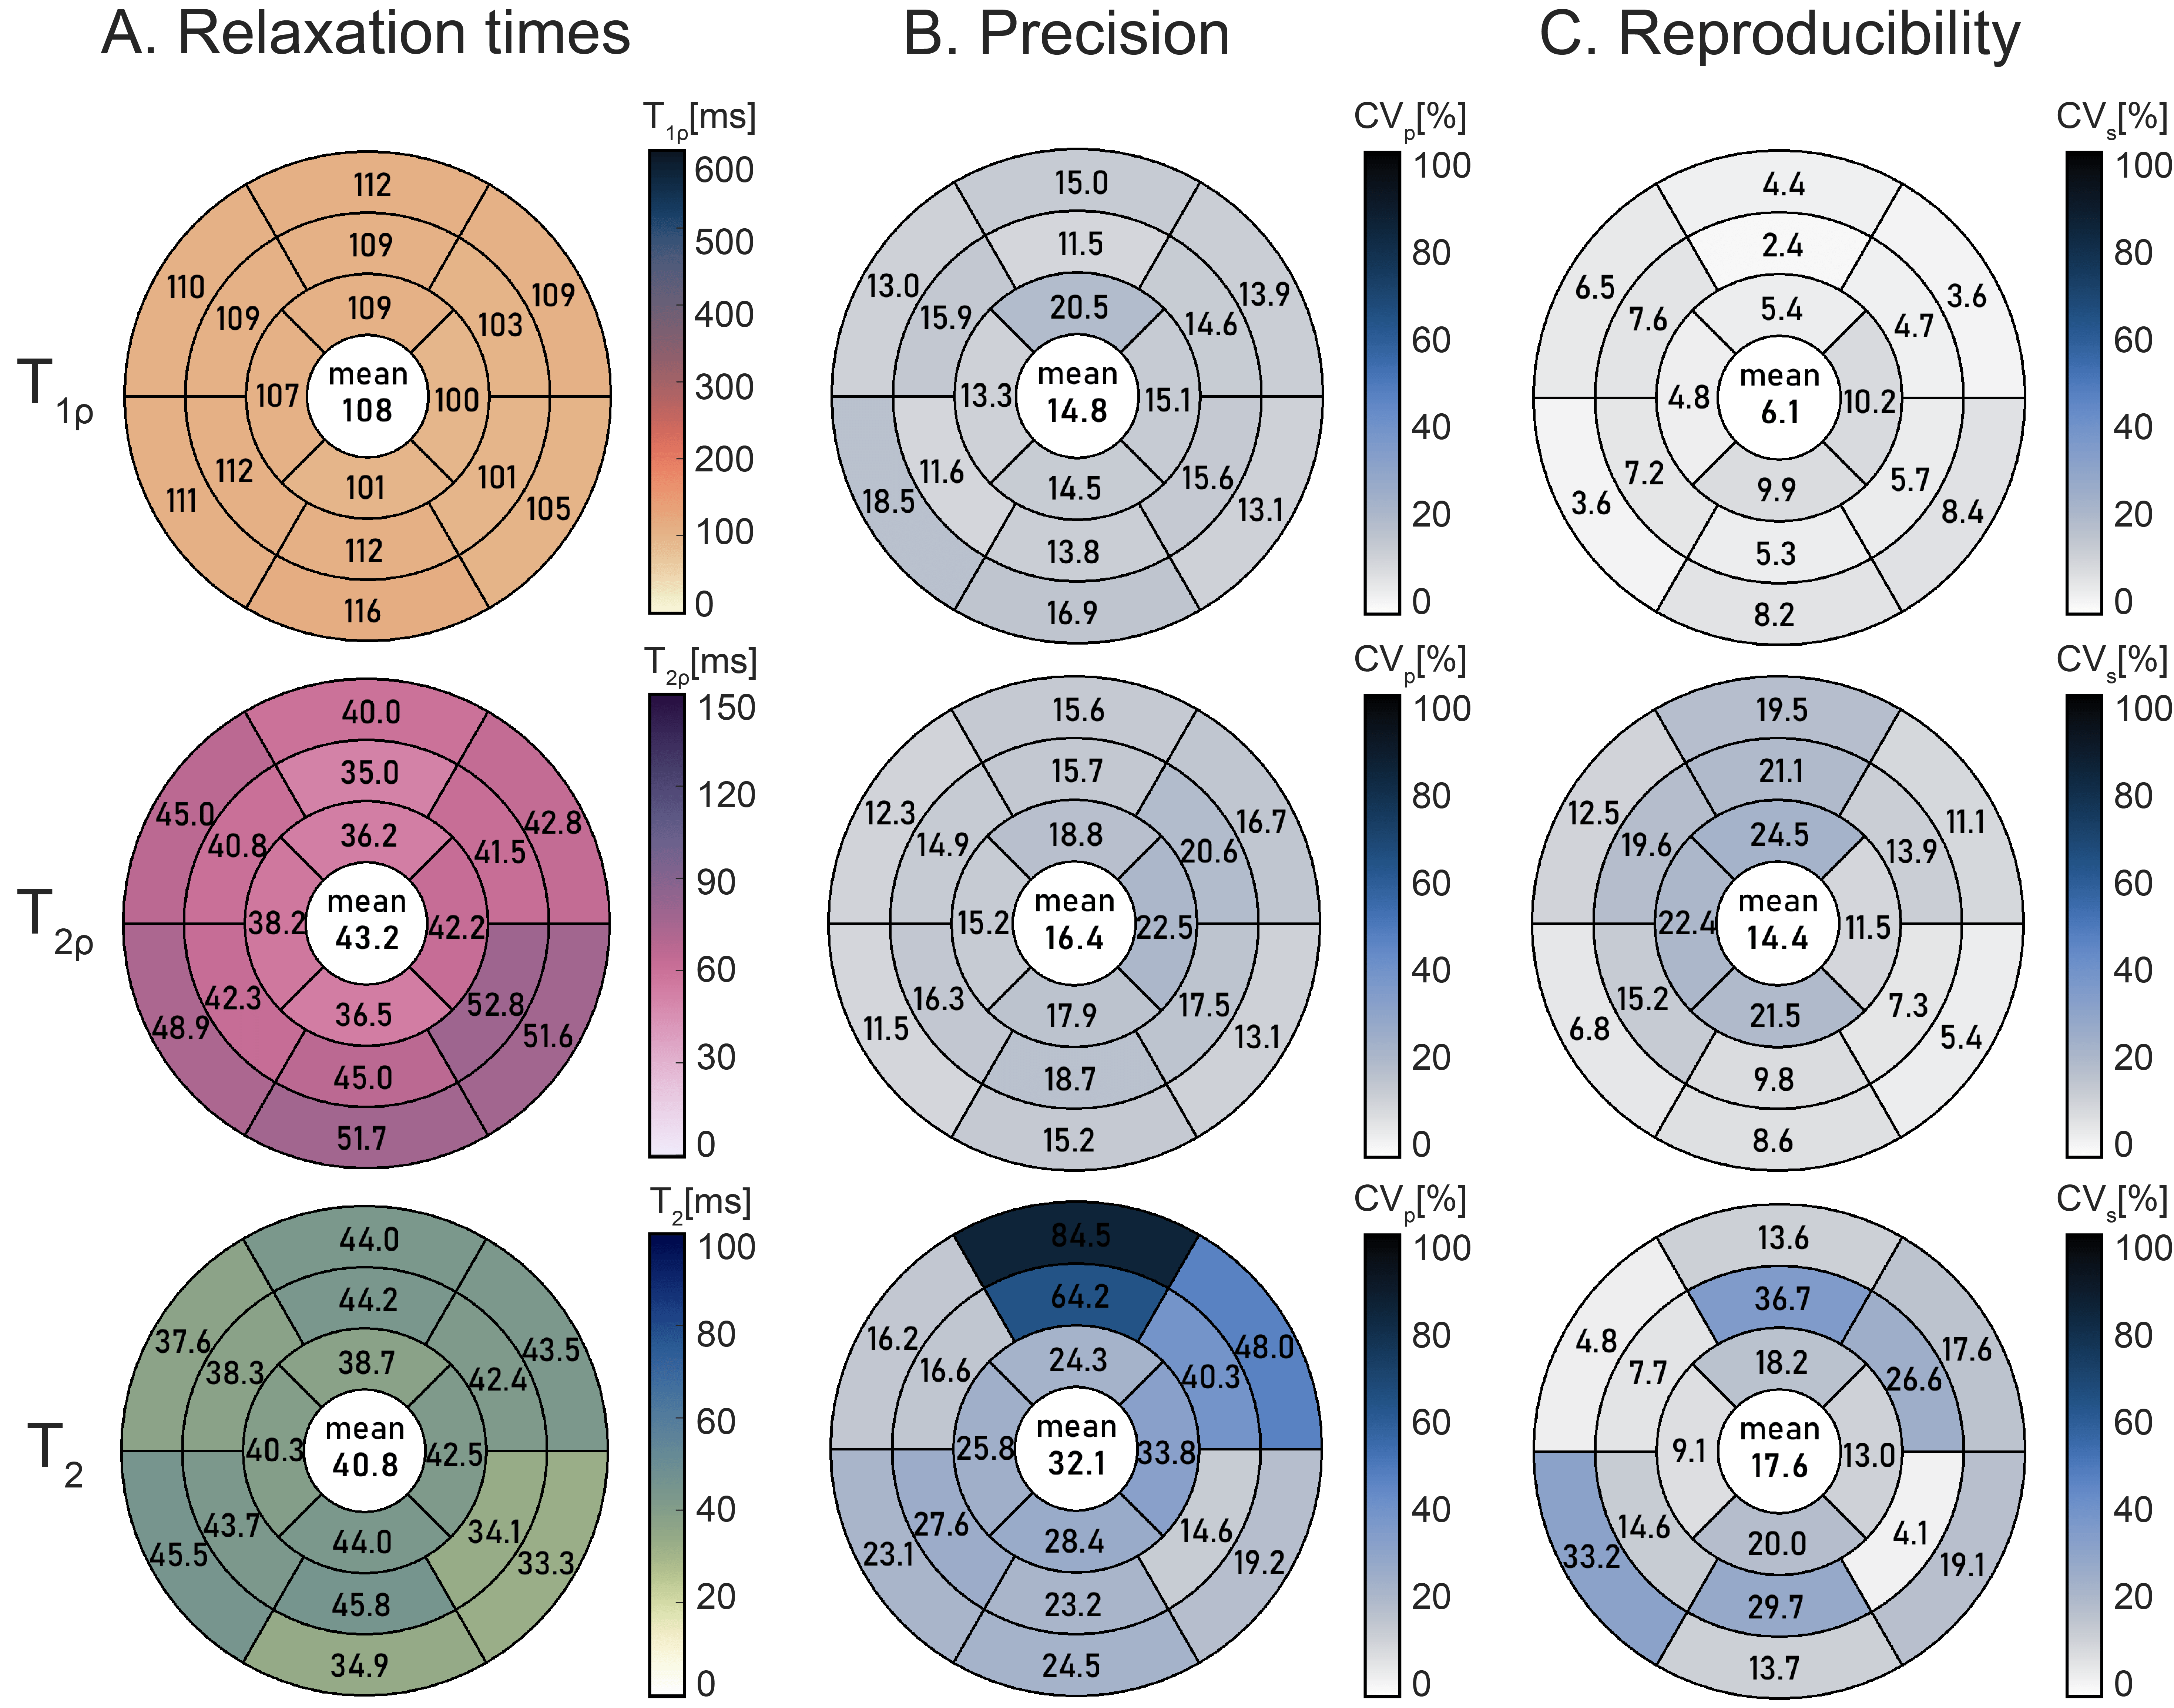
β=4.5 and fmax=325Hz were chosen as the optimal parameters for AHP and AFP pulses in T1ρ and T2ρ preparations, yielding average preparation efficiency over the design region of 0.99 and 0.95, respectively (Fig. 1C-D). Average values in the myocardium-like phantom vial were: T1ρ=115.2±5.4ms, T2ρ=58.1±1.6ms, T2=55.3±3.1ms (Fig. 3). In phantom T2ρ maps yielded better precision than T2 (CVp=2.7 vs 5.6%), comparable repeatability (CVr=0.5 vs 0.8%), and higher resilience against B0 and B1+ inhomogeneities (CVi=18.9 vs 67.2%). In vivo T1ρ, T2ρ, and T2 maps showed good quality and homogeneous myocardial values (Fig. 4). However, T2 maps presented residual off-resonance artifacts in some volunteers. Average myocardial values were: T1ρ=108.0±15.9ms, T2ρ=43.2±6.8ms,T2=40.8±15.5ms (Fig. 5). Overall, T2ρ maps yielded worse precision (CVp=16.4% vs 14.8%, p=0.04) and reproducibility (CVs=14.4% vs 6.1%, p<0.01) than T1ρ, but significantly better than T2 (CVp=32.1%, p<10-3; CVs=17.6%, p=0.02).Discussion
In this work, we investigated the use of adiabatic T2ρ preparations for rotating frame relaxometry of the myocardium at 3T.Similarly to adiabatic T1ρ, adiabatic T2ρ preparations apply a temporally-varying effective field. Consequently, adiabatic T2ρ relaxation is sensitive to interactions across a spectrum of frequencies, contrary to conventional spin-locks or pure T2 mapping. Thus, its sensitivity to pathological alterations warrants further investigation in clinical studies.
T2 mapping is commonly measured using T2 preparations with lengthy adiabatic refocusing pulses to ensure B0 and B1+ resilience. During those pulses, the magnetization is subject to T2ρ decay, yielding a mixed contrast. To assess the T2 decay exclusively during free relaxation, long preparations are required, limiting the dynamic range of the measurement. Adiabatic T2ρ mapping, on the other hand, allows for prolonged adiabatic pulses, while staying true to the definition of its measurand. Therefore, T2ρ mapping may present a promising alternative to T2 mapping, with increased resilience against field inhomogeneities and the promise of improved reproducibility.
Conclusions
The proposed adiabatic T2ρ sequence enabled myocardial parameter mapping with high resilience against B0 and B1+ inhomogeneities and could represent a complementary relaxation parameter to T1ρ, suitable for mapping at high field strengths.Acknowledgements
S.W. acknowledges funding from the NWO (Start-up STU.019.024), and the European Union (ERC, VascularID, StG 101078711).References
[1] Michaeli, S., Sorce, D. J., & Garwood, M. (2008). T2ρ and T1ρ adiabatic relaxations and contrasts. Current Analytical Chemistry, 4(1), 8-25.
[2] Bustin, Aurelien, et al. "Magnetic resonance myocardial T1ρ mapping: Technical overview, challenges, emerging developments, and clinical applications." Journal of Cardiovascular Magnetic Resonance 25.1 (2023): 34.
[3] Wheaton, Andrew J., et al. "T2ρ‐weighted contrast in MR images of the human brain." Magnetic Resonance in Medicine: An Official Journal of the International Society for Magnetic Resonance in Medicine 52.6 (2004): 1223-1227.
[4] Nestrasil, I., Michaeli, S., Liimatainen, T., Rydeen, C. E., Kotz, C. M., Nixon, J. P., ... & Tuite, P. J. (2010). T 1ρ and T 2ρ MRI in the evaluation of Parkinson’s disease. Journal of neurology, 257, 964-968.
[5] Gram, Maximillian et al. “Myocardial T2ρ Mapping in Small Animals: Comparison of Balanced Spin-Lock and Malcolm-Levitt Preparations.” ISMRM 2023:0173.
[6] Coletti, Chiara, et al. "Robust cardiac T1ρ mapping at 3T using adiabatic spin‐lock preparations." Magnetic Resonance in Medicine (2023).
[7] Nezafat, Reza, et al. "B1‐insensitive T2 preparation for improved coronary magnetic resonance angiography at 3 T." Magnetic Resonance in Medicine: An Official Journal of the International Society for Magnetic Resonance in Medicine 55.4 (2006): 858-864.
Figures