0688
Non-invasive quantification of myocardial volume oxygen consumption using free-breathing, ungated, self-calibrated MR blood oximetry1Biomedical Imaging Research Institude, Cedars-Sinai Medical Center, Los Angeles, CA, United States, 2krannert cardiovascular research center, Indiana University School of Medicine, Indianapolis, IN, United States, 3Bioengineering, UCLA, Los Angeles, CA, United States, 4Department of Radiological Sciences, David Geffen School of Medicine, UCLA, Los Angeles, CA, United States, 5Radiology, Weill Cornell Medicine, New York, NY, United States
Synopsis
Keywords: Heart Failure, Heart, myocardial volume oxygenation consumption
Motivation: Whole-heart myocardial oxygen consumption (MVO2) is the central factor that determines cardiac function and is a sign of heart diseases.
Goal(s): We proposed a high-resolution, free breathing, cardiac-phase resolved sequence to quantify MVO2 in the beating hearts.
Approach: Healthy pigs were scanned at 3T. Coronary sinus images were acquired with a continuous, free-breathing, Radial T2Prep-IR sequence with flow compensation and water excitation and a 2D phase contrast sequence to quantify the MVO2. Invasive ground truth was also measured to verify the accuracy of our estimation.
Results: The proposed method measured comparable SbO2,OEF,MBF and MVO2 values to the invasive ground truth.
Impact: The proposed free-breathing, motion-resolved cardiac MR Oximetry technique has the potential to non-invasively measure accurate myocardial oxygen consumption without using ionizing radiation and exogenous contrast agents.
Background
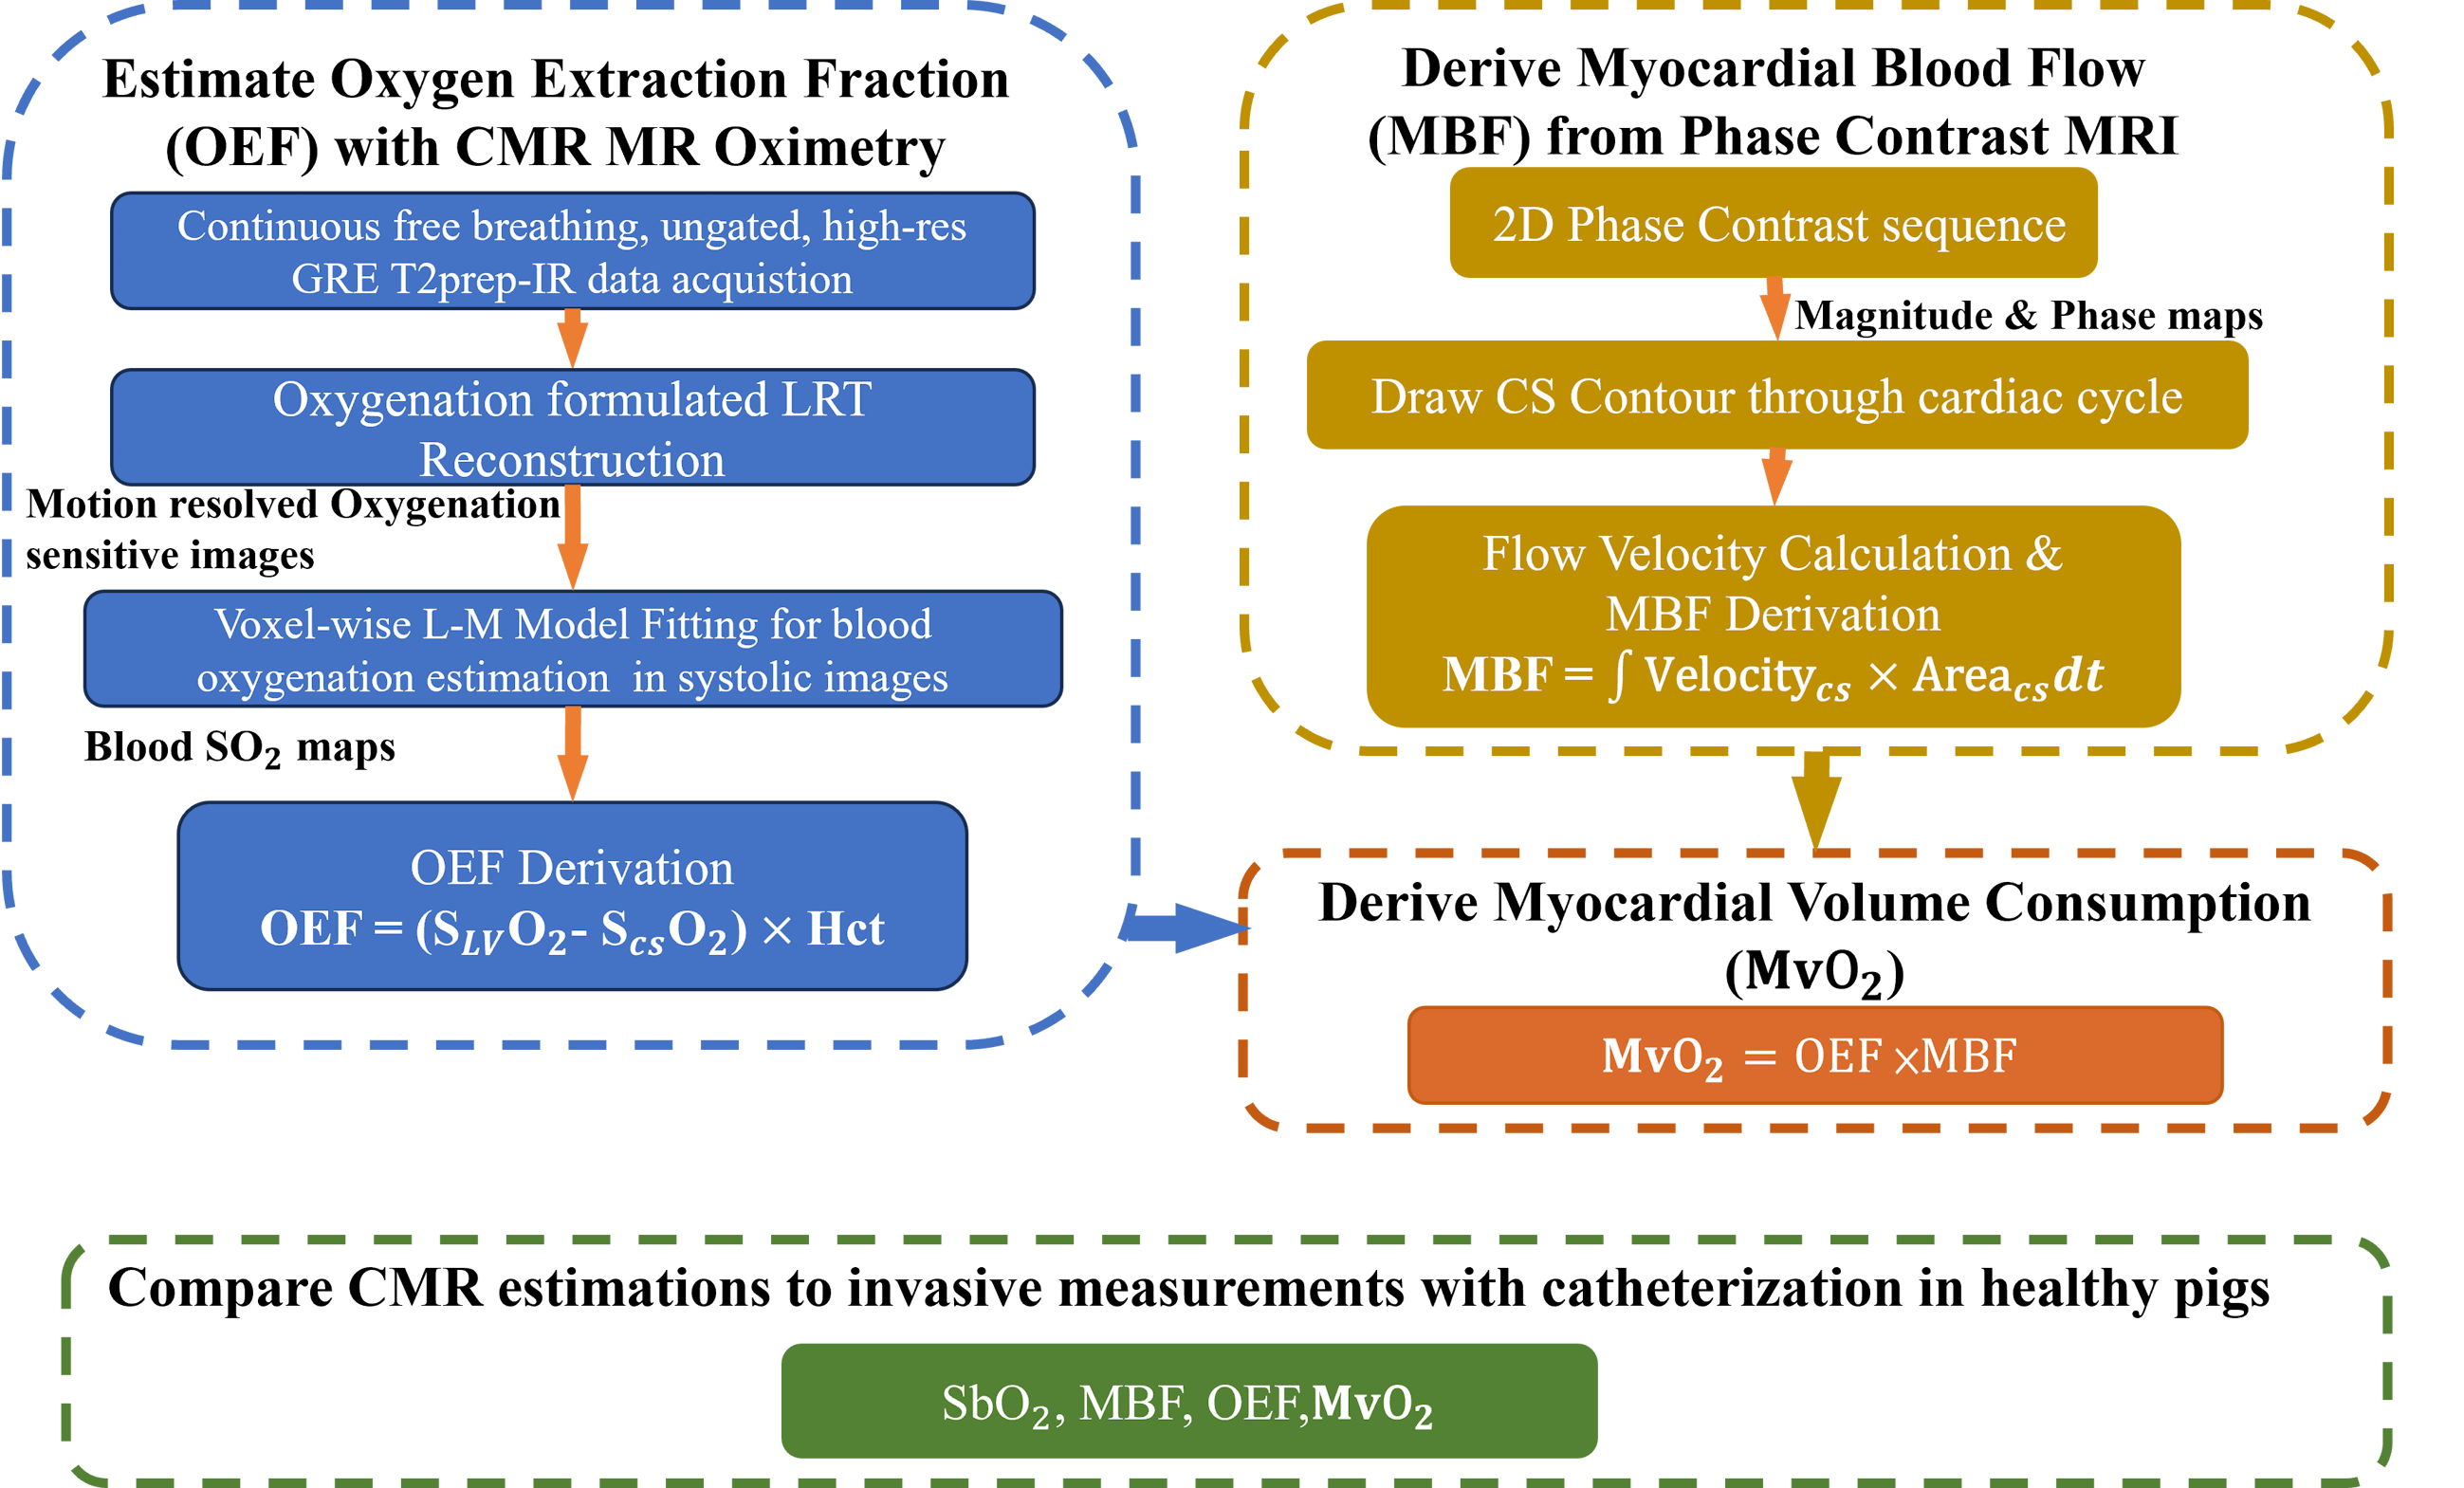
Cardiac energy consumption is the central factor that determines cardiac function and is the hallmark sign of many heart diseases(e.g., heart failure and different forms of cardiomyopathy). The gold standard for staging cardiac energetic changes is based on whole-heart myocardial volume oxygen consumption (MvO2)1 measured by invasive catheterization. A noninvasive MvO2 assessment is critical for the management of the aforementioned chronic diseases and for improving patient outcomes. Because more than 90% of the coronary blood is drained through the coronary sinus (CS), MR oximetry and flowmetry of the CS blood has the potential to non-invasively quantify MvO2 without ionizing radiation and exogenous contrast agent.(Fig. 1) While CS flow measurements have been established in clinical studies using phase contrast MRI2, current CMR oximetry techniques are not suitable for imaging the CS blood due to several limitations, including i) insufficient image resolution and spatial determination of the CS due to its collapsed anatomical footprint during typical diastolic acquisitions (the CS collapses by over 50% during diastole), ii) unreliable image quality from the rapid CS movement throughout the respiratory and cardiac cycles, and iii) inaccurate measurements of MR Oximetry due to blood oxygenation related artifacts(e.g., B0, B1, and flow) 2. To overcome these challenges, we developed a high-resolution, cardiac-phase resolved, and confounder-mitigated MR oximetry sequence in the presence of respiratory motion to quantify MvO2 in the beating hearts. We tested the technique in healthy pigs and validated it against invasive catheterized measurements.Methods
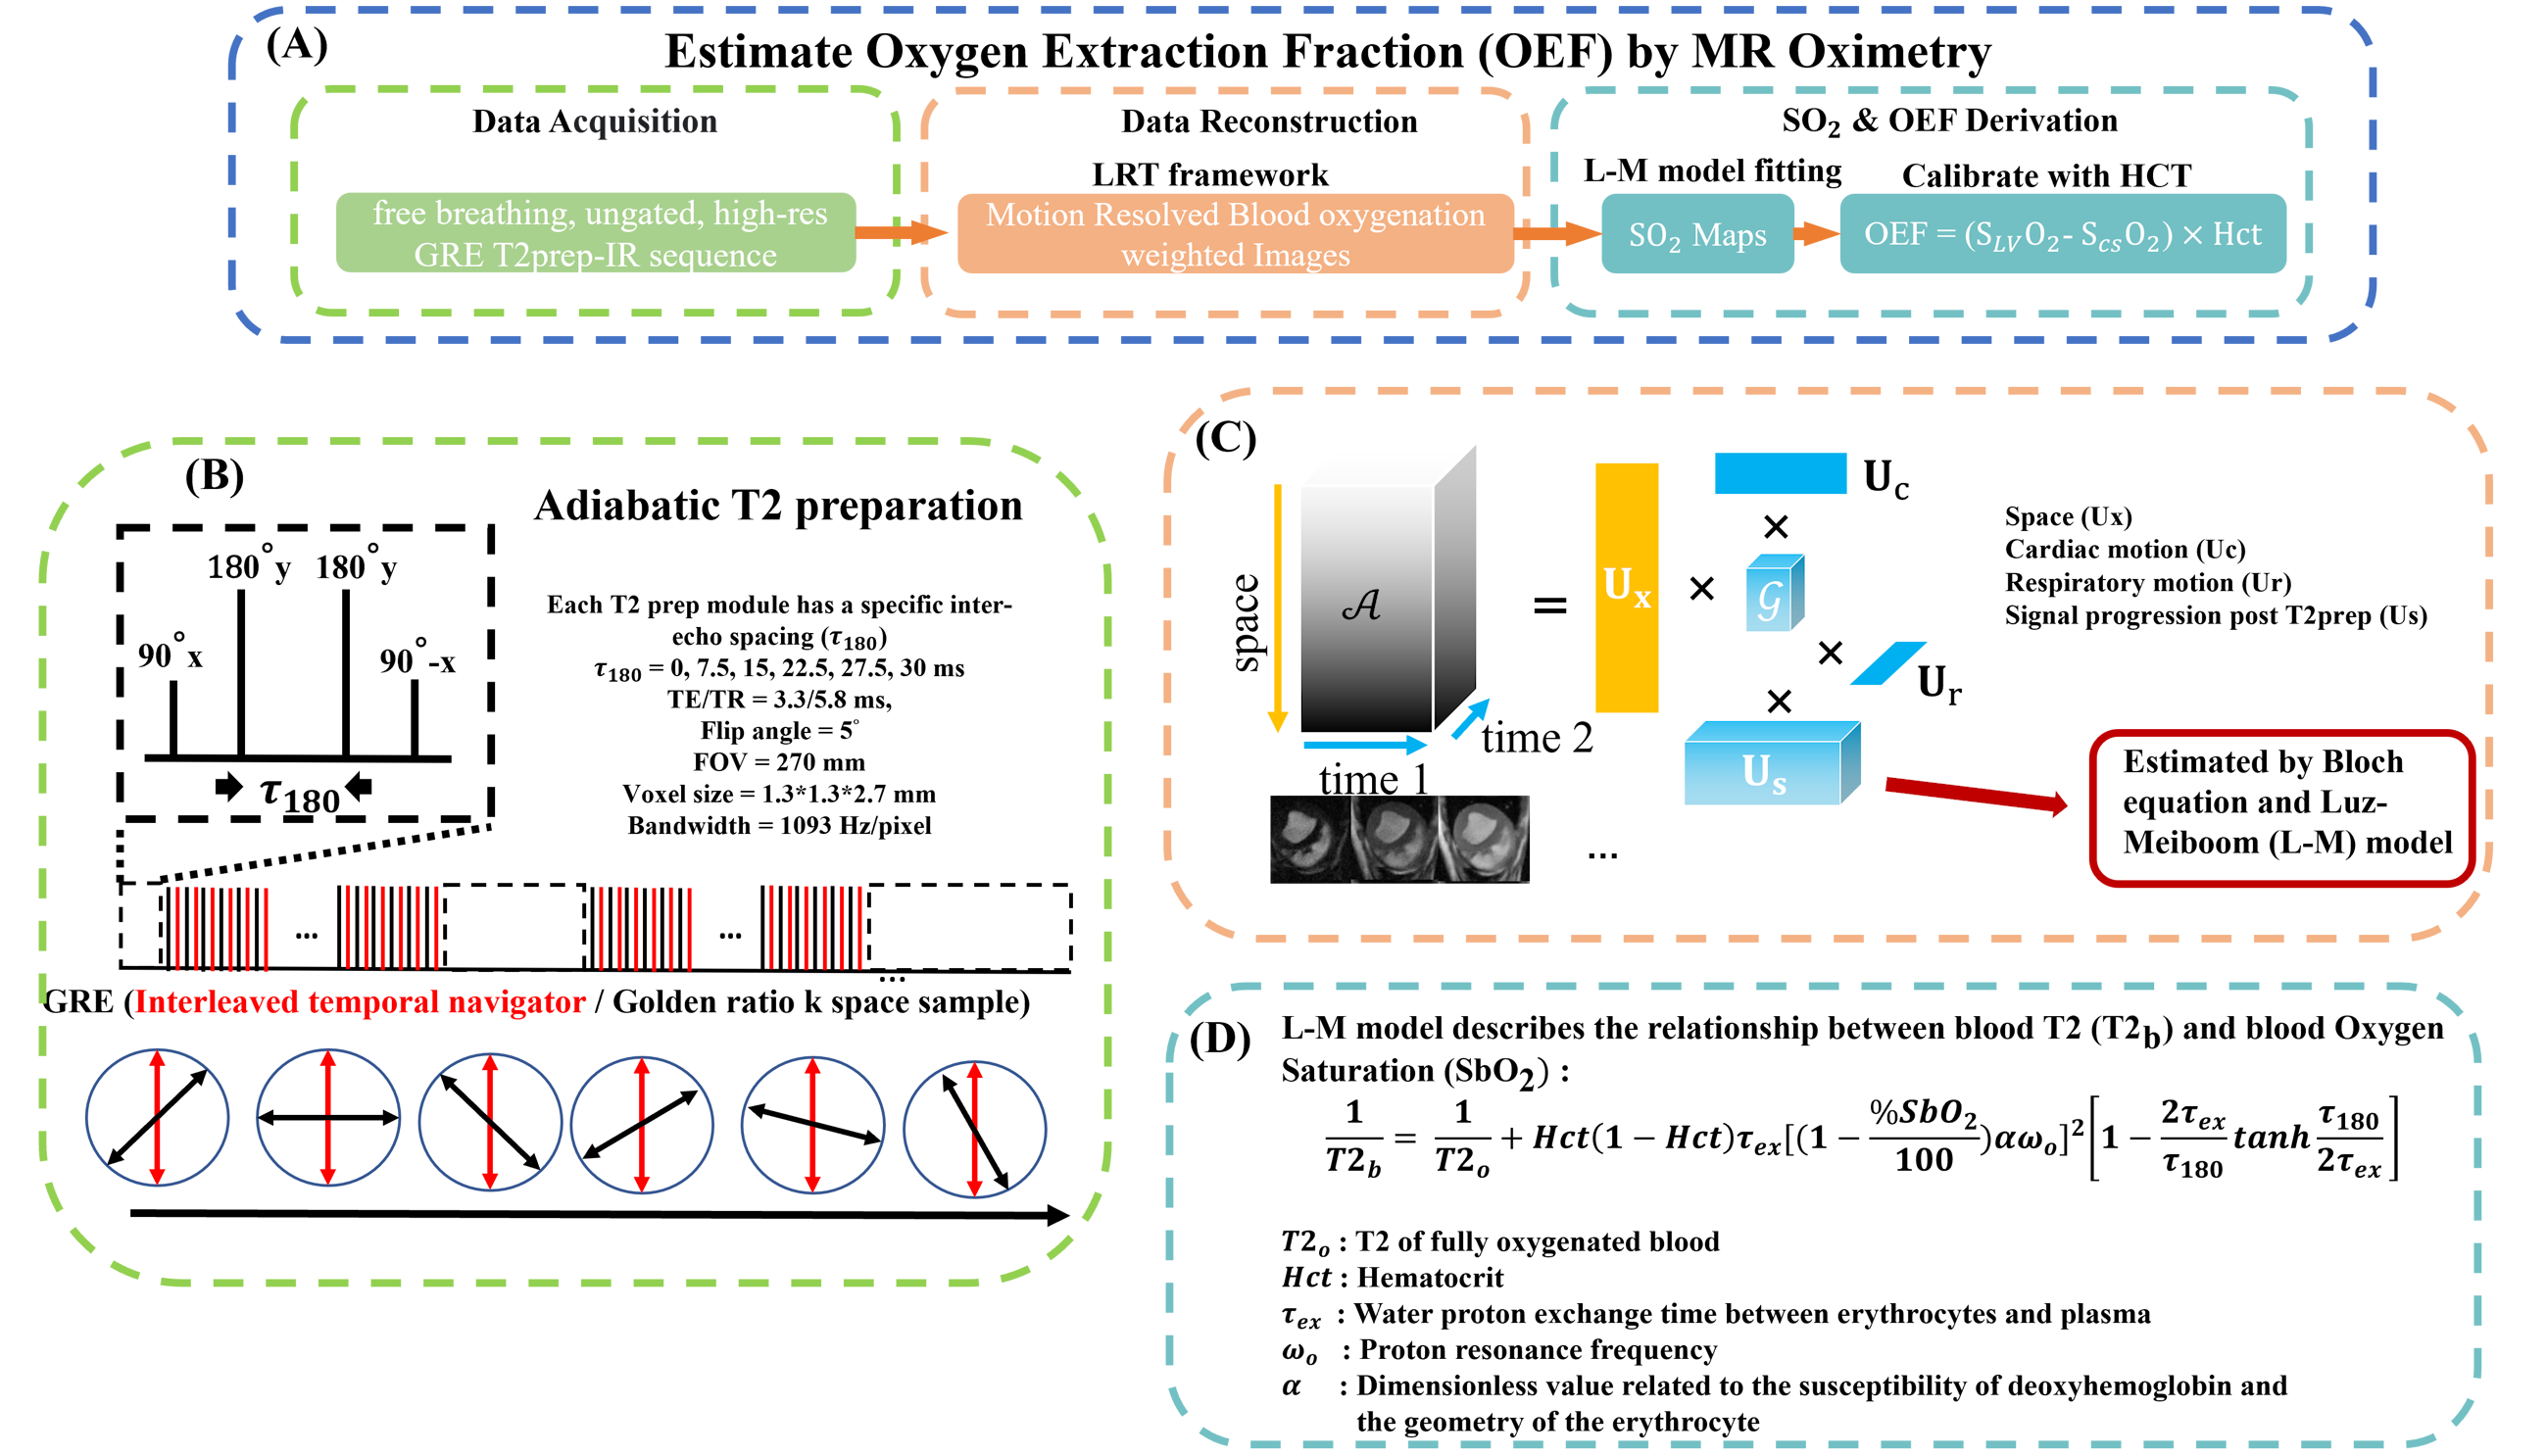
Under institutional approval, healthy pigs (N=3) were studied with a 3T clinical scanner (Biograph mMR, Siemens) and validated against invasive catheterization measurements. During image acquisition, a continuous Radial GRE Prep-IR sequence with flow compensation and water excitation(Fig. 2B) was prescribed at the heart’s mid-slice and the cross-section of the CS to acquire images of the arterial and venous blood. (TE/TR=3.3/5.8ms, FA=5°, FOV=270mm, Voxel=1.3*1.3*2.7mm3, BW=1093 Hz/pixel, T2prep duration = 0,30,60,90,110,120ms). The images were then reconstructed by a blood oxygenation3 formulated Low-Rank Tensor (LRT) model4 to generate motion-resolved blood oxygen saturation(SbO2) maps(Fig. 2C and D). Details of the sequence diagram, image reconstruction framework and blood oxygenation model are illustrated in Fig. 2. Notably, a real-time signal can be reconstructed from the continuously acquired sequence and be used to determine the initial parameters for the L-M model. HCT is measured with blood drawn right before the scan. For MBF derivation, a 2D phase contrast sequence was also used at the CS to attain its blood flow velocity(TE/TR=2.9/41.2ms,FA=20°,FOV=270mm,Voxel=1.3*1.3*6mm3,Bandwidth=445Hz/pixel, ). MBF was calculated using Cvi42 and The of the hearts were estimated. Following the CMR studies, animals were sent to the Cath lab to measure the invasive ground truth of the LV, RV, CS blood oxygen saturation level, and MBF.Results
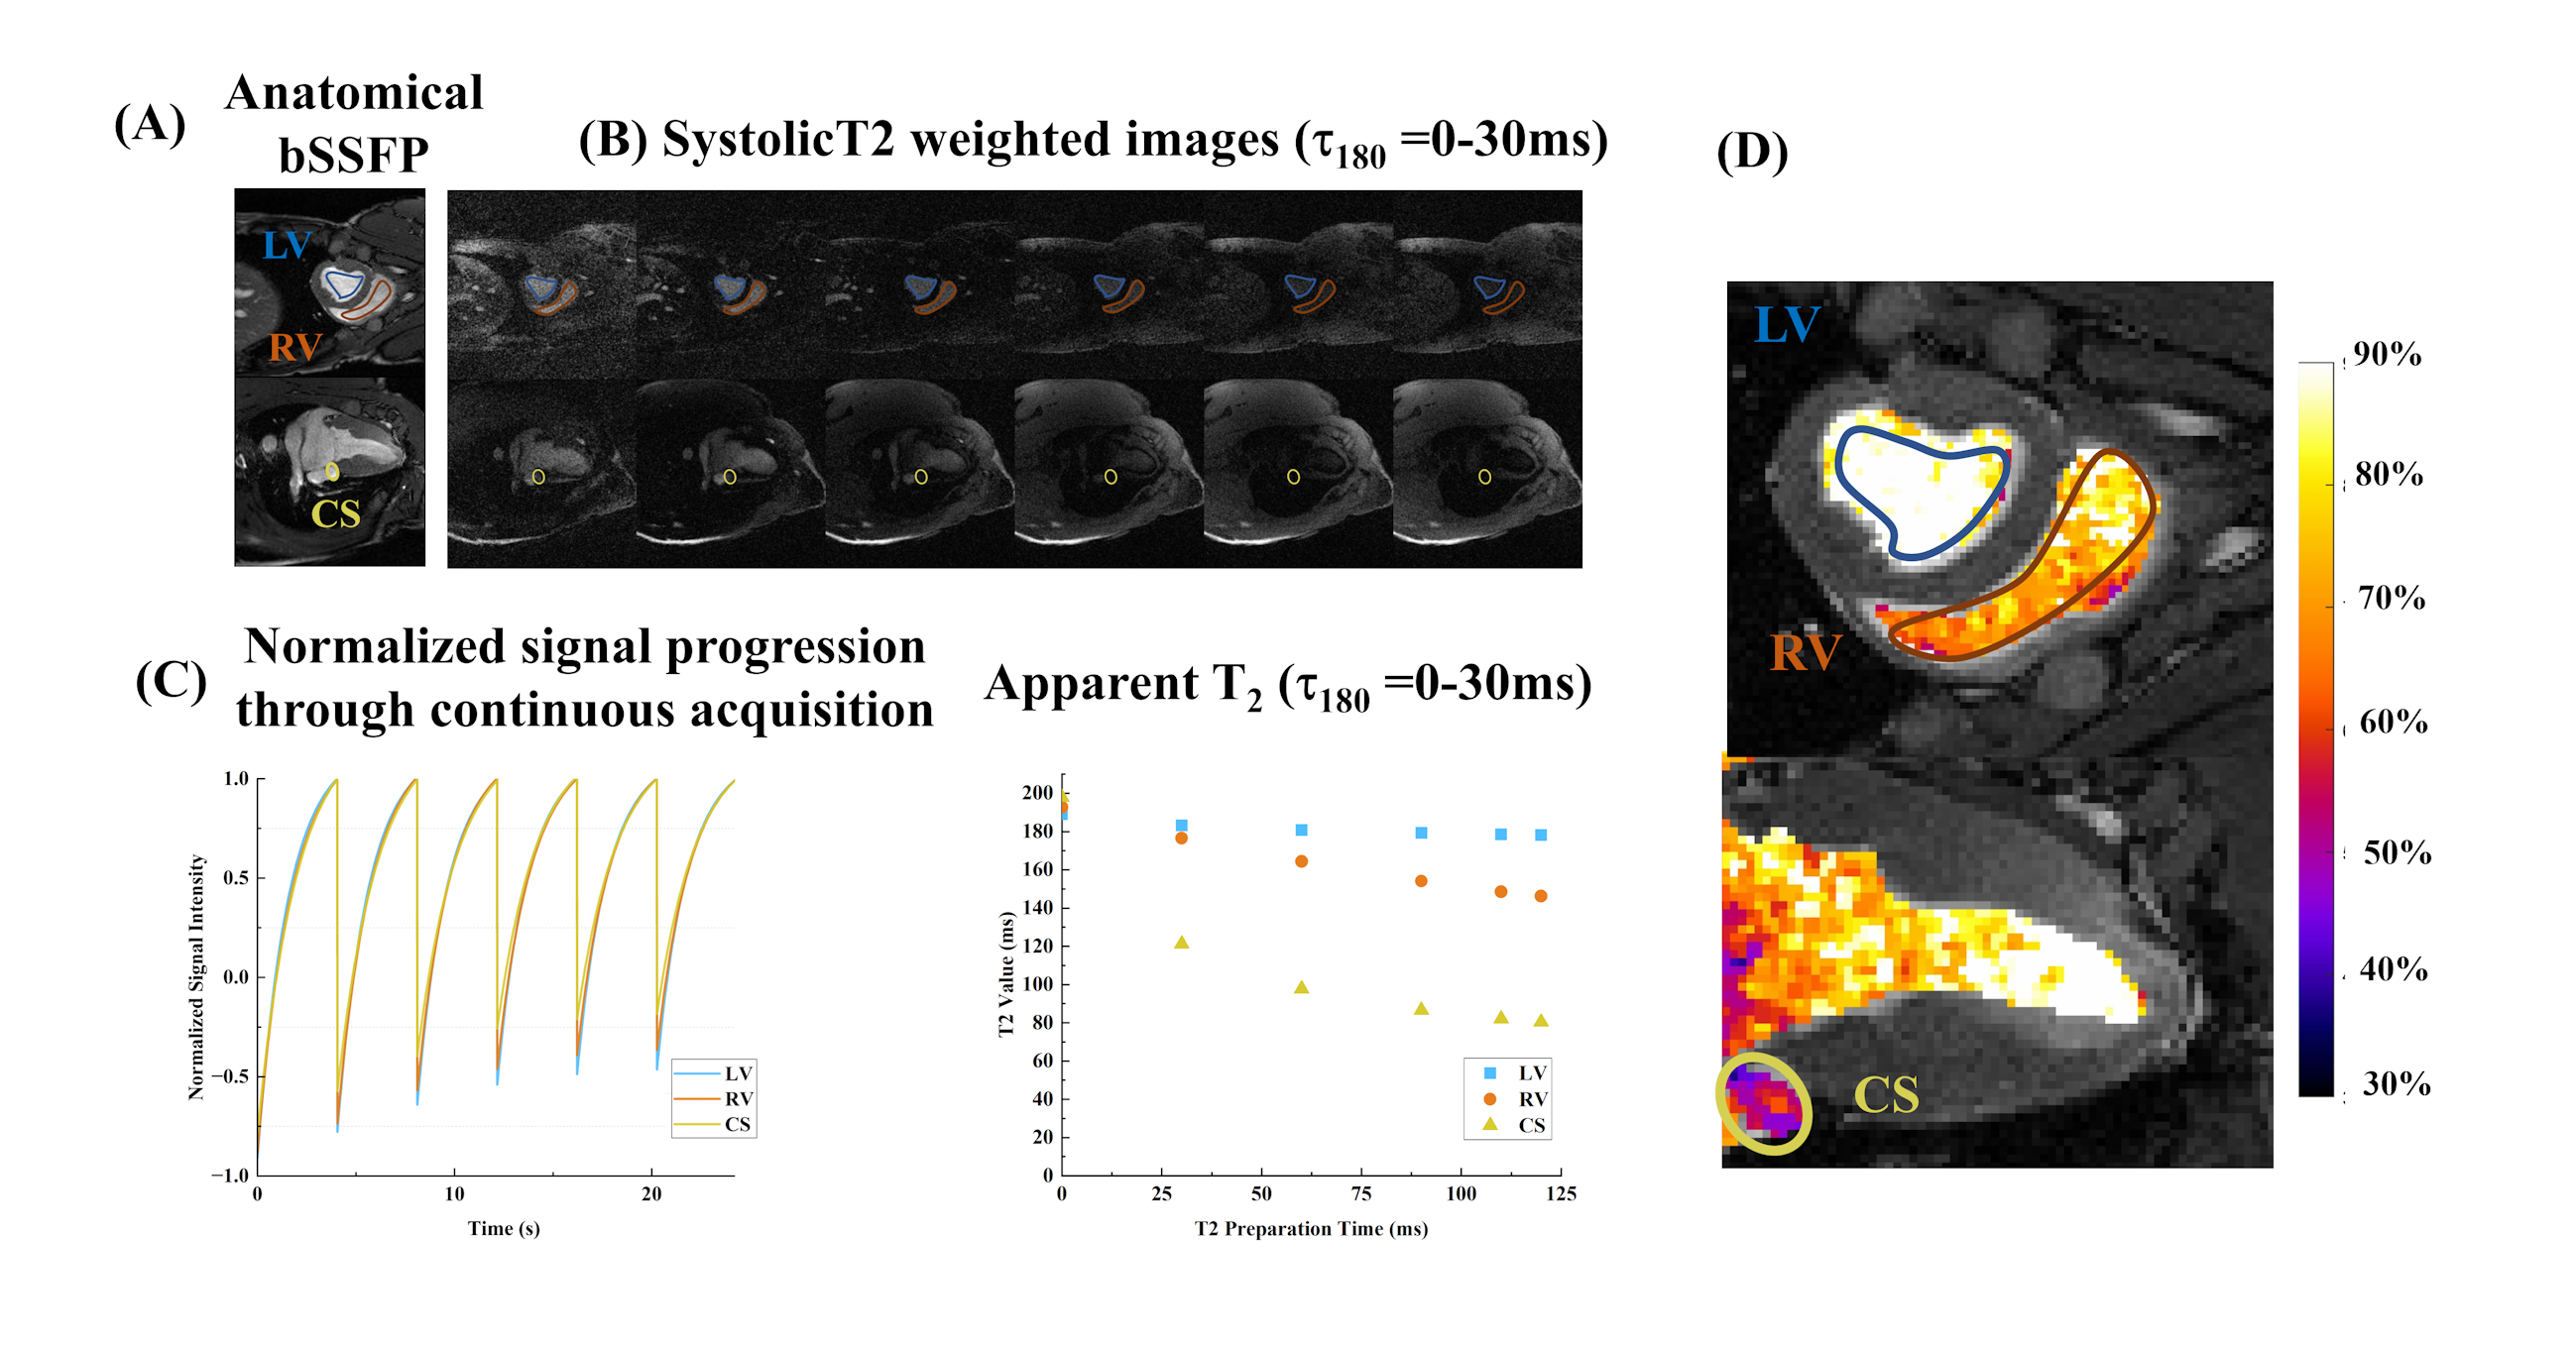
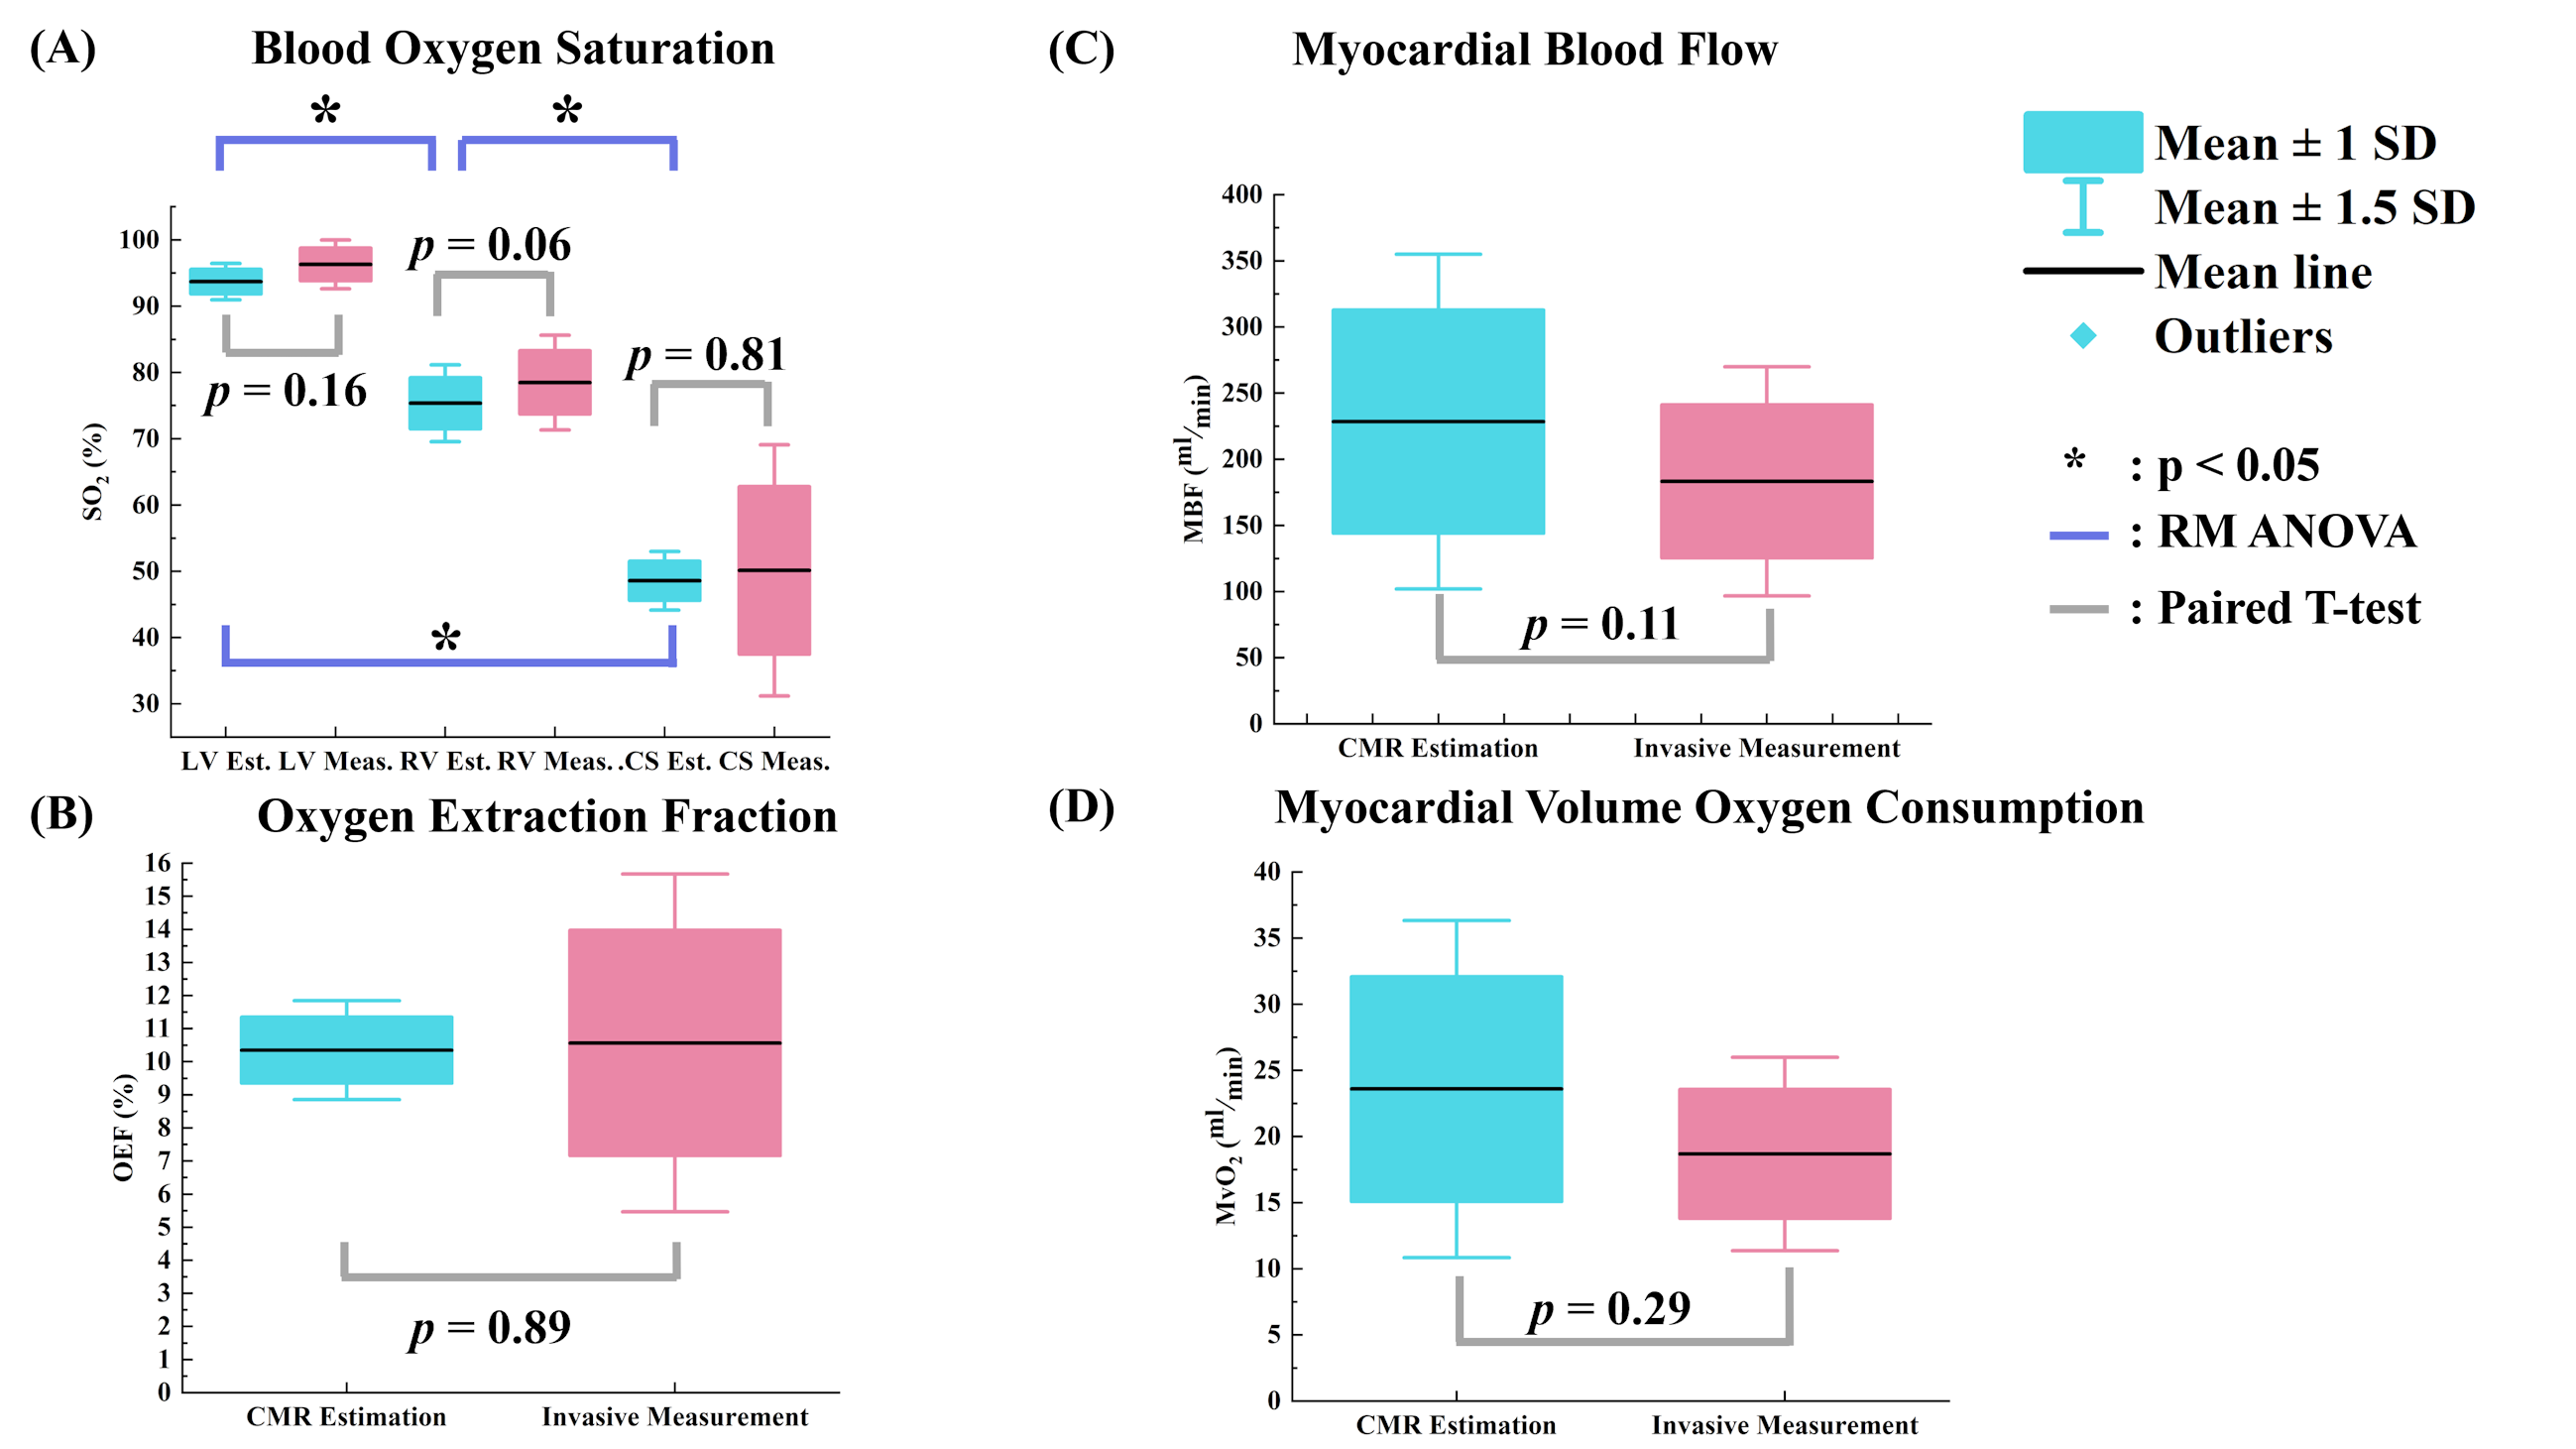
Representative systolic oximetry images of a healthy pig are shown in Fig. 3. The signal progressions of LV, RV and CS blood and the corresponding apparent T2 measured under different refocusing time(t180) are reported in Fig 3B-C. Significant difference in T2 signal progression is shown between the arterial and venous blood. Fig.3D shows the maps derived from the voxel-wise L-M model fitting. Significantly lower SbO2 is measured in the CS compared to the other heart chambers. Quantitative measurements of , OEF, MBF and from all subjects were compared to the invasive ground truth in Fig. 5. For the CMR estimation shown in panel (A), the proposed approach shows comparable means to the ground truth at LV, RV and CS. (LV est. = 93.7±1.9%, LV meas. = 96.3±2.5%, RV est. = 75.4±3.8%, RV meas. =78.5±4.8 %, CS est. = 48.6±2.9%, CS meas. = 50.1±12.6%). The difference of means between estimations in LV, RV and CS are also significant. (all p<0.05)The CMR OEF (B), MBF(C) and MvO2(D) also showed comparable values to the invasive ground truth. (OEF est. = 10.3±1.0%, OEF meas. = 10.6±3.4%, OEF: p = 0.89, MBF est. = 228.5±84.3ml/min, MBF meas. = 183.3±57.7ml/min, MBF: p = 0.11, est. = 23.6±8.5ml/min, meas. = 18.7±4.9ml/min, : p = 0.29)Conclusion and Future Work
In this study, we developed a non-invasive, free breathing technique to quantify and assess the cardiac metabolism of the whole heart. Based on the current results, the proposed method has the potential to accurately quantify myocardial oxygen consumption. Further improvement can be made by involving T1 in HCT calibration5 instead of using invasively measurement to avoid bias from the equipment. The next step is to test the technique’s feasibility on subjects with cardiac diseases and human subjects.Acknowledgements
This work is supported by 1R01HL136578; 1R01HL165211; 1R01HL148788; 1R01HL156818.References
1. McCommis KS, Zhang H, Goldstein TA, Misselwitz B, Abendschein DR, Gropler RJ, Zheng J. Myocardial blood volume is associated with myocardial oxygen consumption: an experimental study with cardiac magnetic resonance in a canine model. JACC: Cardiovascular Imaging. 2009;2:1313-1320.
2. Kato S, Saito N, Nakachi T, Fukui K, Iwasawa T, Taguri M, Kosuge M, Kimura K. Stress perfusion coronary flow reserve versus cardiac magnetic resonance for known or suspected CAD. Journal of the American College of Cardiology. 2017;70:869-879.
3. Yang H-J, Christodoulou AG, Sykes J, Bi X, Cokic I, Prato FS, Li D, Dharmakumar R. Beat-by-beat dynamic assessment of myocardial oxygenation with highly time-resolved free breathing, ungated cardiac T2 BOLD MRI using a low-rank tensor formulation. International Society of Magnetic Resonance in Medicine 2018 annual meet. 2018.
4. Yang H-J, Dey D, Sykes J, Butler J, Biernaski H, Kovacs M, Bi X, Sharif B, Cokic I, Tang R. Heart Rate− Independent 3D Myocardial Blood Oxygen Level− Dependent MRI at 3.0 T with Simultaneous 13N− Ammonia PET Validation. Radiology. 2020;295:82-93.
5. McCommis KS, Zhang H, Goldstein TA, Misselwitz B, Abendschein DR, Gropler RJ, Zheng J. Myocardial blood volume is associated with myocardial oxygen consumption: an experimental study with cardiac magnetic resonance in a canine model. JACC: Cardiovascular Imaging. 2009;2:1313-1320.
Figures