0687
Free-breathing T1ρ dispersion imaging for myocardial fibrosis without exogenous contrast agents1School of Biomedical Engineering, ShanghaiTech University, Shanghai, China, 2Shanghai Clinical Research and Trial Center, Shanghai, China, 3Department of Cardiovascular Medicine, Ruijin Hospital Lu Wan Branch, Shanghai Jiao Tong University School of Medicine, Shanghai, China
Synopsis
Keywords: Myocardium, Cardiomyopathy
Motivation: LGE and ECV are standard cardiac MR (CMR) techniques for detecting focal and diffuse myocardial fibrosis, requiring gadolinium contrast agents. For patients with gadolinium contraindications, non-contrast CMR techniques are needed to detect myocardial fibrosis.
Goal(s): To evaluate the performance of endogenous T1ρ dispersion imaging for myocardial fibrosis.
Approach: A recently proposed free-breathing T1ρ dispersion imaging technique was employed to image patients with non-ischemic cardiomyopathies. The endogenous parameters, T1ρ, myocardial fibrosis index (mFI), and native T1 were evaluated against LGE and ECV.
Results: T1ρ and mFI were elevated in the LGE region and mFI showed the best correlation with ECV among the tested parameters.
Impact: T1ρ dispersion imaging is a promising CMR technique for detecting myocardial fibrosis without exogenous contrast agents.
Introduction
Myocardial fibrosis including focal replacement fibrosis and diffuse fibrosis, is associated with adverse left ventricle remodeling and adverse cardiovascular events1,2. Contrast-enhanced MR techniques have been established for non-invasive myocardial fibrosis imaging. Late gadolinium enhanced (LGE) and extracellular volume fraction (ECV) imaging can be used to detect focal and diffuse fibrosis3, respectively. However, LGE and ECV are not applicable to patients who have contraindications for gadolinium-based contrast agents4. Endogenous T1ρ dispersion imaging involving T1ρ quantification at two or more different spin-lock frequencies has been shown to be able to detect diffuse myocardial fibrosis in diabetic and hypertrophic cardiomyopathies5,6, where a parameter, myocardial fibrosis index (mFI) was defined as the difference between the T1ρ estimated with the spin-lock frequency of several hundred and zero hertz7. However, current cardiac T1ρ dispersion imaging is performed with two breath-hold acquisitions, which may lead to mis-registered parameter maps and affect the calculation of mFI. Recently, we proposed a joint cardiac mapping technique, which can produce co-registered T2 and T1ρ maps to facilitate the calculation of mFI8. Leveraging the joint mapping technique, we imaged 42 cardiomyopathic patients and compared the endogenous parameters with contrast-enhanced techniques.Methods
MR imagingAfter institutional review board approval and obtaining written informed consent, 42 patients who were recommended for cardiac MR (CMR) were prospectively enrolled. After exclusions shown in Fig. 1, 26 patients (18 males; 50 ± 14 years) were included for analysis. The CMR acquisitions were conducted on a 3T scanner. The native T1 mapping was performed with MOLLI 5(3)39 at the basal, middle and apical short-axis slices. The free-breathing joint myocardial T2 and T1ρ mapping (FB-JointMap)8 was performed for T1ρ dispersion imaging, which acquires three T2-preapraed (preparation duration = 0, 30, and 55 ms) and four T1ρ-prepared (spin-lock duration = 2, 16, 30, and 50 ms; spin-lock frequency = 350Hz) single-shot images at mid-diastole in an interleaved fashion. The imaging locations of FB-JointMap were the same to MOLLI. LGE was performed 10-15 minutes after contrast injection and post-contrast MOLLI T1 mapping was performed after LGE imaging. A blood sample was taken from all patients immediately before each CMR study for hematocrit measurement. Tab. 1 summarizes the imaging parameters.
Image analysis
After motion correction, images of FB-JointMaps were fitted to the T2 and T1ρ decay model to quantify T2 and T1ρ simultaneously, from which mFI was calculated as their difference10,11. Based on the pre- and post-contrast T1 maps, ECV maps were generated using a custom MATLAB software. For segment-wise analysis, the American Heart Association’s (AHA) 16-segment model was adopted12. The mean native T1, T1ρ and mFI calculated in the mid short-axis slice were compared with ECV using Pearson correlation.
Results
LGE was detected in 6 patients. Fig. 2 shows T1ρ, mFI, slice-matched LGE and ECV images of two patients with focal enhancement. In the enhancement region, T1ρ and mFI were increased, while T2 values were not visually differed between the LGE area and the remote myocardium. Parameter maps, LGE, and ECV images from another two patients are shown in Fig. 3, where no hyper-enhanced region can be observed in the LGE images, while the mean ECV of two patients was respectively increased to 0.44 and 0.35, indicating the presence of diffuse myocardial fibrosis. The mean T1ρ and mFI for the patients were 58.21ms, 14.28ms (Patient c) and 56.96ms, 12.57ms (Patient d), separately, both being higher than those of healthy subject (53.73ms, 9.58ms)8. Fig. 4 illustrates the correlation of mFI, T1ρ and native T1 with ECV. The correlation was strongest for mFI (Pearson r=0.82, p<0.001), followed by T1ρ (Pearson r=0.75, p<0.001). Native T1 showed moderate correlation with ECV (Pearson r=0.51, p<0.01).Discussion
The free-breathing T1ρ dispersion imaging technique was evaluated in a cohort of patients with non-ischemic cardiomyopathies. Endogenous mFI and T1ρ were increased in the LGE region, and showed better correlation with ECV than native T1. The free-breathing T1ρ dispersion imaging technique holds great potential for diagnosing myocardial fibrosis without contrast agents. More patients will be recruited to validate the clinical value of the proposed technique. In addition, it is noted that edema or inflammation may lead to increased T2 which will affect mFI estimations. Appropriate analysis model will be explored to address this issue.Acknowledgements
No acknowledgement found.References
1. Feingold B, Salgado CM, Reyes-Múgica M, et al. Diffuse myocardial fibrosis among healthy pediatric heart transplant recipients: Correlation of histology, cardiovascular magnetic resonance, and clinical phenotype. Pediatr Transplant. 2017;21(5).
2. Frangogiannis NG. Cardiac fibrosis: Cell biological mechanisms, molecular pathways and therapeutic opportunities. Molecular Aspects of Medicine. 2019;65:70-99.
3. Miller CA, Naish JH, Bishop P, et al. Comprehensive validation of cardiovascular magnetic resonance techniques for the assessment of myocardial extracellular volume. Circ Cardiovasc Imaging. 2013;6(3):373-383.
4. Ledneva E, Karie S, Launay-Vacher V, Janus N, Deray G. Renal safety of gadolinium-based contrast media in patients with chronic renal insufficiency. Radiology. 2009;250(3):618-628.
5. Thompson EW, Kamesh Iyer S, Solomon MP, et al. Endogenous T1ρ cardiovascular magnetic resonance in hypertrophic cardiomyopathy. J Cardiovasc Magn Reson. 2021;23:120.
6. Zhang Y, Zeng W, Chen W, et al. MR extracellular volume mapping and non-contrast T1ρ mapping allow early detection of myocardial fibrosis in diabetic monkeys. Eur Radiol. 2019;29(6):3006-3016.
7. Wang K, Zhang W, Li S, et al. Noncontrast T1ρ dispersion imaging is sensitive to diffuse fibrosis: A cardiovascular magnetic resonance study at 3T in hypertrophic cardiomyopathy. Magnetic Resonance Imaging. 2022;91:1-8.
8. Miao Q, Lv Z, Hua S, et al. Free-breathing simultaneous myocardial T2 and T1? mapping for non-contrast assessment of uremic cardiomyopathy. In: ; 2023:3956.
9. Messroghli DR, Radjenovic A, Kozerke S, Higgins DM, Sivananthan MU, Ridgway JP. Modified Look-Locker inversion recovery (MOLLI) for high-resolution T1 mapping of the heart. Magnetic Resonance in Medicine. 2004;52(1):141-146.
10. Qi H, Lv Z, Hu J, et al. Accelerated 3D free-breathing high-resolution myocardial T1ρ mapping at 3 Tesla. Magnetic Resonance in Medicine. 2022;88(6):2520-2531.
11. Huang TY, Liu YJ, Stemmer A, Poncelet BP. T2 measurement of the human myocardium using a T2-prepared transient-state trueFISP sequence. Magnetic Resonance in Medicine. 2007;57(5):960-966.
12. Baeßler B, Schaarschmidt F, Stehning C, Schnackenburg B, Maintz D, Bunck AC. A systematic evaluation of three different cardiac T2-mapping sequences at 1.5 and 3T in healthy volunteers. European Journal of Radiology. 2015;84(11):2161-2170.
Figures
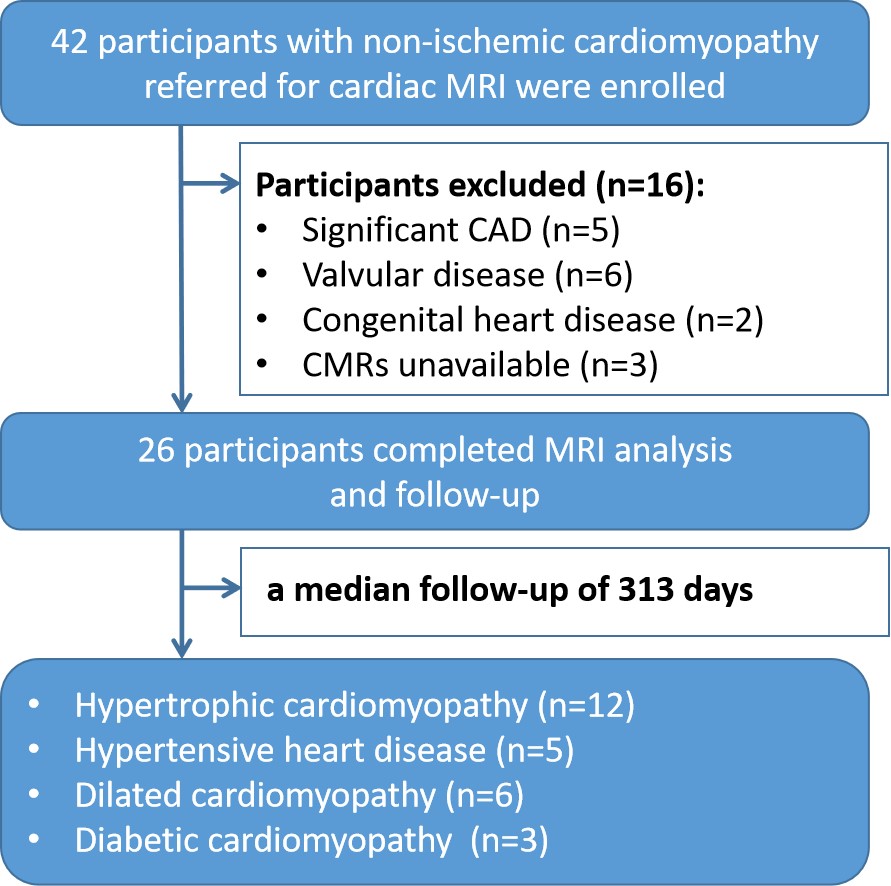
Fig. 1 Flowchart of the study population. Exclusion criteria included ischemic heart disease, defined as previous myocardial infarction or substantial coronary artery disease (CAD, >50% stenosis in a major coronary artery), infiltrative disease, or valvular cardiomyopathy.
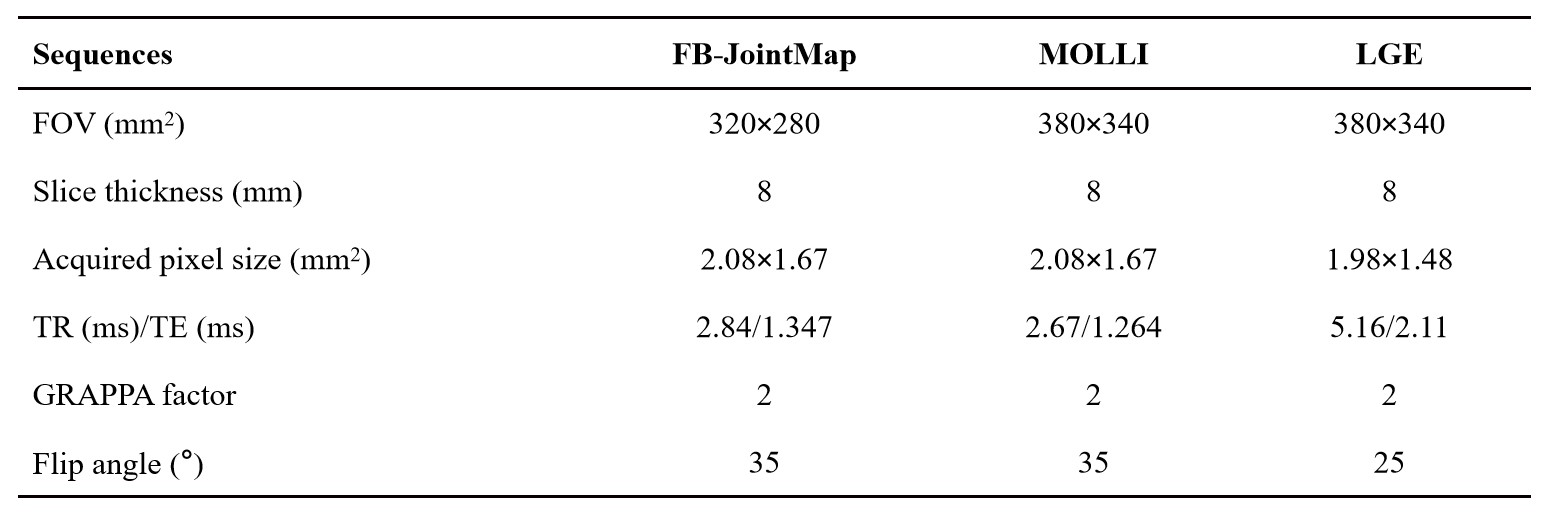
Fig. 2 Parameters of cardiac magnetic resonance images.
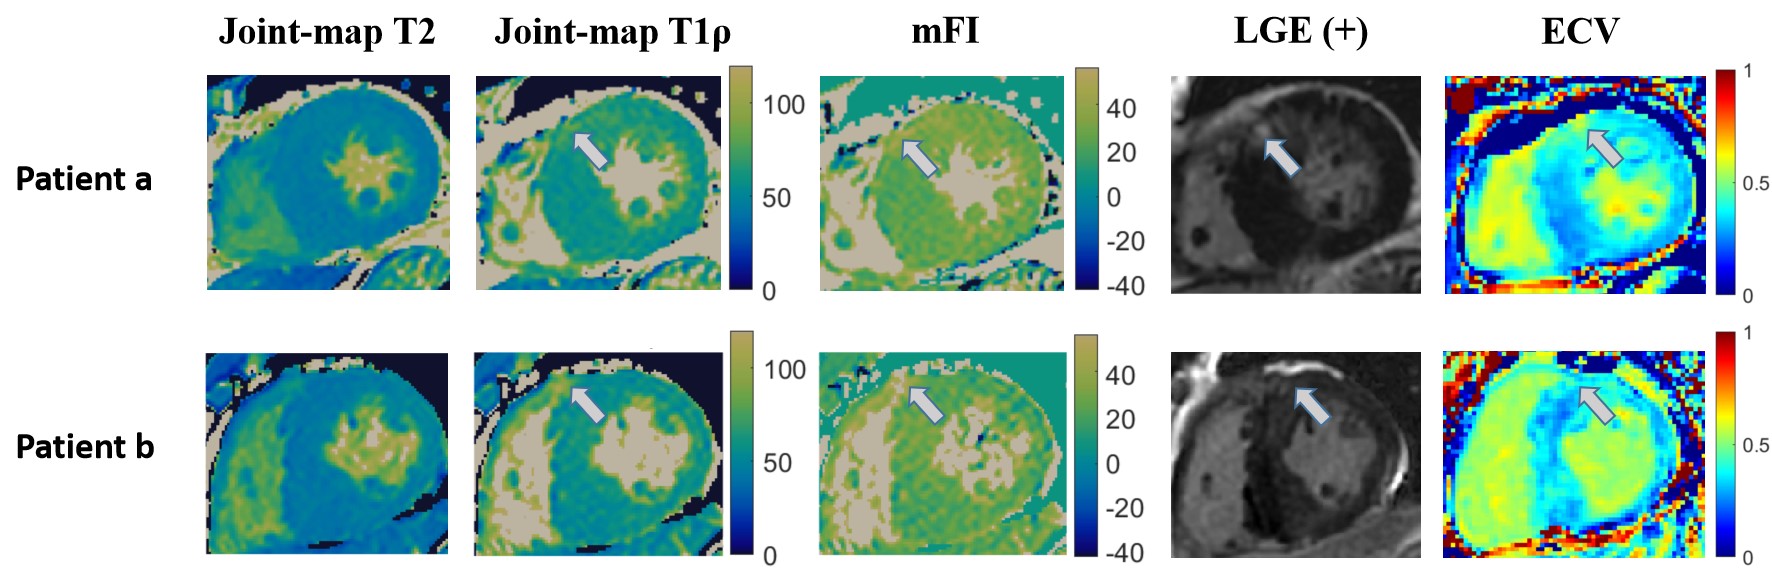
Fig. 3 Parameter maps obtained with FB-JointMap along with the LGE and ECV images of two patients. Patient a: 41-year-old male patient with myocardial hypertrophy and intramural LGE. Patient b: a 66-year-old male patient diagnosed with hypertrophic cardiomyopathy showed mild enhancement in the anterior myocardial region. The white arrow indicates the enhanced region.
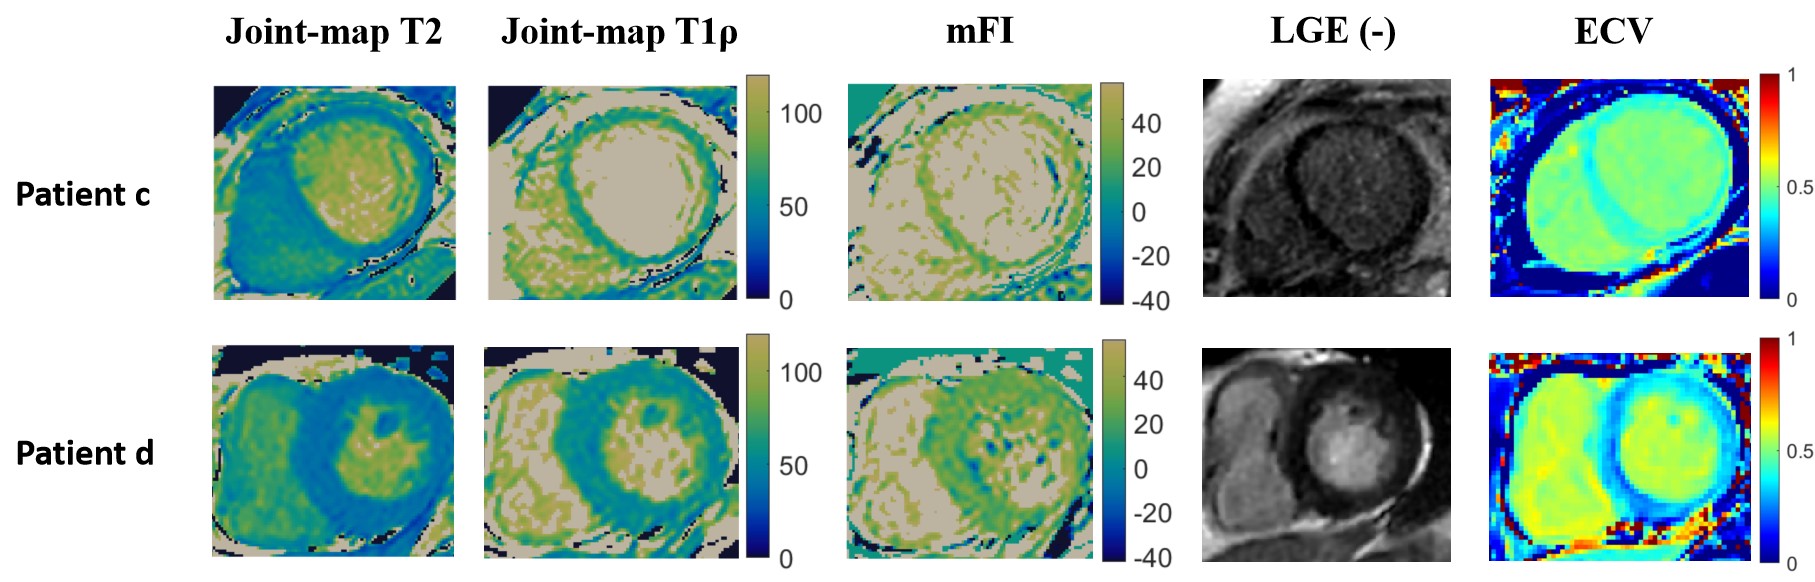
Fig. 4 Myocardial T2, T1ρ, ECV maps, and LGE images for two patients with dilated cardiomyopathy (Patient c) and hypertensive heart disease (Patient d). LGE images showed no hyper-enhanced areas (LGE-). However, increased values of T1ρ, mFI, and ECV were observed for the two patients.
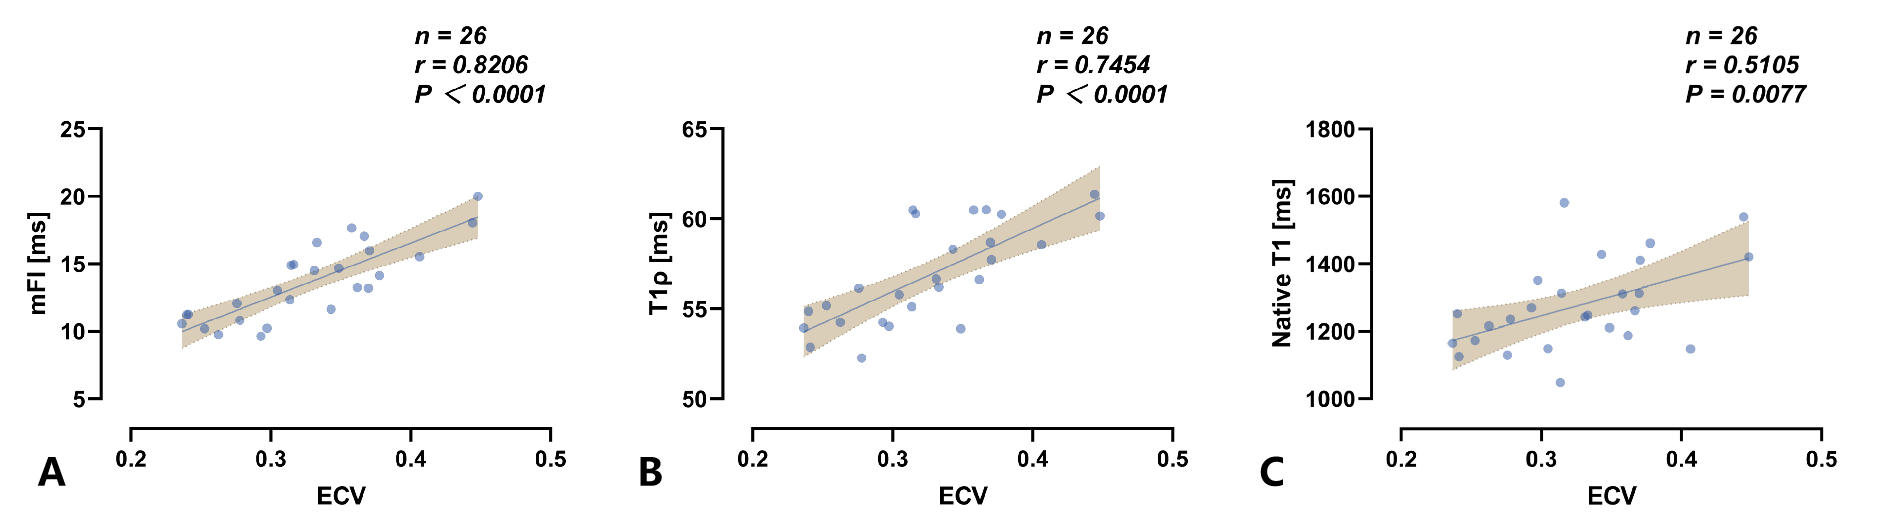
Fig. 5 Correlations of mFI (A), T1ρ (B) and native T1 (C) with ECV for the 26 patients. The Pearson correlation r and p-value are shown for each correlation analysis.