0684
Pattern Search Pulse Sequence Optimization for Cardiac MR Fingerprinting1Department of Electrical Engineering and Computer Science, Univerisity of Michigan, Ann Arbor, MI, United States, 2Department of Radiology, Univeristy of Michigan, Ann Arbor, MI, United States, 3Department of Biomedical Engineering, University of Michigan, Ann Arbor, MI, United States
Synopsis
Keywords: Myocardium, MR Fingerprinting, T1 mapping, T2 mapping, cardiovascular
Motivation: Current cardiac MRF sequences have been designed empirically, and thus do not exploit the full flexibility in sequence design of the MRF framework.
Goal(s): The goal of this project is to develop a sequence optimization method for cardiac MRF, which can be applied to shorten the breathhold and diastolic window.
Approach: An optimization method was implemented that simulates MRI signal generation, spiral undersampling, and pattern recognition during each iteration, using a pattern search algorithm to update multiple parameters.
Results: In simulations, phantoms, and healthy subjects, the shortened optimized scan yielded similar myocardial T1 and T2 values as a previously described cardiac MRF technique.
Impact: This study proposes a sequence optimization method for cardiac MRF with many potential applications, including designing shortened scans to reduce breathhold requirements and limit motion artifacts.
Introduction:
While cardiac Magnetic Resonance Fingerprinting (MRF) enables simultaneous T1, T2, and proton density (M0) mapping1, previous sequences were designed heuristically and may not exploit the full flexibility afforded by the MRF framework2. Several earlier studies employed a 15-heartbeat breathhold and 250ms diastolic window, which may lead to residual motion blurring. Additionally, this sequence employed small flip angles, which was observed to improve accuracy but may compromise SNR3. While sequence optimization methods have been developed for brain MRF applications4-5, similar approaches have not been explored for cardiac MRF, where breathholding and ECG triggering impose additional constraints on sequence designs, and the data are highly undersampled. This study introduces a sequence optimization framework for cardiac MRF T1, T2, and M0 mapping, which models MRI signal generation, spiral k-space undersampling, and pattern recognition in the optimization process.Methods:
Sequence Optimization: A previously described cardiac FISP-MRF sequence (15 heartbeats, 250ms diastolic window) was used as a reference, referred to as Seq-A (Figure 1)6, having 4-25 flip angles and multiple inversions and T2 preparations. Sequence optimization was performed to design an MRF scan with a shortened 5-heartbeat breathhold and 150ms diastolic window. The flip angle series and preparation pulse timings were optimized, but the placement of the inversions and T2-preparations was not changed. The total number of variables was 139, corresponding to 135 flip angles (27 TRs per heartbeat), one inversion time, and three T2-prep times. The optimization algorithm (Figure 2) used ground truth maps from the XCAT phantom7. During each iteration, a Bloch equation simulation was performed to generate a dictionary. Simulated MRF time-series images were undersampled using a golden angle spiral trajectory, gridded8, and matched to the dictionary. The sum of RMSE values in the resulting T1 and T2 maps was used as a cost function to update the sequence using the pattern search global optimization method in MATLAB9. The algorithm was initialized using a truncated version of the existing MRF sequence, referred to as Seq-B, and used to design a shortened sequence (Seq-C) constrained with flip angles 0-25, inversion times 21-400 ms, and T2-preparation times 25-150ms. Another sequence (Seq-D) was optimized with flip angles 0-75 to investigate if higher flip angles could improve precision. A constant heart rate of 60bpm was assumed in the optimization.Experiments: The four sequences in Figure 1 were evaluated in XCAT simulations by computing RMSE values relative to ground truth T1 and T2 maps. Next, the T2 layer of the ISMRM/NIST MRI system phantom was scanned at 1.5T (MAGNETOM Sola, Siemens Healthineers, Erlangen, Germany). MRF T1 and T2 values were compared to reference values using Bland-Altman plots to assess accuracy. Precision was quantified using the coefficient of variation (CoV). In vivo MRF data were acquired in 5 healthy subjects at a mid-ventricular slice (1.6x1.6x8.0mm3 resolution, 300x300mm2 FOV) and reconstructed using a low-rank technique with locally low-rank regularization10, along with MOLLI11 T1 and T2-prepared bSSFP12 maps. T1 and T2 values in the myocardial septum were compared between methods, treating Seq-A as the reference.
Results:
The average optimization time was 6 hours per sequence. In simulations (Table 1), Seq-A had the lowest RMSE values, as expected due to the longer sequence length. Among the abbreviated scans, Seq-C and Seq-D both had lower errors than Seq-B (which as not optimized). In the phantom experiments, all MRF scans agreed with reference values (Figures 3a-3d). Among the abbreviated scans, Seq-D exhibited the highest precision with average CoV (T1 4.4%, T2 7.0%) within physiological values, compared to (T1 3.3%, T2 5.0%) for Seq-A. Representative maps from one subject, and myocardial T1 and T2 values over all subjects, are shown in Figure 4. Visually, among abbreviated scans, Seq-D yielded maps with reduced noise. The relative error in myocardial T1/T2 values compared to Seq-A, averaged over all subjects, was 3.6/7.0% for Seq-D and 0.3/15.1% for Seq-C, which both outperformed Seq-B (4.4/22.2%).Discussion and Conclusion:
This study presents an optimization framework for cardiac MRF that models the effects of MRI signal generation, k-space undersampling, and pattern recognition in the optimization process. A scan with a shortened breathhold and diastolic window was designed, which may reduce motion artifacts for patient scans, which will be investigated in future work. The proposed method does not explicitly enforce smooth variations in flip angles, which differs from some previous optimization techniques4,5. Undersampled images were directly matched to the dictionary to accelerate the optimization; however, the in vivo scans employed a low-rank reconstruction to reduce noise, which could potentially be incorporated in the optimization.Acknowledgements
Siemens Healthineers
NIH/NHLBI R01HL163030, R01HL153034, and R01HL163991
References
1. Hamilton, Jesse I., et al. "MR fingerprinting for rapid quantification of myocardial T1, T2, and proton spin density." Magnetic resonance in medicine 77.4 (2017): 1446-1458.
2. Ma, D., Gulani, V., Seiberlich, N., Liu, K., Sunshine, J.L., Duerk, J.L. and Griswold, M.A., 2013. Magnetic resonance fingerprinting. Nature, 495(7440), pp.187-192.
3. Hamilton, Jesse I., et al. "Investigating and reducing the effects of confounding factors for robust T1 and T2 mapping with cardiac MR fingerprinting." Magnetic resonance imaging53 (2018): 40-51.
4. Zhao, Bo, et al. "Optimal experiment design for magnetic resonance fingerprinting: Cramér-Rao bound meets spin dynamics." IEEE transactions on medical imaging 38.3 (2018): 844-861.
5. Heesterbeek, David GJ, et al. "Mitigating undersampling errors in MR fingerprinting by sequence optimization." Magnetic Resonance in Medicine 89.5 (2023): 2076-2087.
6. Hamilton, Jesse I., et al. "Simultaneous mapping of T1 and T2 using cardiac magnetic resonance fingerprinting in a cohort of healthy subjects at 1. 5T." Journal of Magnetic Resonance Imaging 52.4 (2020): 1044-1052.
7. Segars, W.P., Sturgeon, G., Mendonca, S., Grimes, J. and Tsui, B.M., 2010. 4D XCAT phantom for multimodality imaging research. Medical physics, 37(9), pp.4902-4915.
8. Fessler, Jeffrey A., and Bradley P. Sutton. "Nonuniform fast Fourier transforms using min-max interpolation." IEEE transactions on signal processing 51.2 (2003): 560-574.
9. Torczon, Virginia. "On the convergence of pattern search algorithms." SIAM Journal on optimization 7.1 (1997): 1-25.
10. Lima da Cruz, G., Bustin, A., Jaubert, O., Schneider, T., Botnar, R.M. and Prieto, C., 2019. Sparsity and locally low rank regularization for MR fingerprinting. Magnetic resonance in medicine, 81(6), pp.3530-3543.
11. Messroghli, D.R., Radjenovic, A., Kozerke, S., Higgins, D.M., Sivananthan, M.U. and Ridgway, J.P., 2004. Modified Look‐Locker inversion recovery (MOLLI) for high‐resolution T1 mapping of the heart. Magnetic Resonance in Medicine: An Official Journal of the International Society for Magnetic Resonance in Medicine, 52(1), pp.141-146.
12. Giri, S., Chung, Y.C., Merchant, A., Mihai, G., Rajagopalan, S., Raman, S.V. and Simonetti, O.P., 2009. T2 quantification for improved detection of myocardial edema. Journal of cardiovascular magnetic resonance, 11(1), pp.1-13.
Figures
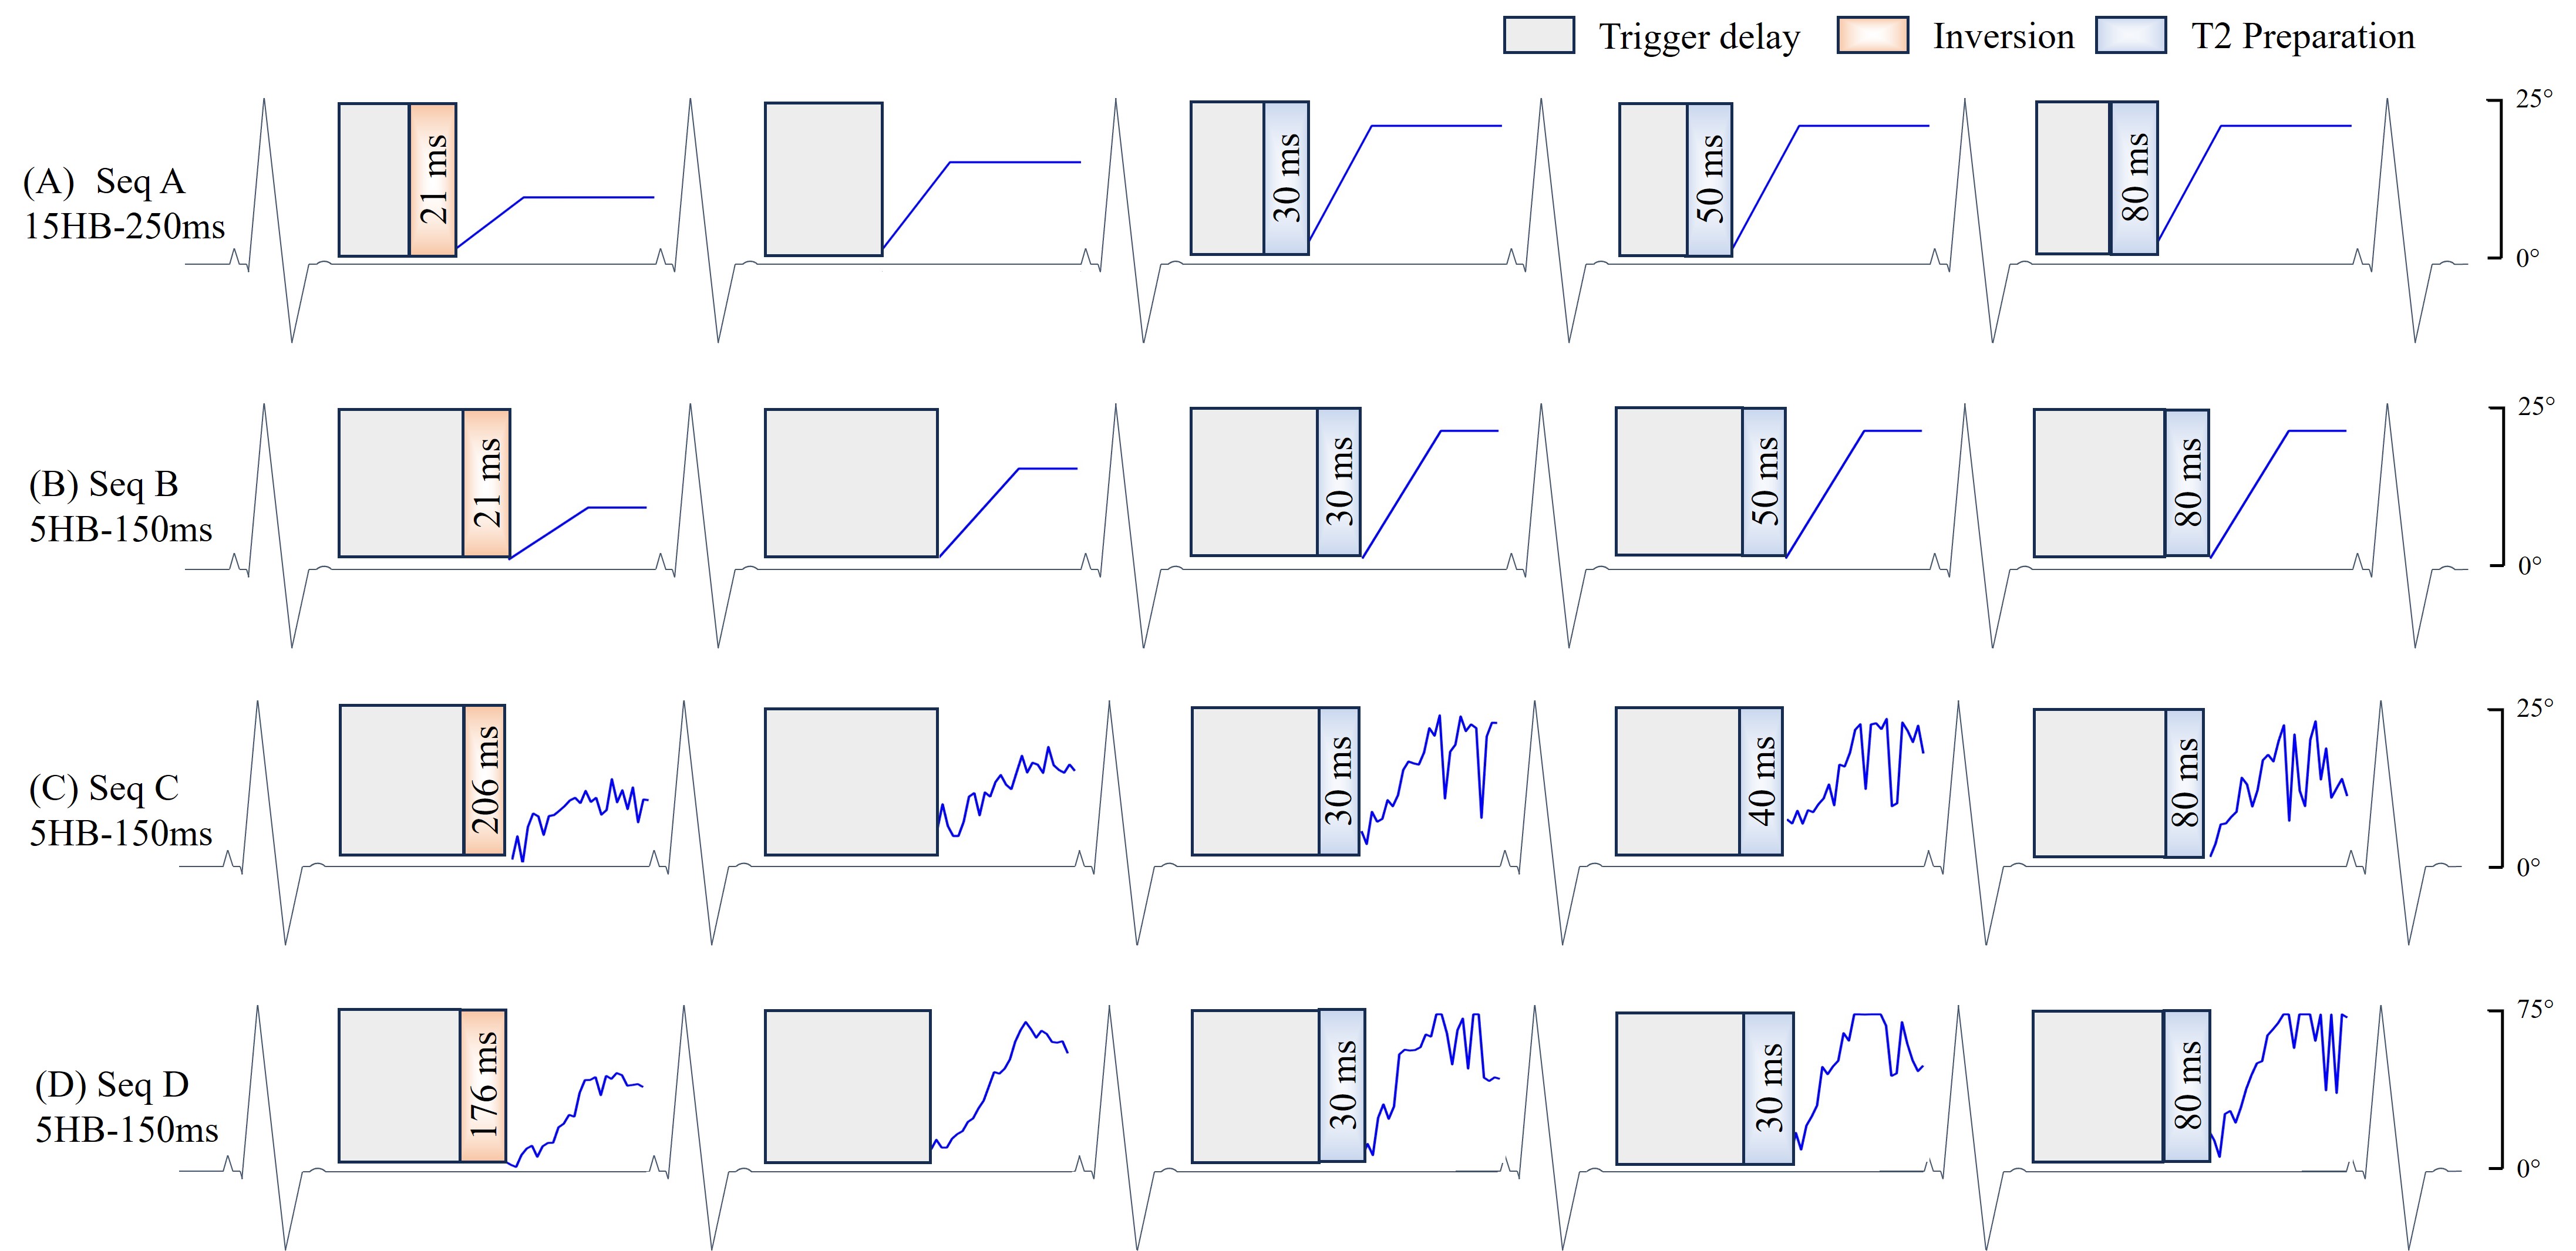
Figure 1: Seq A is divided into 5-heartbeat blocks, repeated three times during a 15-heartbeat breathhold. During each heartbeat, data are acquired within a 250ms diastolic window using a constant TR of 5.5ms and flip angles that vary between 4-25, with 45 TRs collected per heartbeat. Seq B is obtained from truncated Seq A to a 5-heartbeat breathhold and 150ms acquisition window (27TRs collected per heartbeat and 135 total TRs in the scan). Seq C and D show the two optimized cardiac MRF sequences with smaller and larger flip angle ranges, along with the optimized preparation times.
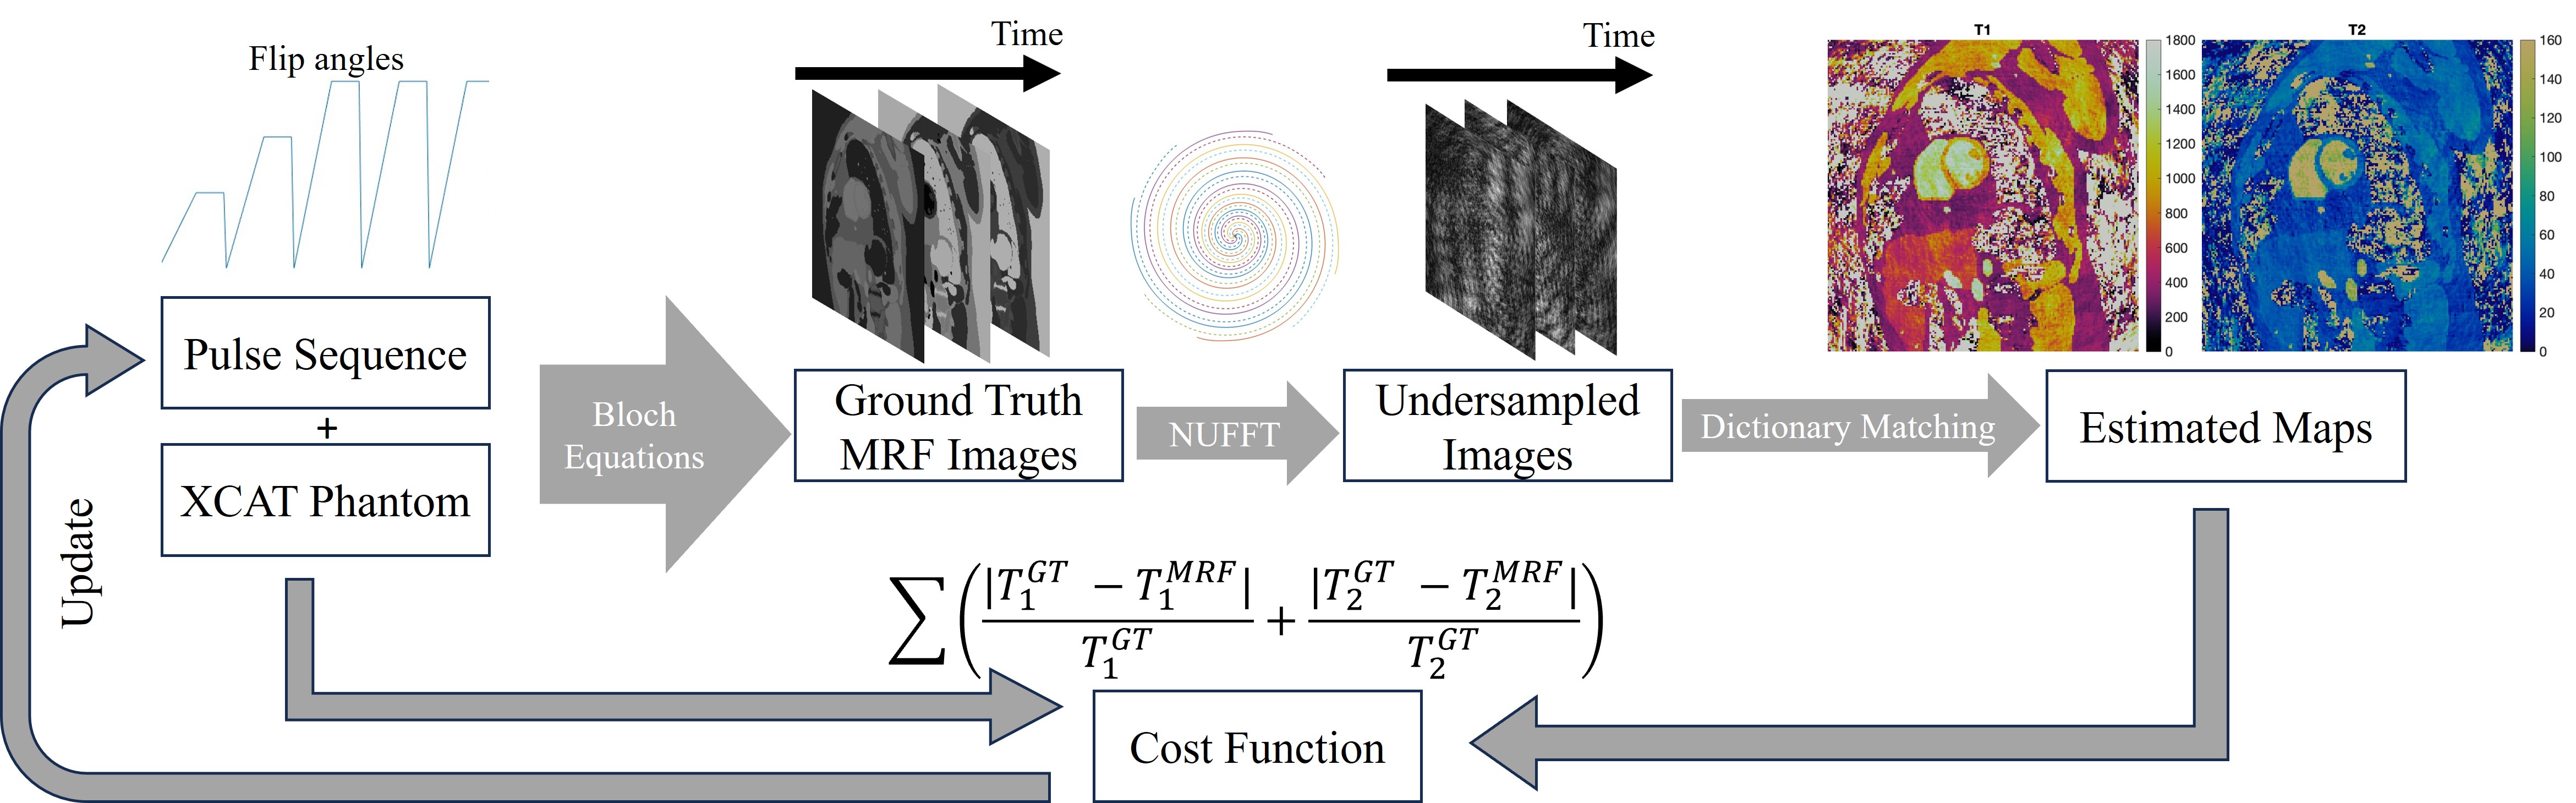
Figure 2: Illustrated the optimization framework. First use Bloch equation to simulate XCAT phantom through current best pulse sequence. Next, undersampled the data in k-space and gridded using NUFFT. After that, pattern matching the dictionary to estimate the T1 and T2 maps. The sum of the normalized root mean square error (RMSE) of the T1 and T2 maps is used as the cost function to update the MRF sequence parameters using the pattern search optimization solver in MATLAB.
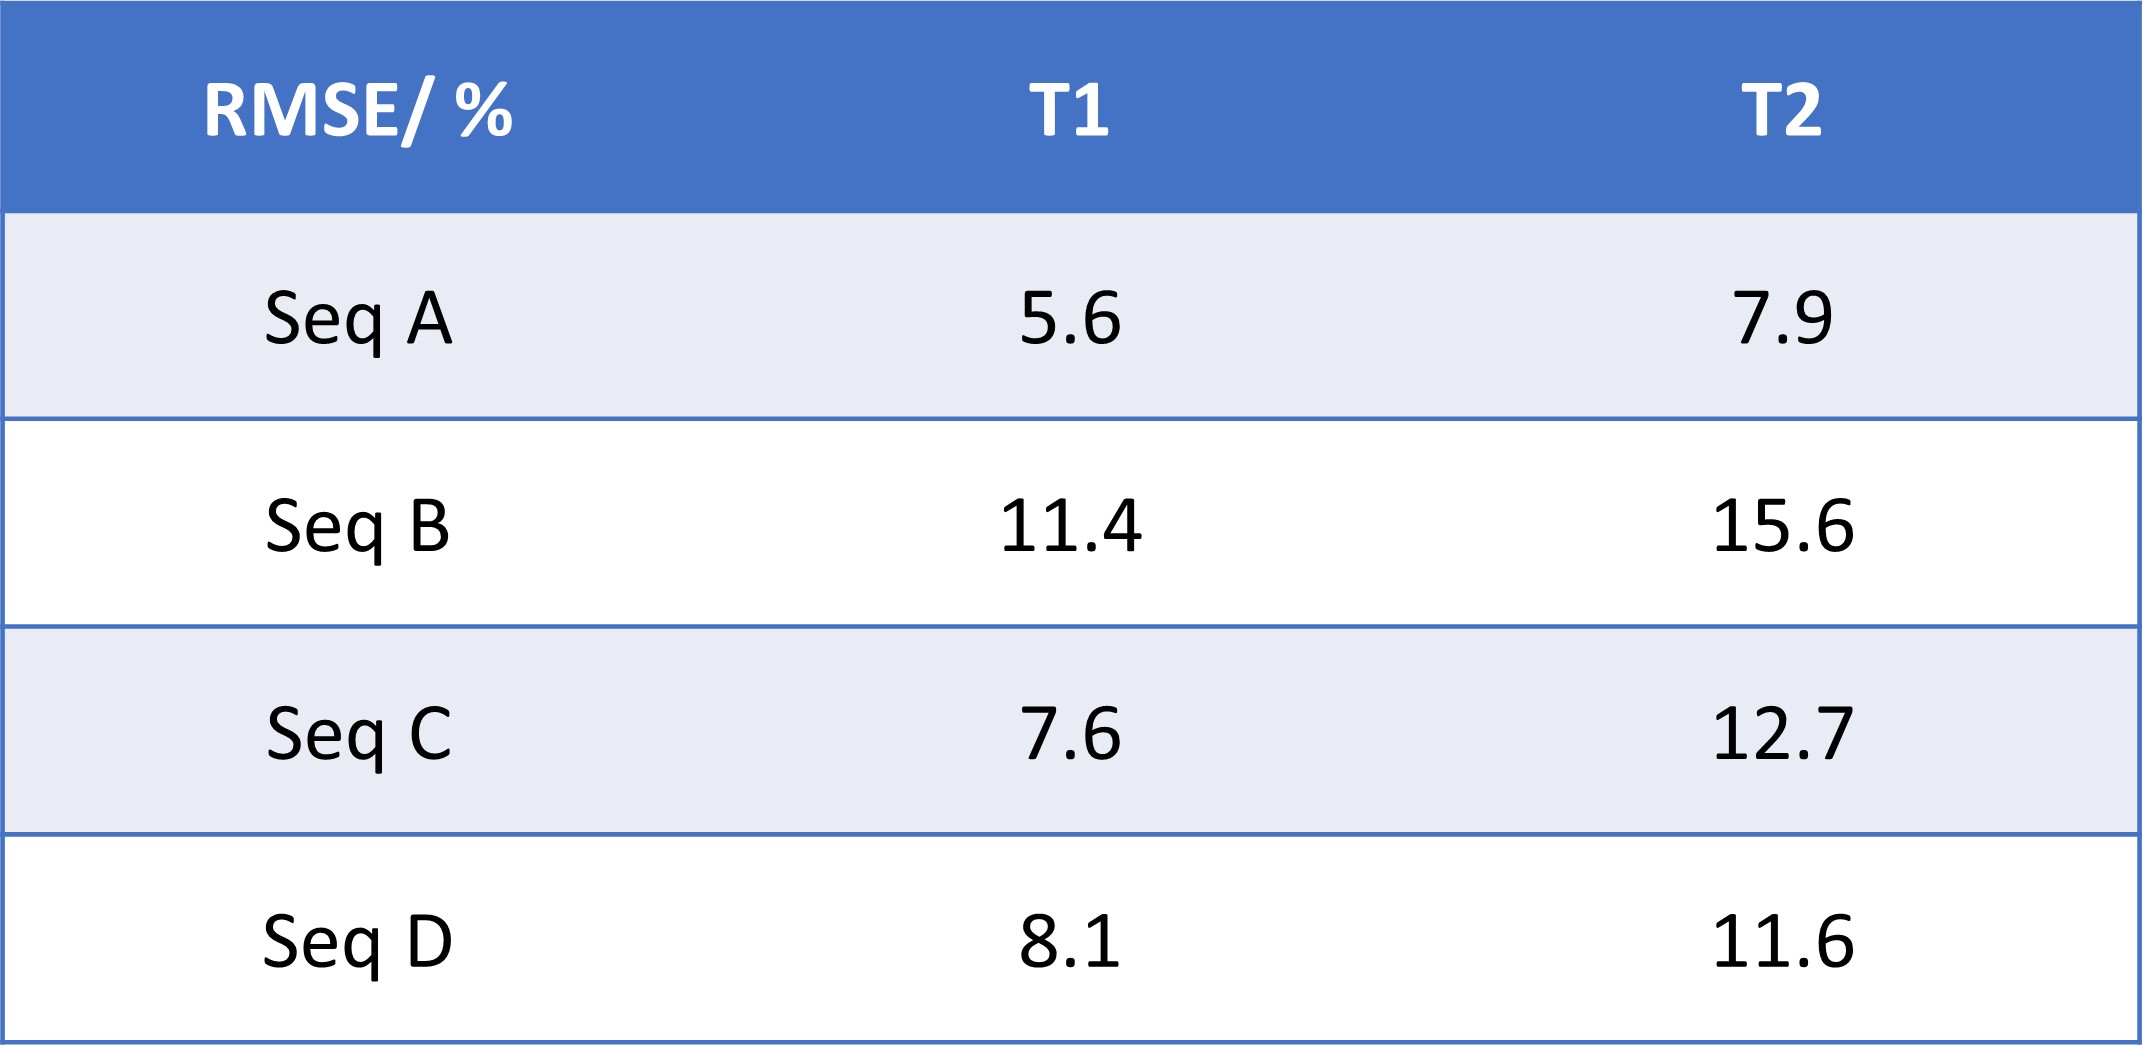
Table 1: The conventional MRF scan (Seq A) had the lowest errors in simulations (RMSE T1 5.6%, T2 7.9%), as expected due to the longer breathhold and diastolic window (and thus availability of more MRF data). Among the scans with a shortened 5-heartbeat breathhold and 150 ms diastolic window, both optimized sequences yielded lower errors (Seq C: T1 7.6%, T2 12.7%; Seq D: T1 8.1%, T2 11.6%) than the unoptimized sequence (Seq B: T1 11.4%, T2 15.6%).
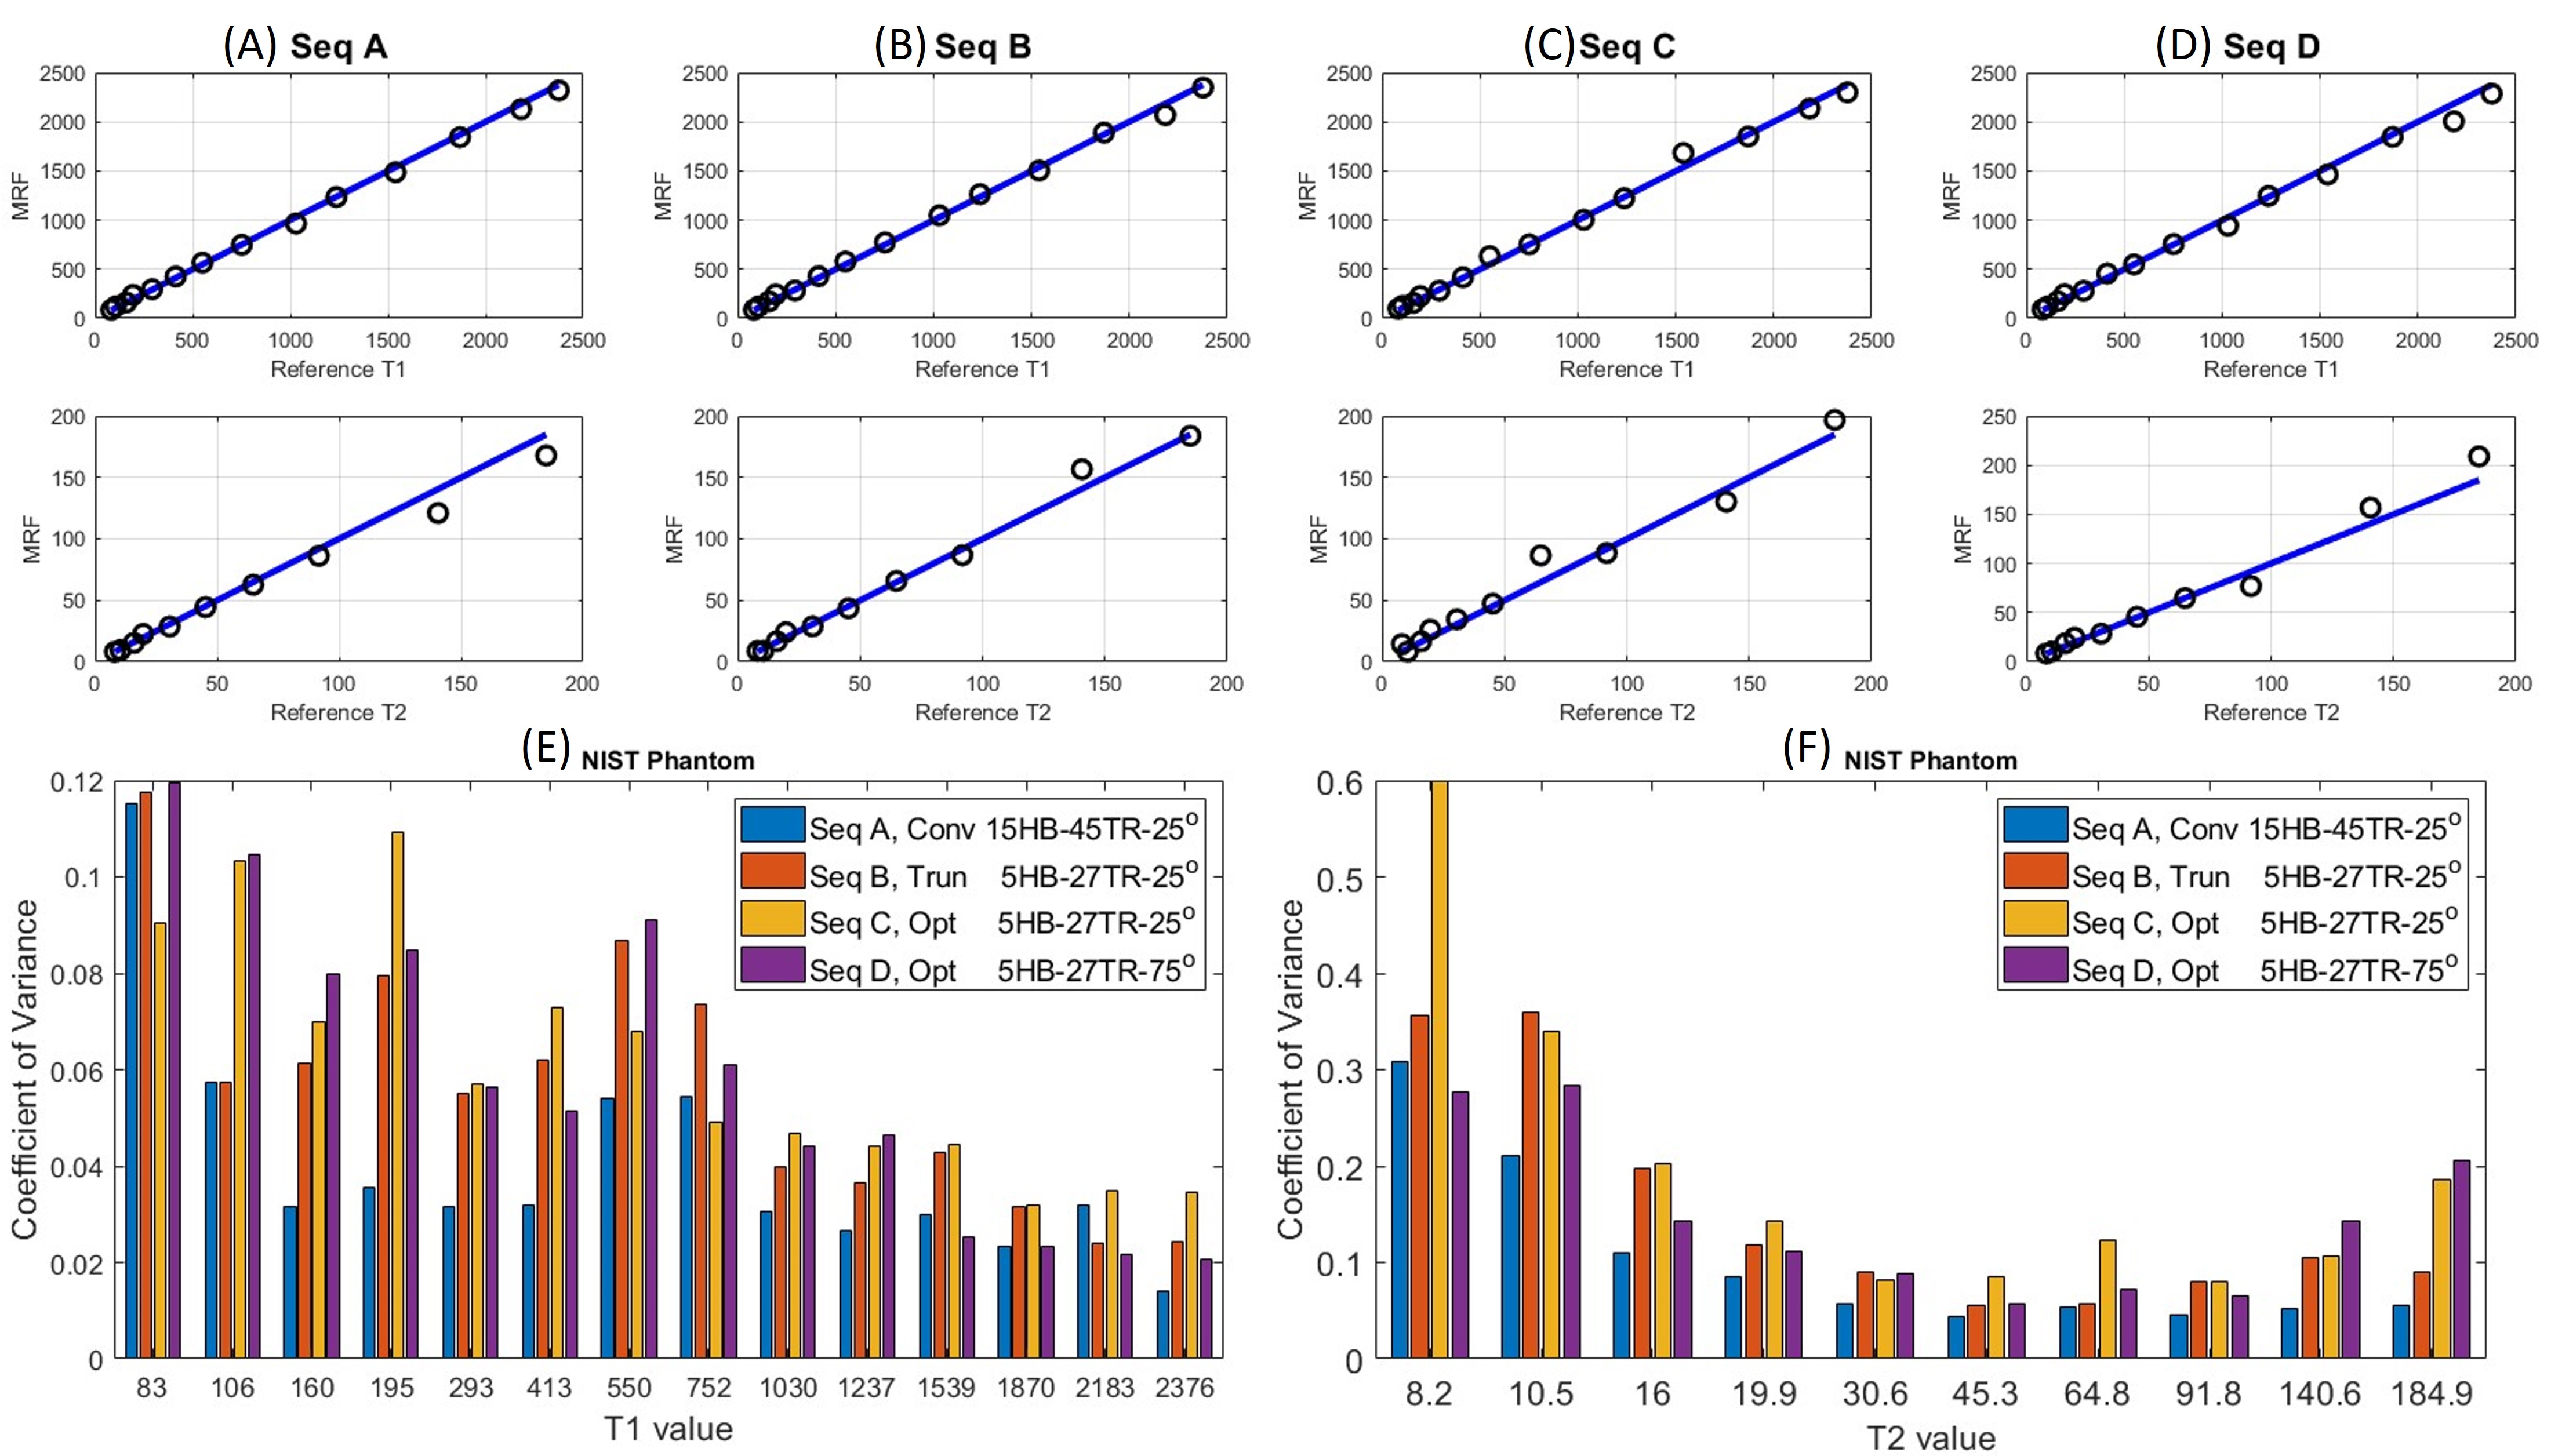
Figure 3: (A)-(D) displays the regression plots for T1 and T2 measurements from scanning the NIST phantom using Seq A-D. These plots exhibit a close alignment with the reference values. (E)-(F) displays the CoV values from the phantom experiment. For T1, the average CoV over all spheres (excluding spheres with T1 < 200 ms) was lowest for Seq A (3.28%), followed by Seq D (4.41%), Seq B (4.76%), and Seq C (4.83%). Similarly, the average CoV for spheres within a physiological T2 range (between 20-100 ms) was lowest for Seq A (4.98%), followed by Seq D (7.04%), Seq B (7.09%), and Seq C (9.26%).
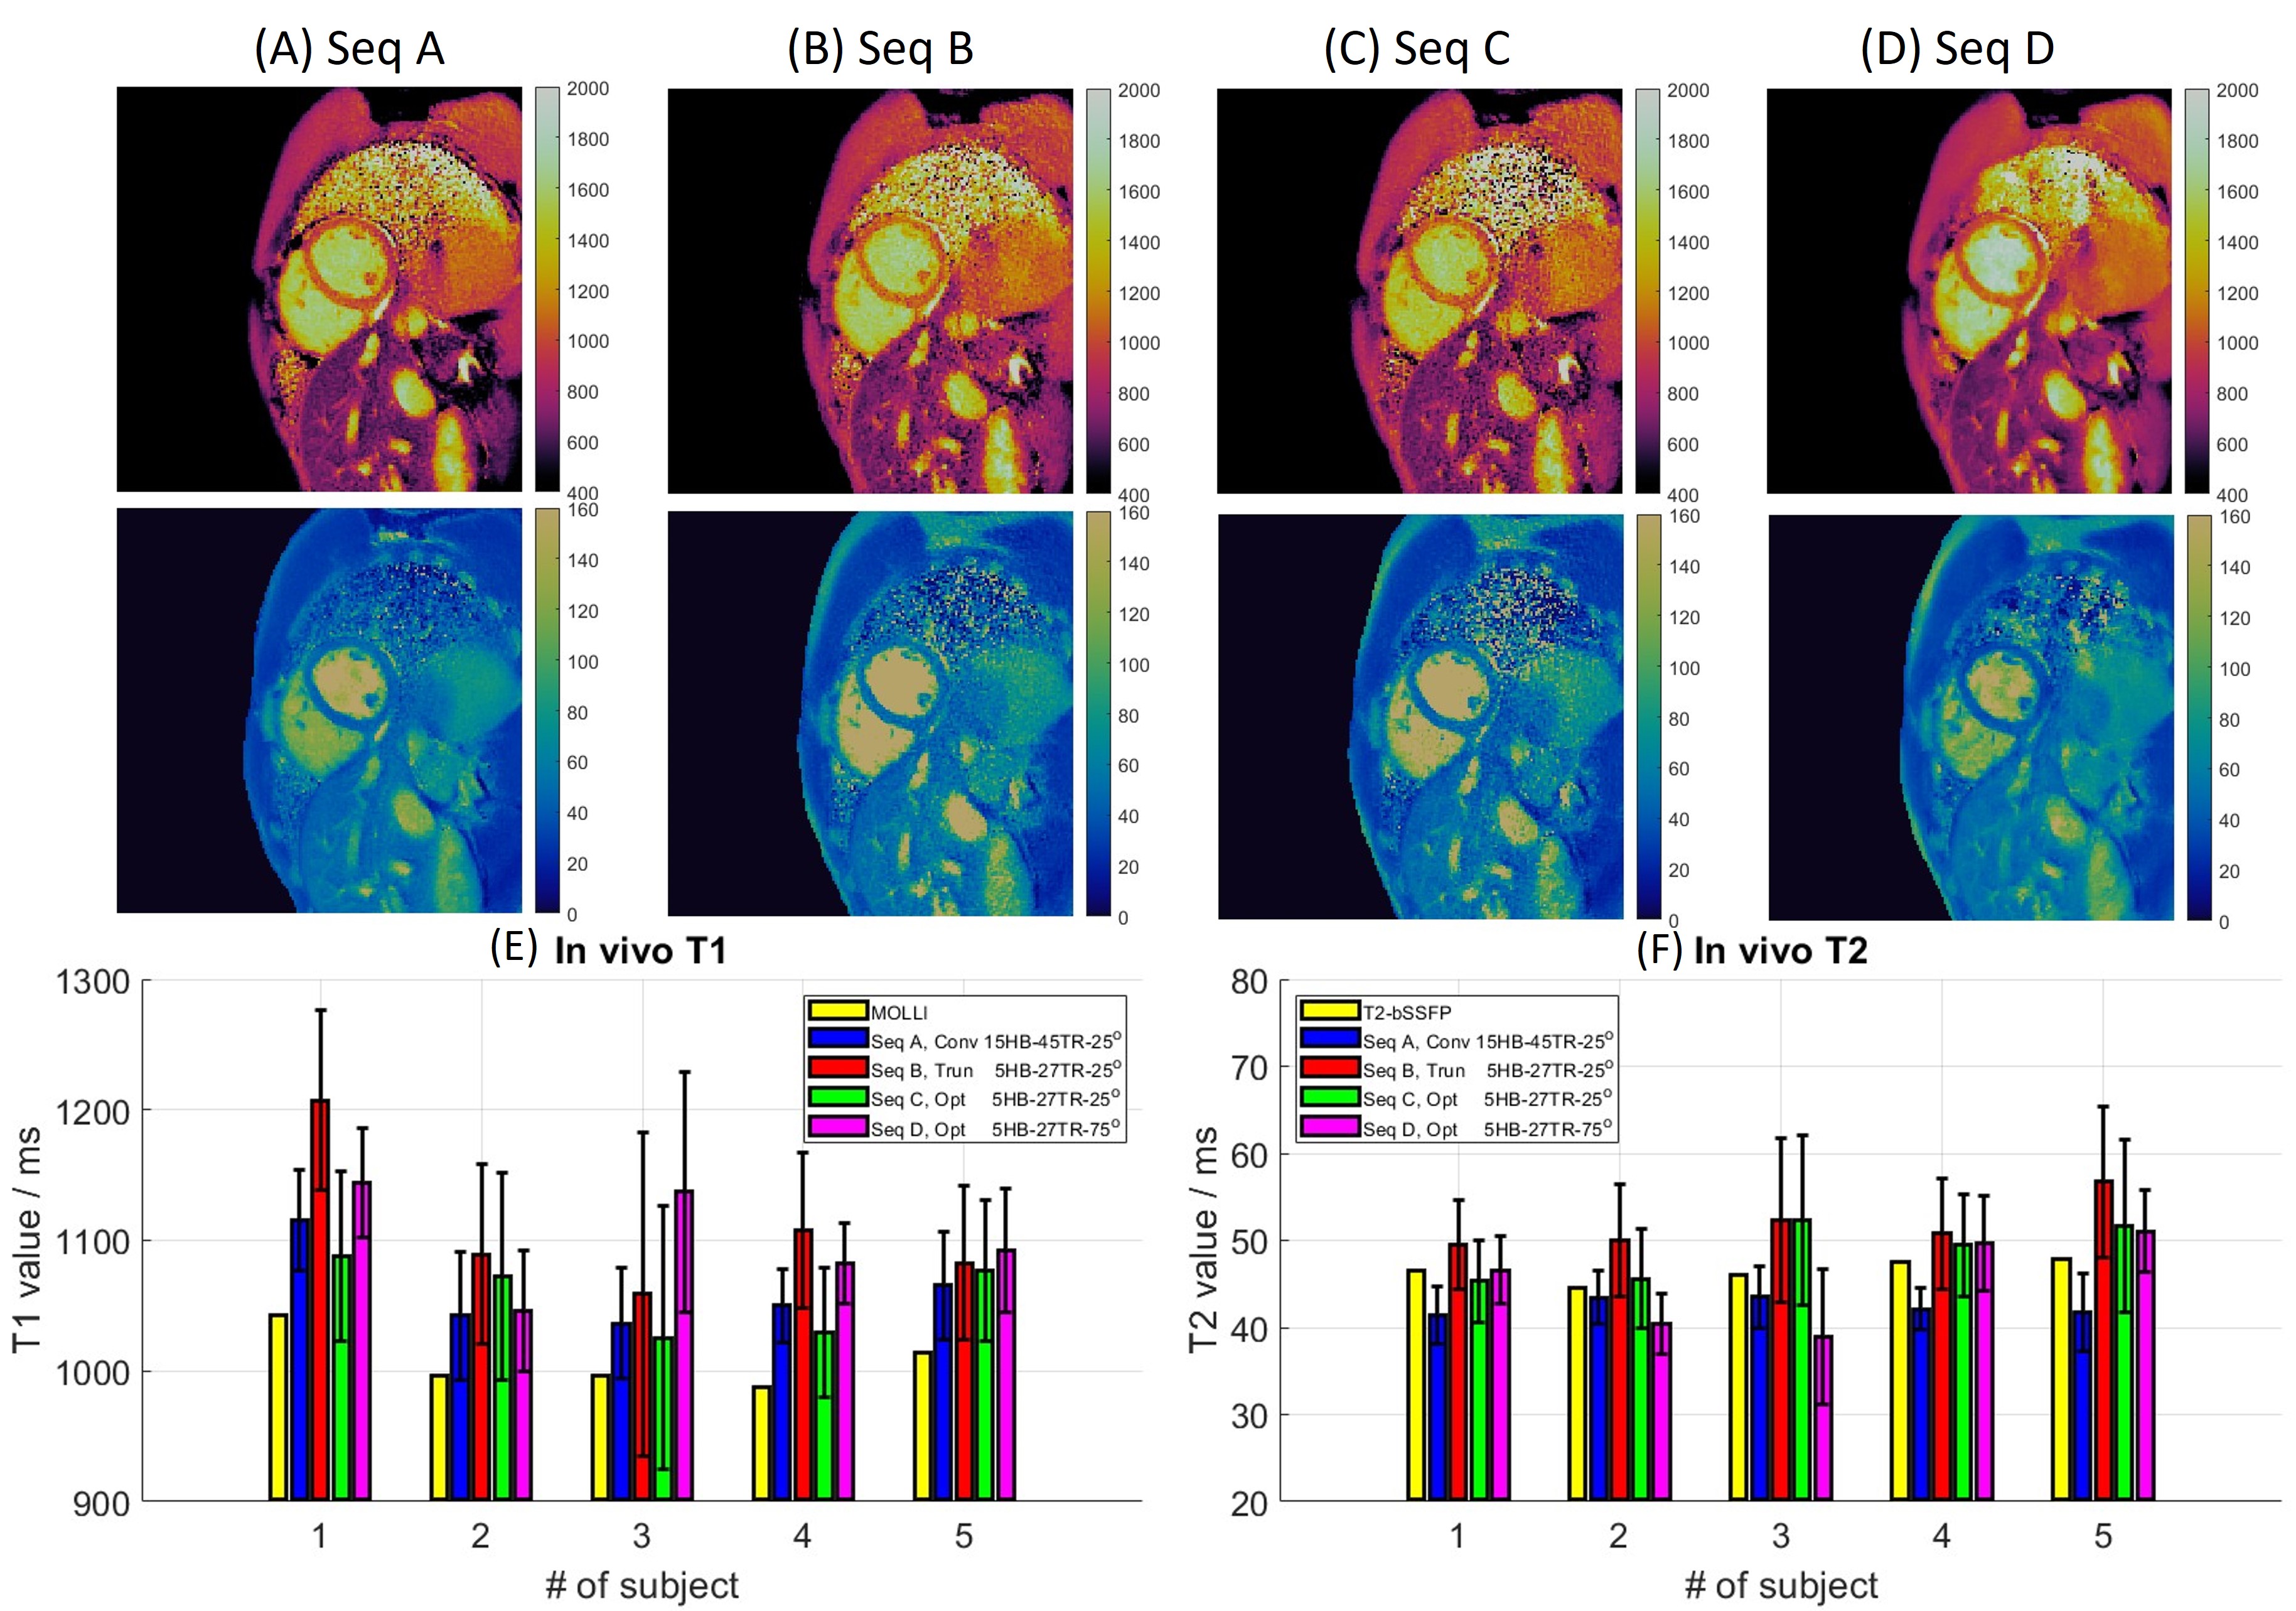
Figure 4: Seq A shows the lowest standard deviations with value of 39.97 for T1 and 3.32 for T2, followed by Seq D with values of 51.66 for T1 and 5.06 for T2. Seq C and B exhibit the highest standard deviations, with value of 69.65 and 76.04 for T1 and 7.20 and 7.22 for T2, respectively. The mean relative errors for T1, calculated across five subjects using Seq B-D with respect to the reference values from Seq A, are as follows: 4.41%, 0.31% and 3.65%, respectively. In the case of T2 measurements, the average relative errors for the same sequences are 22.24%, 15.07% and 7.00%, respectively.