0683
Free-breathing respiratory-navigator-gated 2D radial MR fingerprinting of the transplanted heart at 3T.1Radiology, Department of Radiology, Lausanne University Hospital (CHUV) and University of Lausanne (UNIL), Lausanne, Switzerland, Lausanne, Switzerland, 2Cardiology Service, Cardiovascular Department, Lausanne University Hospital (CHUV) and University of Lausanne (UNIL), Lausanne, Switzerland, Lausanne, Switzerland, 3Department of Radiology, Lausanne University Hospital (CHUV) and University of Lausanne (UNIL), Lausanne, Switzerland, Lausanne, Switzerland, 4CIBM Center for BioMedical Imaging, Lausanne and Geneva, Switzerland, Lausanne, Switzerland
Synopsis
Keywords: Myocardium, Transplantation
Motivation: To acquire T1, T2 and ECV maps in heart transplant recipients using a free-breathing technique that minimizes through-plane motion.
Goal(s): To characterize a free-breathing 2D joint T1/T2 cardiac MR fingerprinting technique named PARMA that includes a lung-liver navigator in the patient setting.
Approach: We compared the resulting maps to gold standard maps in a phantom and to clinical routine maps in 10 healthy volunteers and 9 heart transplant recipients.
Results: We found high accuracy in the phantom and high precision in the volunteers and heart transplant recipients.
Impact: This work demonstrates the feasibility of a free-breathing 2D joint T1/T2 MR fingerprinting in a heart transplant recipient population that cannot always perform long breath holds. The navigator allows a free breathing acquisition with limited through-plane motion.
Introduction
Cardiac allograft vasculopathy (CAV) is a leading cause of mid-term and late post-transplant mortality for heart transplantation patients. It is characterized primarily by a diffuse progressive thickening of the coronary arterial wall 1,2. Previous studies explored the hypothesis that myocardial interstitial fibrosis, as assessed with the MR-derived extracellular volume fraction (ECV), may serve as a biomarker for early-stage CAV 3. In the current study, we aimed to confirm that a modified version of the previously presented free-breathing navigator-gated cardiac magnetic resonance fingerprinting (cMRF) technique PARMA 4 (for PARametric Mapping) can be used to calculate native and post-Method
The free-breathing PARMA pulse sequence consists of a 2D single-shot gradient echo with a continuous radial golden angle trajectory that is preceded by 5 different magnetization preparations. These were an adiabatic inversion pulse, no preparation, and 3 different T2 preparation modules (T2 prep=23/45/70ms) to sensitize the contrast to both T1 and T2 relaxation 5,6 (Figure 1). This set of five preparations was then repeated five times. Respiratory motion was tracked using a lung-liver navigator before the preparation modules and when the navigator was outside of the acceptance window, neither the preparation nor the imaging were activated that heartbeat. The undersampled images were reconstructed using compressed sensing with local low rank regularization along the contrast dimension 7. Non-rigid registration was applied to account for residual in-plane motion.A dictionary was simulated for each acquisition using extended phase graphs (EPG 8 ) for a range of T1 (40:10:3000 ms) and T2 (20:1:100; 102:2:230 ms) values in MATLAB (The Mathworks) and included slice-profile and inversion-inefficiency corrections 9.
PARMA maps of the ISMRM-NIST phantom 10 were acquired in a 3T clinical scanner (Magnetom PrismaFit, Siemens Healthineers, Erlangen, Germany) with matrix size=192x192, pixel size=(1.56mm)2, slice thickness=8mm, TR=3.49 ms, and TE=1.56ms. Clinical routine T1 and T2 maps (pixel size=(1.8-1.9mm)2, slice thickness 8mm) were acquired using MOLLI 11 and T2-prepared bSSFP T2 mapping 12, respectively. To establish the accuracy of the technique, a linear regression of the resulting relaxation times was made with those of the inversion-recovery and spin-echo gold standard techniques, respectively.
The in-vivo study was approved by the local ethics committee and all participants provided written informed consent. PARMA was applied in N=9 heart transplant recipients (58±9y, 3F, time since transplant = 8±5y) at mid-ventricular, basal and apical short-axis, and at 4-chamber orientations pre- and post-contrast-agent injection (0.1 mmol/kg Gadovist, Bayer), and mid-ventricular pre-contrast in N=10 healthy volunteers (27±3y, 3F) at mid-ventricular pre-contrast. Breath-held native and clinical routine T1 and T2 maps were obtained in the mid-ventricular orientation. PARMA ECV maps were calculated based on the registered T1 maps 13.
Results
The NIST phantom PARMA T1 and T2 relaxation times showed a narrow agreement with the gold standard techniques (Figure 2). PARMA had a higher T1 accuracy than MOLLI with a slope closer to identity (1.07 vs 0.76, P<0.01). PARMA had a similar T2 accuracy with a slope of 1.08.In all 10 healthy volunteers and 9 transplant recipients high quality maps were obtained (Figure 3). None of the transplant recipients had allograft rejection, and only two had CAV, which precluded statistical separation into subgroups. Both the native PARMA T1 and T2 values were similar in the two groups but varied less in the healthy volunteers (1311±44ms and 46.9±2.9ms) than in the transplant recipients (1246±129ms and 45.8±6.8ms). Bland-Altman analysis (Figure 4) showed a difference between PARMA and the reference techniques that was consistent with the phantom results. ECV values were in line with reported values (34.5±6.1%) and anecdotally resulted in the characterization of the extent of an old coronary dissection in one patient (Figure 5).
Discussion
PARMA maps had high accuracy in the phantom and were successfully acquired with high precision in all participants and without the need of breath hold, which can be challenging for those patients.The broad range of T1 values in these hearts long after their transplantation needs to be further explored in a larger cohort, including those with confirmed CAV. Incorporating B1 mapping 6 might reduce the apparent T1 inter-subject variability.
In conclusion, we preliminarily demonstrated the feasibility of respiratory navigator-gated cMRF in heart transplant patient.
Acknowledgements
This study was funded by a grant from the Swiss National Science Foundation (grant number CRSII5_202276).References
1. Hamilton JI, Jiang Y, Chen Y, et al. MR fingerprinting for rapid quantification of myocardial T1 , T2 , and proton spin density. Magn. Reson. Med. 2017;77:1446–1458 doi: 10.1002/mrm.26216.
1. Lund, L.H., et al. The Registry of the International Society for Heart and Lung Transplantation: Thirty-fourth Adult Heart Transplantation Report. 2017; Focus Theme: Allograft ischemic time. J Heart Lung Transplant. 2017; 36(10): p. 1037-1046.
2. Ramzy, D, et al. Cardiac allograft vasculopathy: a review. Can J Surg. 2005 Aug;48(4):319-27. PMID: 16149368; PMCID: PMC3211528.
3. van Heeswijk, R.B., Bastiaansen, J.A.M., Iglesias, J.F. et al. Quantification of myocardial interstitial fibrosis and extracellular volume for the detection of cardiac allograft vasculopathy. Int J Cardiovasc Imaging. 2020; 36, 533–542 doi: 10.1007/s10554-019-01733-.
4. Calarnou, P., et al. Navigator acceptance window width does not affect accuracy and precision in free-breathing 2D cardiac MR fingerprinting of the myocardium at 3T. ISMRM 2023, #3999
5. Cruz G, Jaubert O, Qi H, et al. 3D free-breathing cardiac magnetic resonance fingerprinting. NMR Biomed. 2020;33:e4370 doi: 10.1002/nbm.4370.
6. Henningsson M. Cartesian dictionary-based native T1 and T2 mapping of the myocardium. Magn. Reson. Med. 2022;87:2347–2362 doi: 10.1002/mrm.29143.
7. Di Sopra L, Roy CW, Bastiaansen JAM, et al. Fully Self-Gated Cardiac and Respiratory Motion-Resolved Isotropic 5D T1 Mapping of the Heart: Preliminary Results. In: Proc Int Soc Magn Reson Med 27. Montréal QC, Canada; 2019.
8. Malik SJ, Padormo F, Price AN, Hajnal JV. Spatially resolved extended phase graphs: modeling and design of multipulse sequences with parallel transmission. Magn. Reson. Med. 2012;68:1481–1494 doi: 10.1002/mrm.24153.
9. Hamilton JI, Jiang Y, Ma D, et al. Investigating and reducing the effects of confounding factors for robust T1 and T2 mapping with cardiac MR fingerprinting. Magn. Reson. Imaging 2018;53:40–51 doi: 10.1016/j.mri.2018.06.018.
10. Stupic KF, Ainslie M, Boss MA, et al. A standard system phantom for magnetic resonance imaging. Magn. Reson. Med. 2021;86:1194–1211 doi: 10.1002/mrm.28779.
11. Messroghli DR, Radjenovic A, Kozerke S, Higgins DM, Sivananthan MU, Ridgway JP. Modified Look-Locker inversion recovery (MOLLI) for high-resolution T1 mapping of the heart. Magn. Reson. Med. 2004;52:141–6 doi: 10.1002/mrm.20110.
12. Giri S, Chung YC, Merchant A, et al. T2 quantification for improved detection of myocardial edema. J Cardiovasc Magn Reson 2009;11:56 doi: 1532-429X-11-56 [pii] 10.1186/1532-429X-11-56.
13. Messroghli, D.R., Moon JC, Ferreira VM, Grosse-Wortmann L, He T, Kellman P, Mascherbauer J, Nezafat R, Salerno M, Schelbert EB, Taylor AJ, Thompson R, Ugander M, van Heeswijk RB, Friedrich MG. Clinical recommendations for cardiovascular magnetic resonance mapping of T1, T2, T2* and extracellular volume: A consensus statement by the Society for Cardiovascular Magnetic Resonance (SCMR) endorsed by the European Association for Cardiovascular Imaging (EACVI). J Cardiovasc Magn Reson. 2017 Oct 9;19(1):75. doi: 10.1186/s12968-017-0389-8. Erratum in: J Cardiovasc Magn Reson. 2018 Feb 7;20(1):9. PMID: 28992817; PMCID: PMC5633041.
Figures
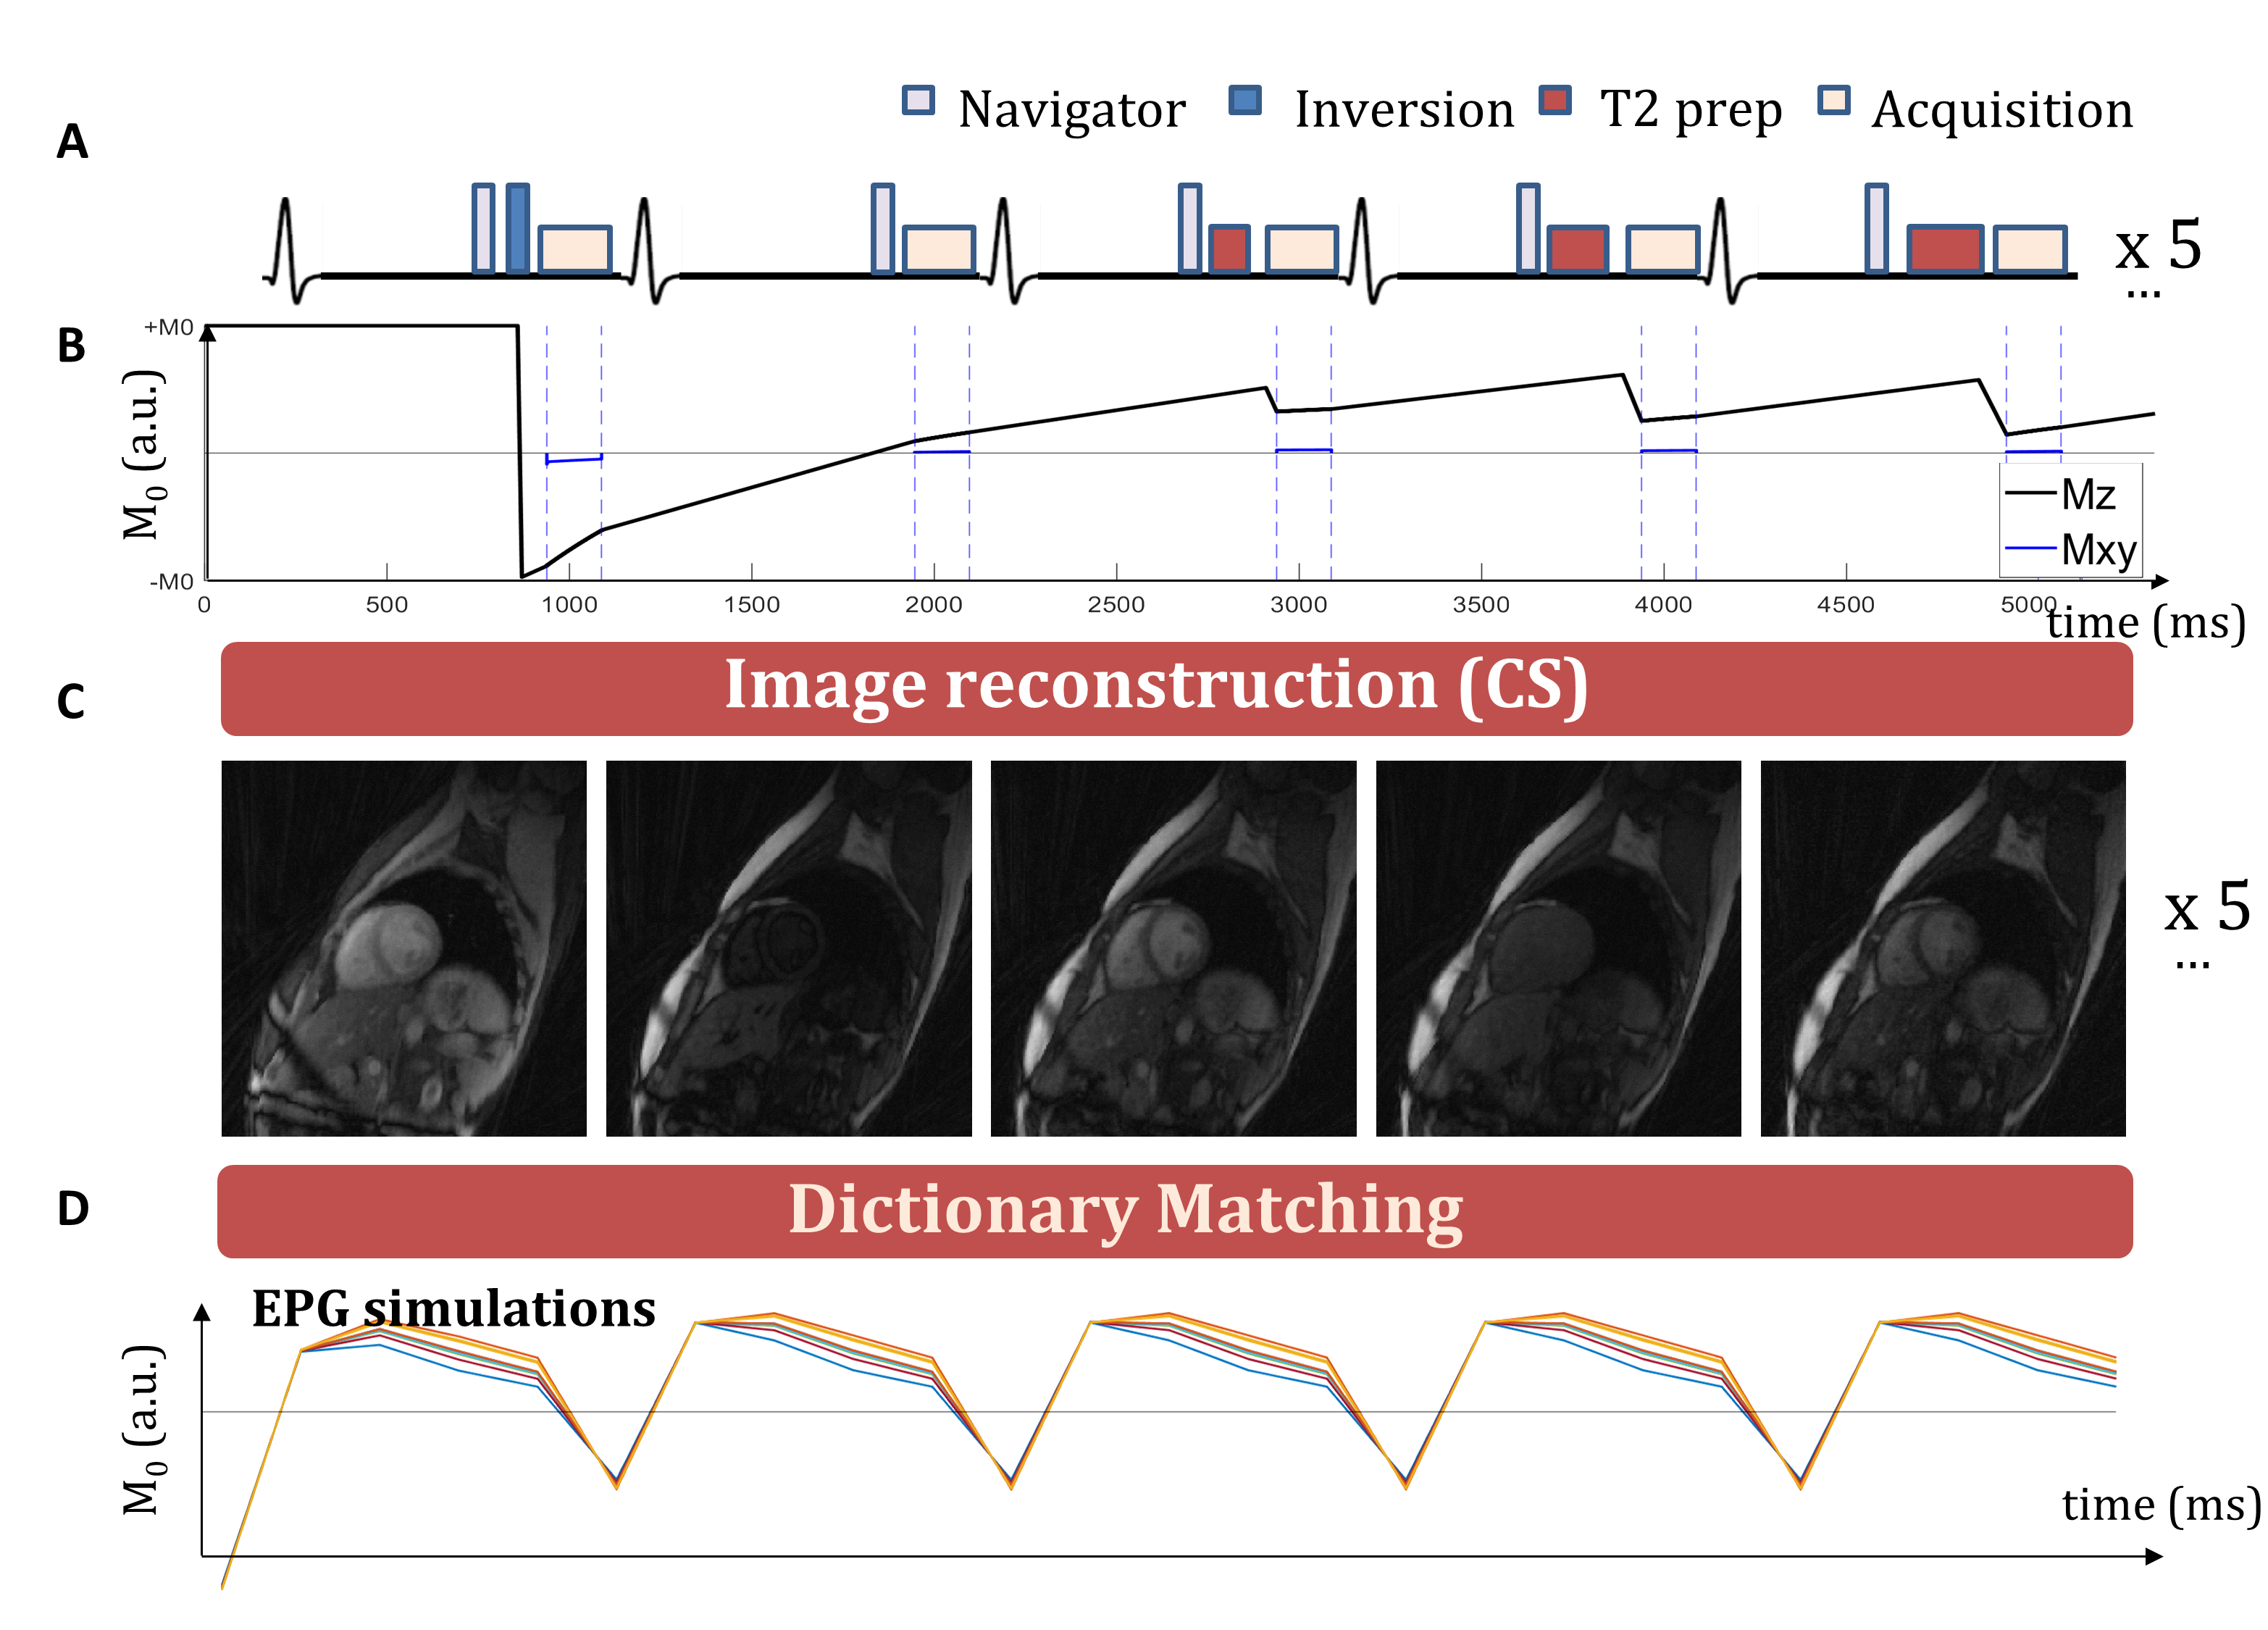
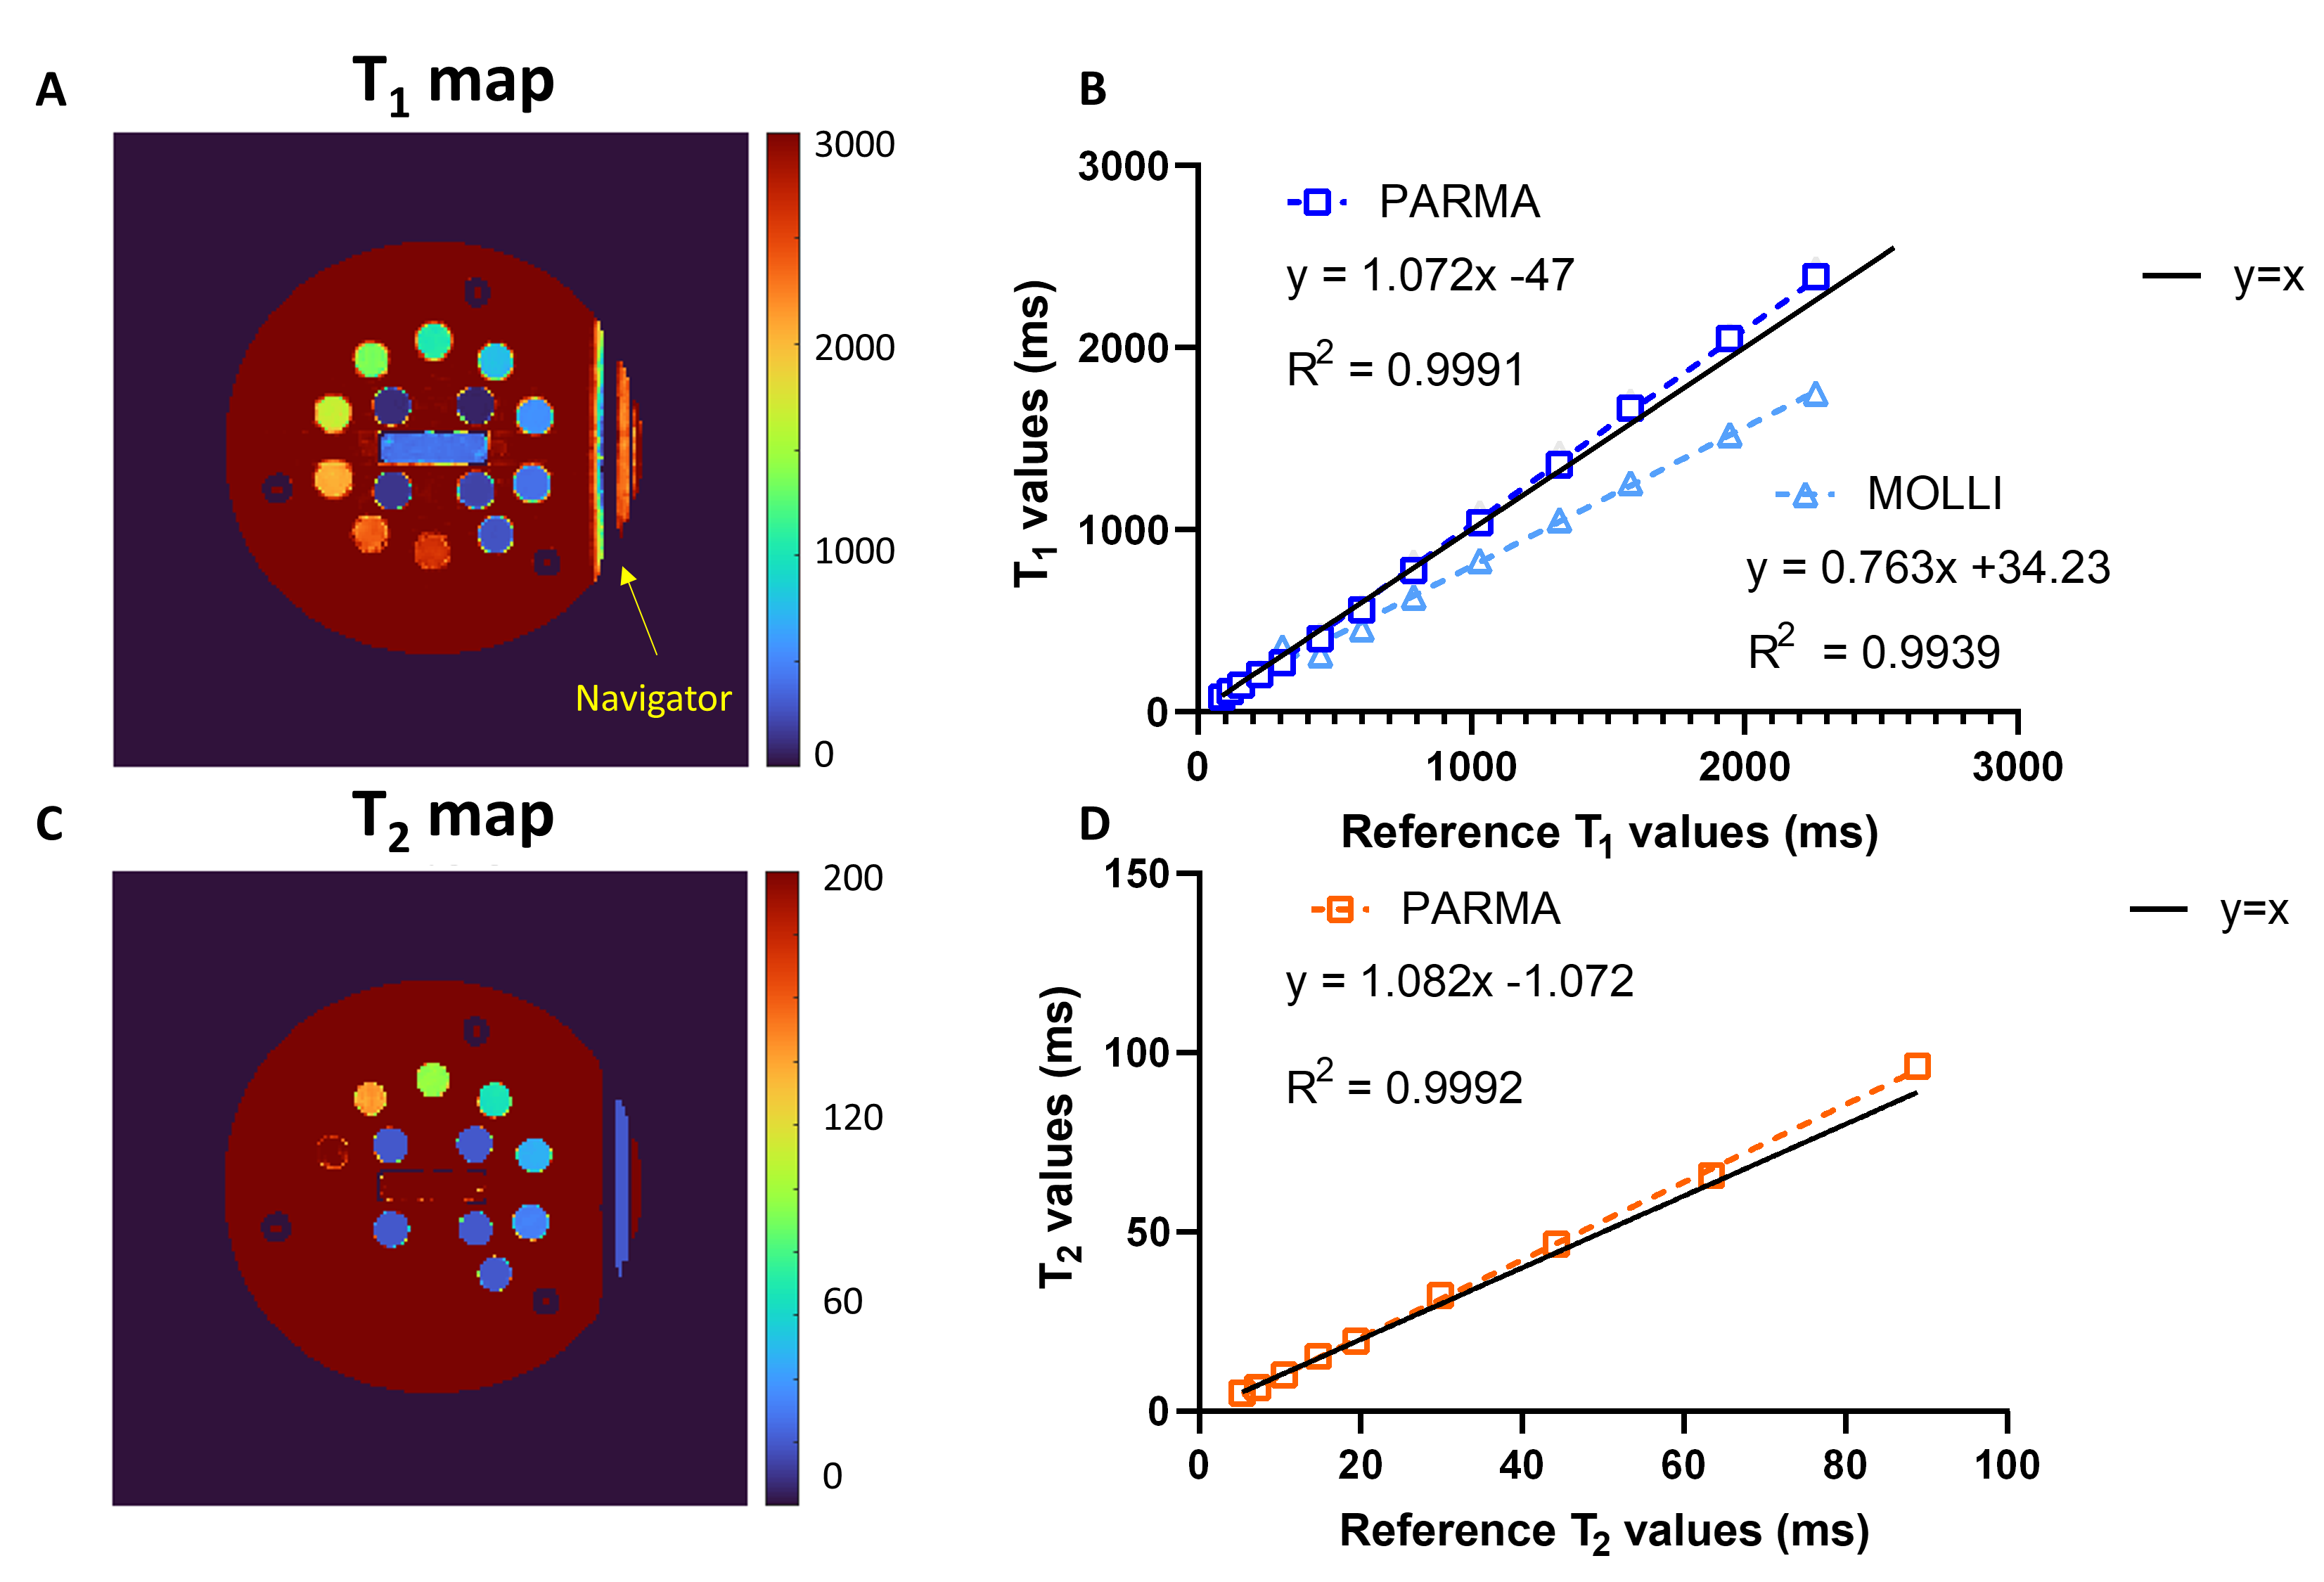
Figure 2. Accuracy of PARMA T1 and T2 maps in the ISMRM-NIST phantom compared to gold-standard techniques. A) T1 map of the ISMRM-NIST phantom obtained with PARMA. B) Linear regression plots of T1 values in the phantom in the myocardial T1 mapping range together with the clinical routine MOLLI sequence. C) T2 map of the reference phantom obtained with PARMA. D) Linear regression plots of T1 values in the phantom in the myocardial T2 mapping range. The T2prep-bSSFP T2 values were not included as the technique did not perform well in this phantom due to its variable T1 relaxation times.
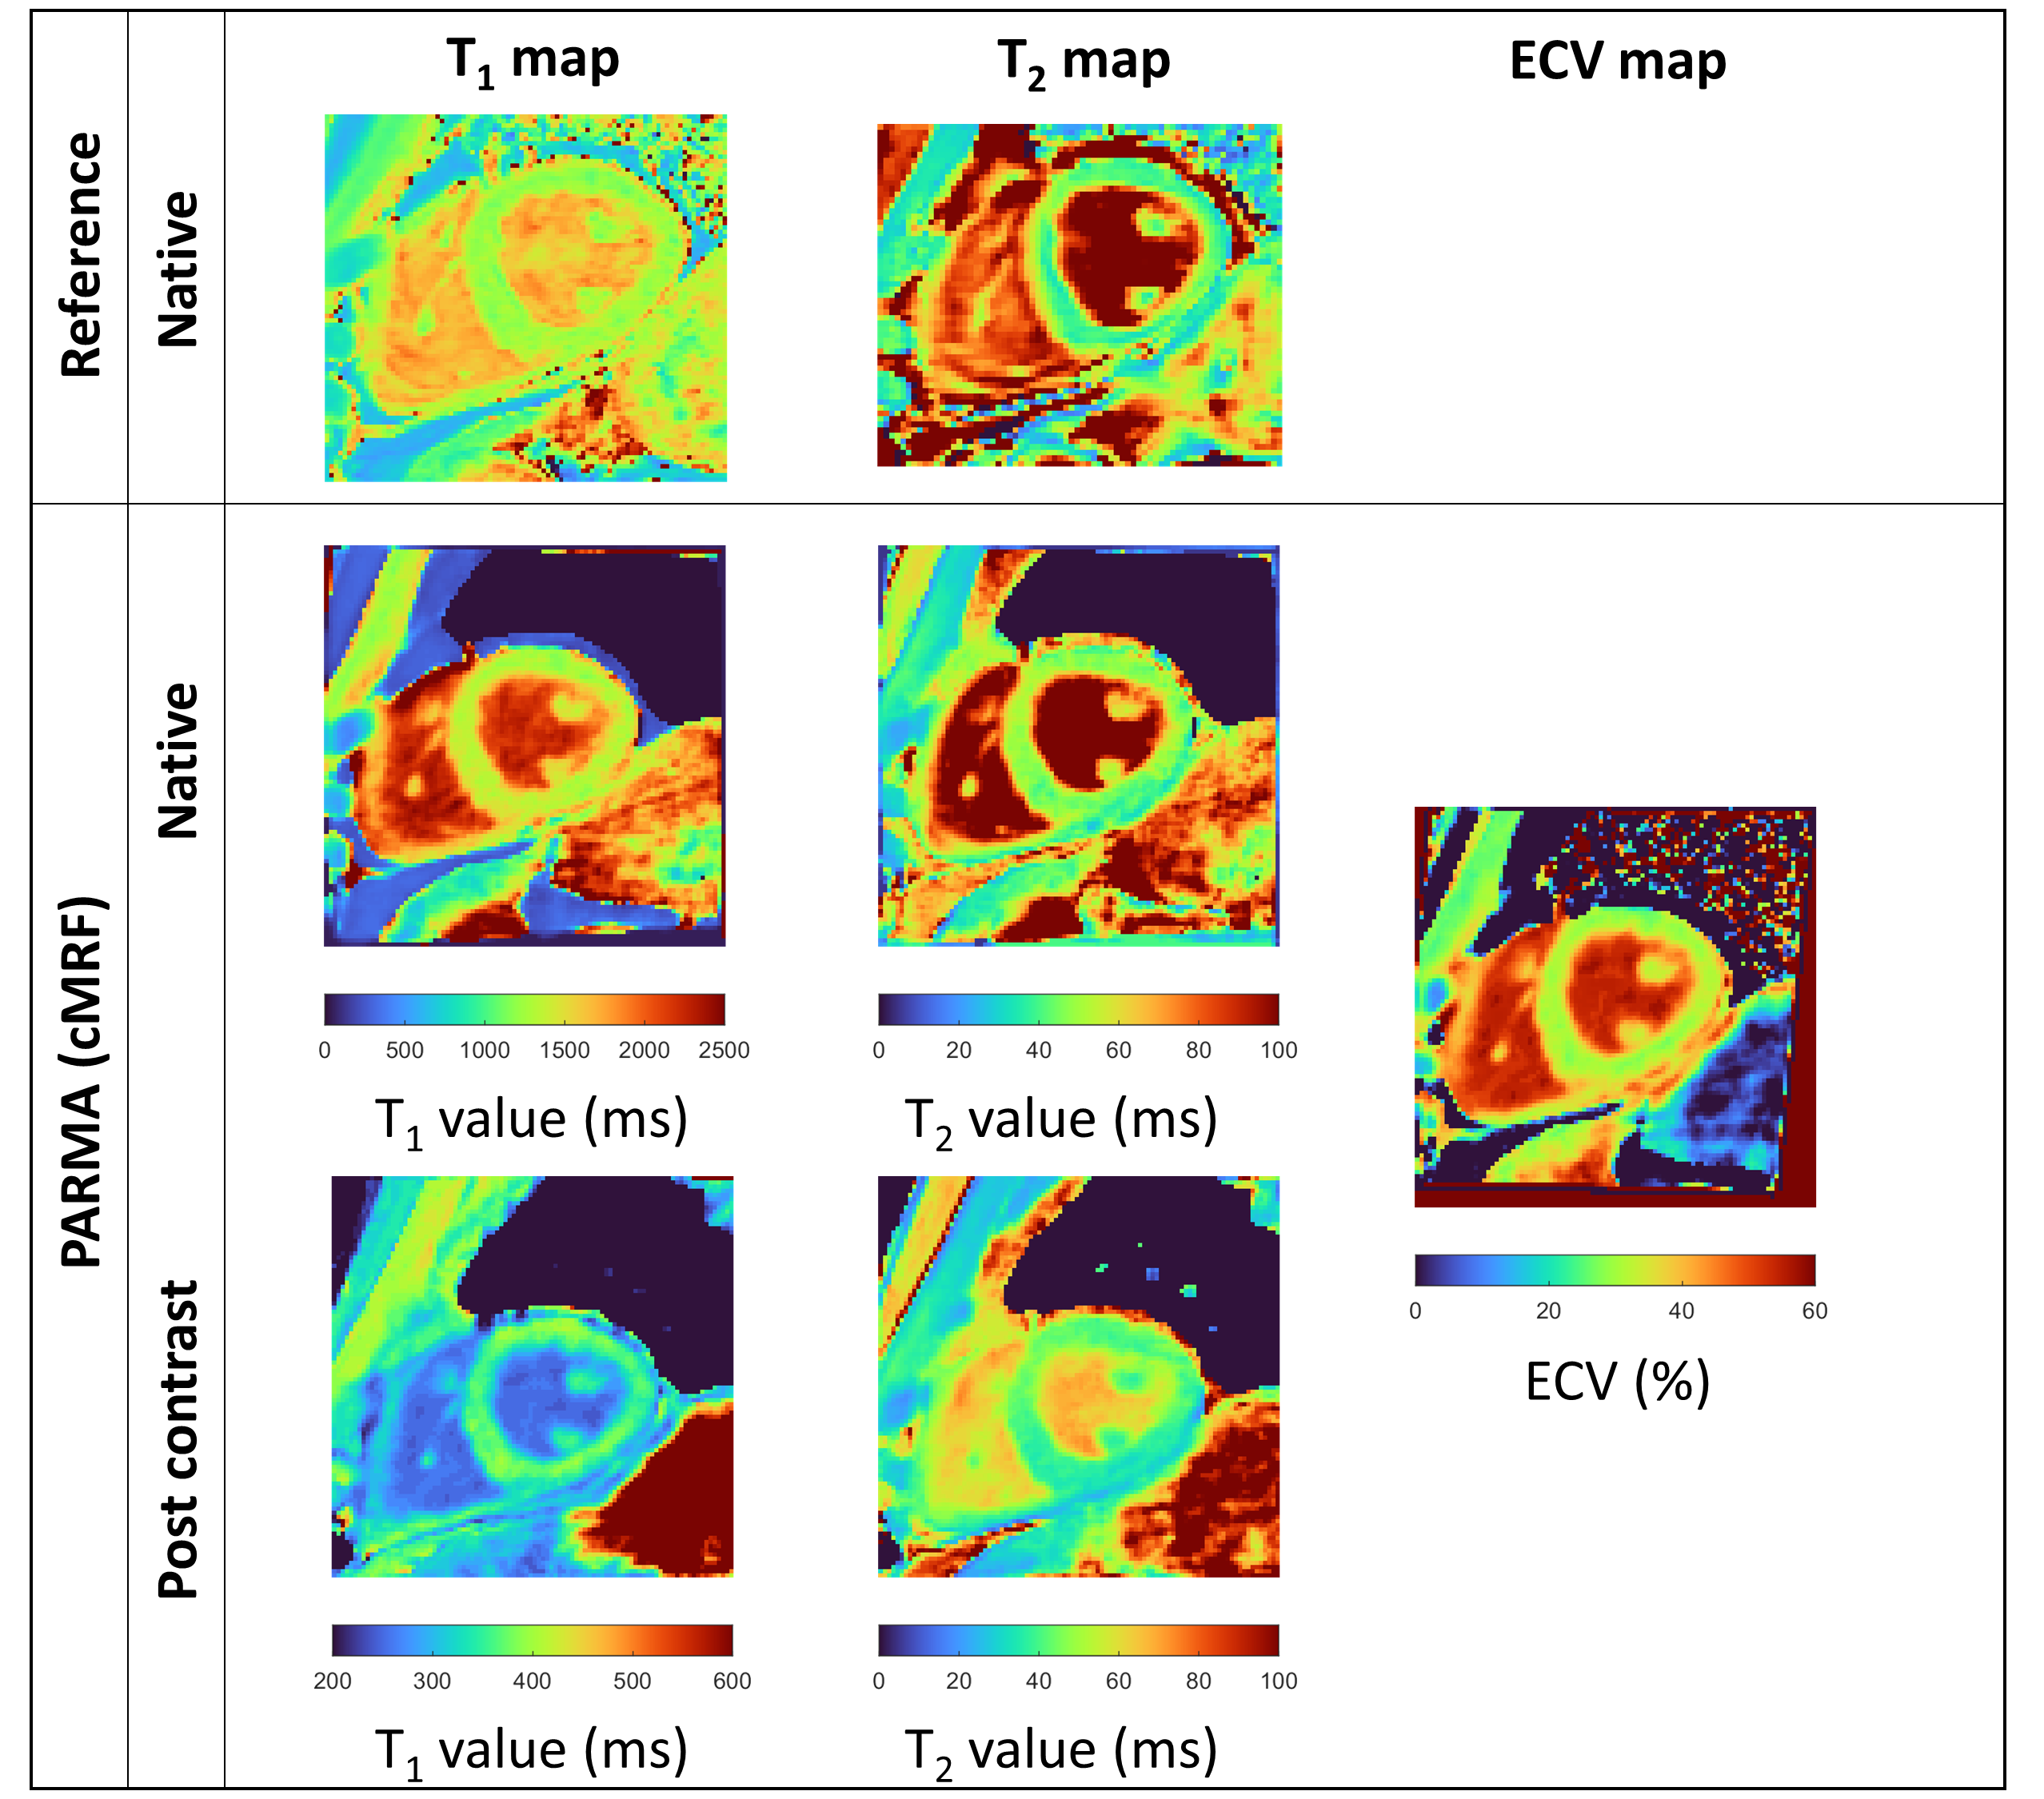
Figure 3. PARMA T1 and T2 maps pre and post gadolinium, and PARMA based ECV maps, compared to the Reference techniques in a heart transplant recipient. Homogeneous myocardium value and sharp myocardium-blood interface is observed in both native and post contrast maps. The ECV map present the same characteristic. Good visual agreement with the reference technique can be observed.
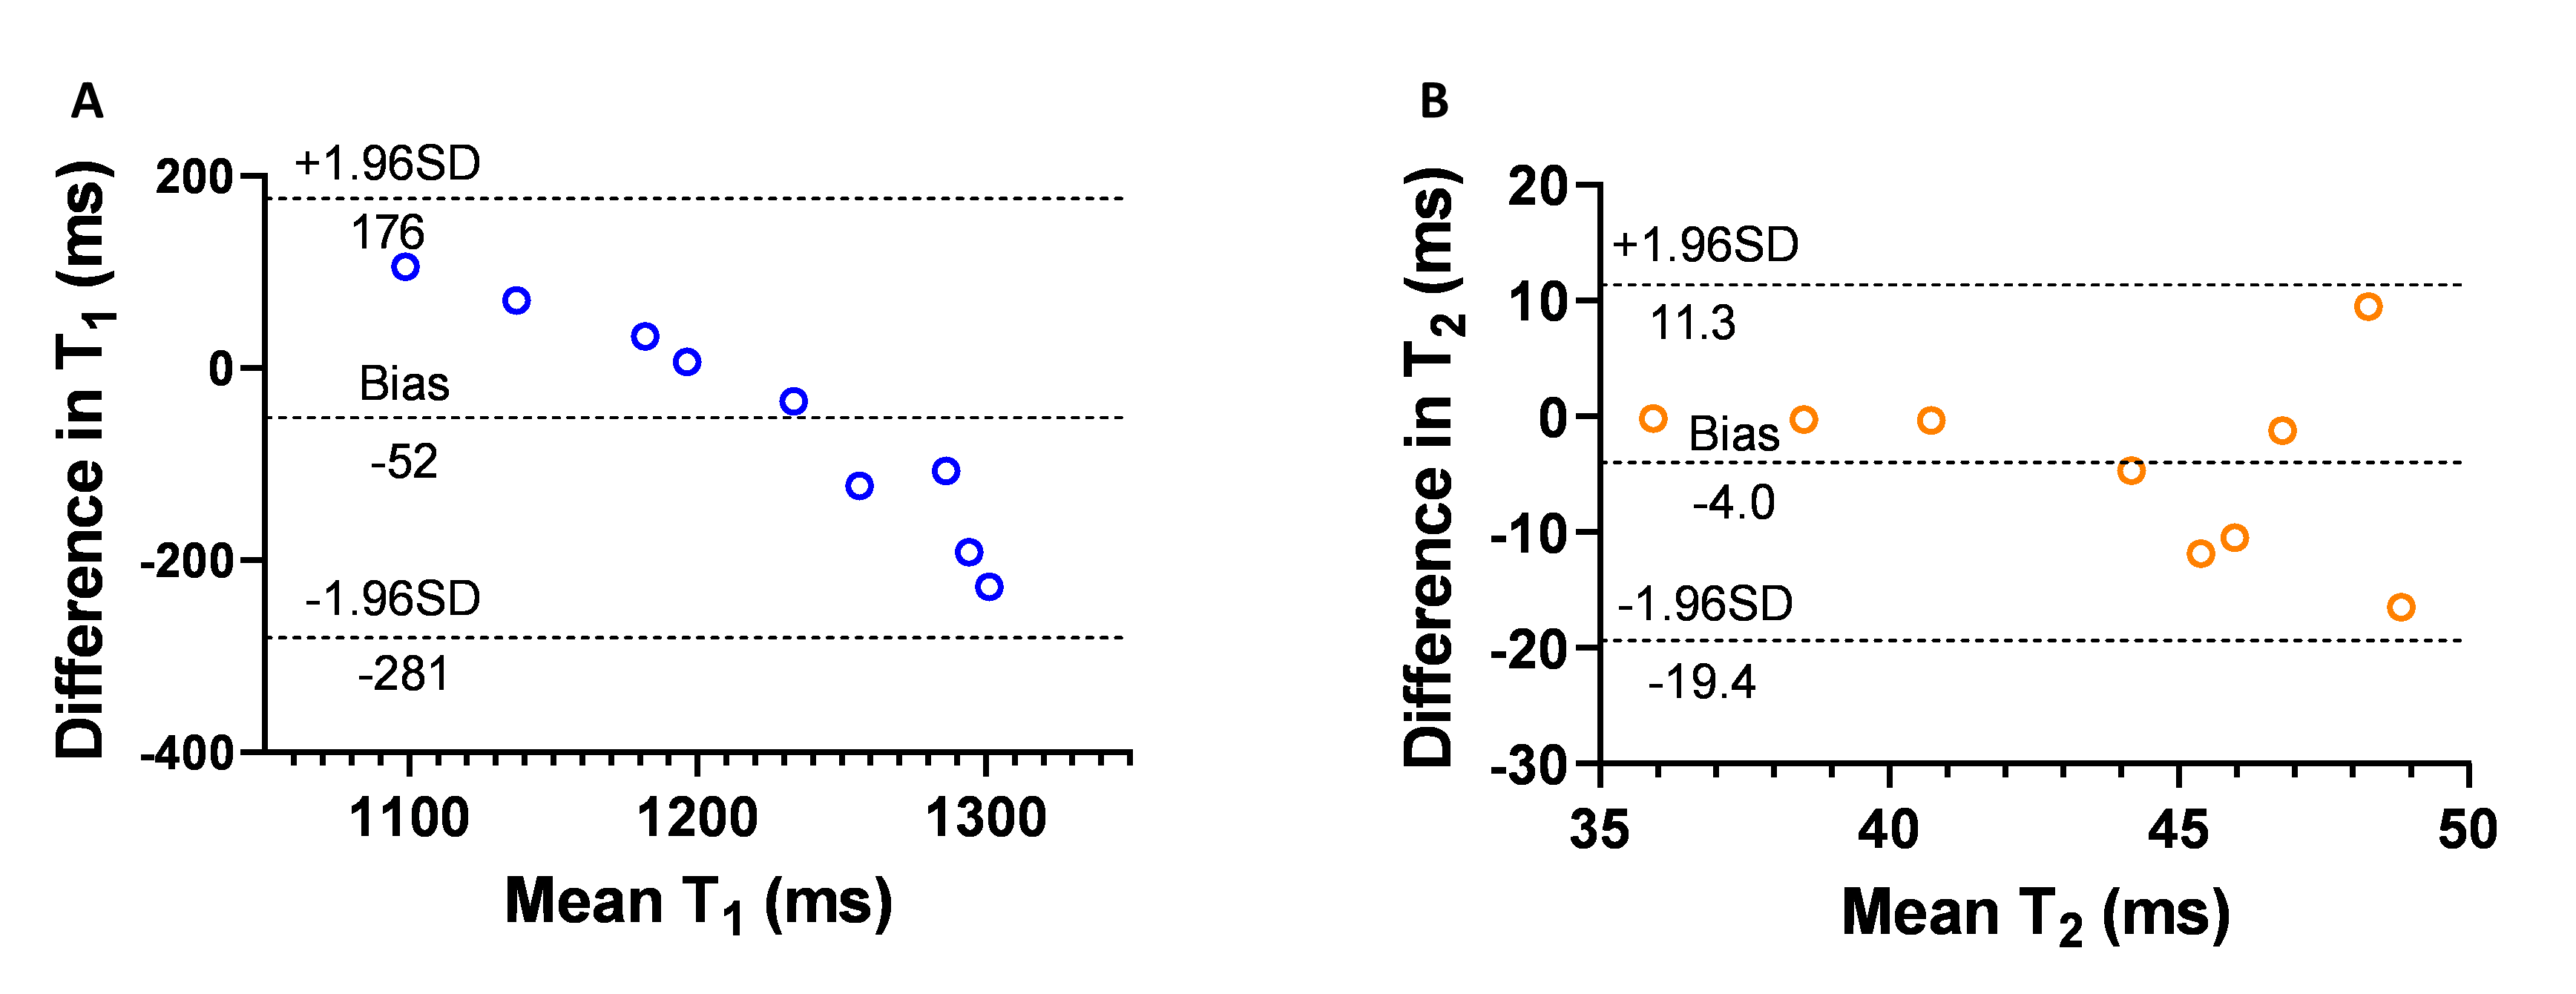
Figure 4. Bland-Altman and correlation plot of the agreement between PARMA native T1 and T2 values in the mid-ventricular slice of the heart transplant patients.
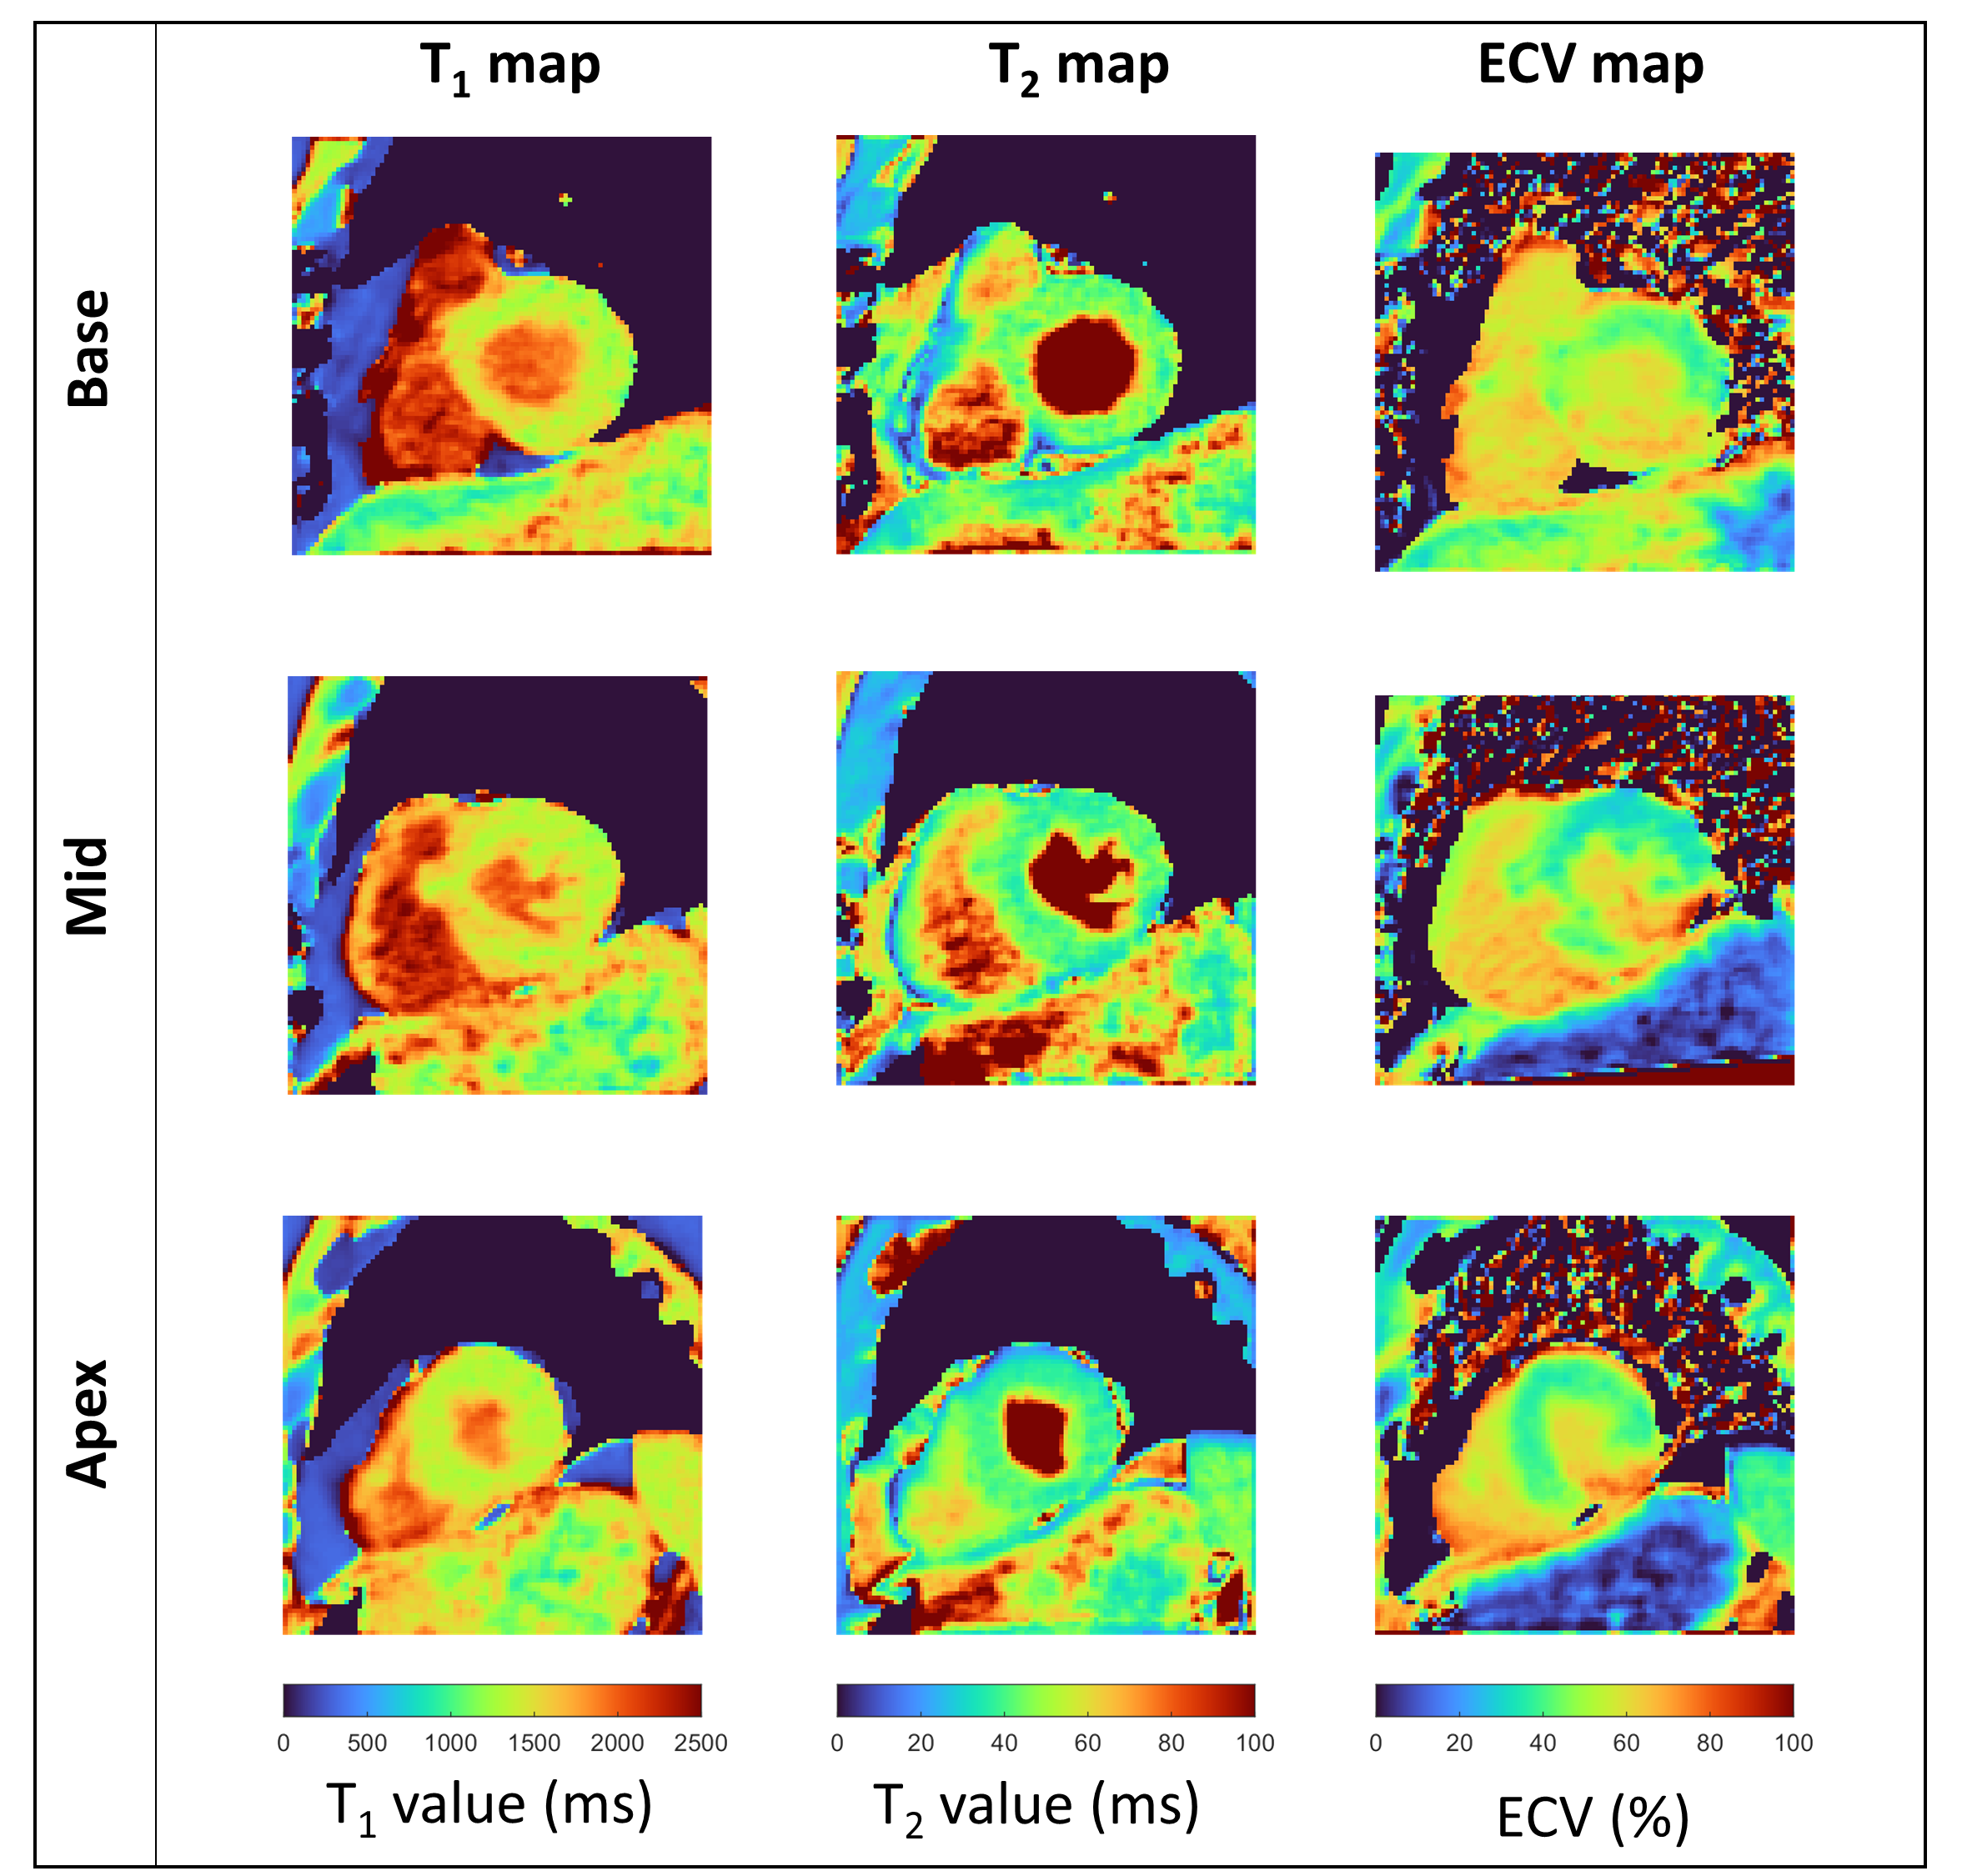
Figure 5. PARMA T1 and T2 maps, and PARMA based ECV maps in mid-ventricular, basal and apical orientation of a patient with a coronary dissection. The region impacted is visible on the ECV maps in the three orientations, in the inferolateral segment.